Japan Advanced Institute of Science and Technology
JAIST Repository
https://dspace.jaist.ac.jp/
Title チンパンジーの解剖学的にリアルな鼻腔モデル内の流
れと空調の数値シミュレーション
Author(s) Samarat, Kaouthar Citation
Issue Date 2017‑09
Type Thesis or Dissertation Text version ETD
URL http://hdl.handle.net/10119/14832 Rights
Description Supervisor:前園 涼, 情報科学研究科, 博士
A
A Numerical Simulation of Flow and Air-conditioning
in Anatomical Realistic Nasal Cavity Model of Chimpanzee
a
SAMARAT Kaouthar
Japan Advanced Institute of Science and Technology
Doctoral Dissertation
Numerical Simulation of Flow and Air-conditioning in Anatomical Realistic Nasal Cavity Model of Chimpanzee
SAMARAT Kaouthar
Supervisor: KOTANI Kazunori
School of Information Science
Japan Advanced Institute of Science and Technology
September, 2017
ii
iii
ABSTRACT
Traditional research approaches into nasal airways have been critical due to their invasive nature. Recently, with the growth of medical imaging field, it became possible to reconstruct computer models from computed tomography (CT) scans to study the airflow within the nasal passages. Nasal cavity of primates and other animals has been reported in many research works.
Lots of the previous studies focused on the nasal airflow but few of them considered the internal nasal air-conditioning phenomena. Furthermore, a proper study of the nasal topology, nasal airflow, and nasal air-conditioning of human’s closest being, the chimpanzee, has never been reported.
Nowadays the chimpanzee is regarded as an endangered species which requires specific care and interest. The spread of respiratory infectious diseases is among the crucial dangers to chimpanzees. Addressing the nasal airways, which are the most superior organ of breathing system, is essential for pathologists involved in chimpanzee’s medicine. The study of nasal cavity, nasal airflow patterns, and nasal air-conditioning distributions can be a prerequisite to understand chimpanzee’s nasal physiology.
The aim of this research is to understand fundamentally the anatomy, inspiratory airflow, and air-conditioning physics of chimpanzee nasal passages. Because the lack of details on the chimpanzee nasal topology, we reconstructed a three- dimensional computer model of the chimpanzee nasal airways based on CT scans.
A detailed description of the nasal anatomy was given based on representative coronal cross-sections of the chimpanzee computer nasal model. An inhalation phase of the airflow was simulated and detailed analysis of the airflow structure within the chimpanzee nasal cavity was reported. The distribution of air-conditioning into the chimpanzee nasal cavity was investigated in distinct sections of the nasal passages, and a comparison of nasal air-conditioning performance between human and chimpanzee was considered.
The results of this study revealed a triangular shaped nasal geometry, as seen from side view, remarkably long and high enough for an efficient air-conditioning. The airflow structure inside the chimpanzee nasal cavity depended on the nasal topology. The inspiratory flow accelerated through the nasal valve, which displayed the smallest cross-sectional area. We noticed the existence of an anterior ventral vortex in the nasopalatine duct region and a dorsal vortex in the olfactory region.
We attributed the appearance of both vortices to the increasing of the cross-section in the nasal valve area.
The protrusion of turbinates inside the nasal airways promotes a streamlined airflow in the central nasal passage. The horizontal nostrils and nasopharynx produced a horizontally straight airflow streamlines during inhalation. The computational fluid dynamics model revealed that the inhaled air flows at larger volume and higher rate in the middle airways of the nasal passage, while only small proportion reached the inferior meatus that was created following the protrusion of the inferior turbinate. The superior airways,where the olfactory epithelium is located, passes the least flow at lowest velocity. The minor airflow rate noticed in the dorsal upper part of the nasal cavity reflects a defense strategy that guards the sensitive olfactory nerves to be damaged. The observed vortex in the upper dorsal area of the nasal passage, near the olfactory region, appeared to distract airstreams at high velocity away from the olfactory epithelium.
Simulation of air-conditioning distribution showed that temperature and humidity were gradually adjusted in the middle part of the nasal passages, leading to a conditioned inhaled air at the nasopharynx region. Within the central nasal passages, the air-conditioning was quickly established and adjusted in the regions adjacent to and/or surrounded by the nasal lining such as the meatuses as the heat and water can be immediately exchanged between the tissue layer and the air stream via the epithelial layer, in contrast to the air flowing in the middle passage. No effective air-conditioning was observed within the frontal region of the nasal vestibule. We attributed this fact to the long horizontal nostrils of chimpanzee that are not highly vascular mucous lined airways, consequently cannot provide an ease exchange for heat and water transfer with the inspiratory flow stream. The Chimpanzee’s nostrils luminal wall is lined by a squamous layer.
Keywords: Numerical simulation, Chimpanzee nasal cavity, Computational fluid dynamics, Nasal airflow, Nasal air- conditioning.
ii
To my parents, Hasan & Fatima who taught me over the years the worth of labor and persistence, values that propped me to get to this point.
iii
ACKNOWLEDGEMENTS
I am eager to acknowledge my former supervisor, Pr. Teruo Matsuzawa, for his direction, patience and wise mentoring throughout the course of my thesis. His constant
encouragement kept me energized throughout my studies.
Thanks to Prof. Ryo Maezono for his effort towards the success of my research assistant scholarship and for providing an enriching intellectual environment, generous laboratory
resources and logistical support. I have always cherished working in such place.
I likewise thank my latter and research studentship’s supervisor, Pr. Kazunori Kotani for welcoming me into his research team. I appreciate his guidance and eagerness to help me.
It has been an honor and privilege to join his laboratory. I am appreciative for this fulfilling experience.
I am also indebted to my sub-theme supervisor Prof. Mun’delanji C. Vestergaard. She has been exceptionally munificent with her time and means. Her continuous support and patient guidance to finish my project kept me motivated and happy to work hard. I am unable to show plenty my gratefulness for her support and kindness throughout the years.
I would also like to acknowledge my research groupmate who have always provided assistance where necessary, especially Dr. Futoshi Mori who gave me guidance, advice and help in solving all types of technical problems related to the 3D reconstruction of the
CT scans, and Dr. Sho Hanida for his technical support in the CFD simulations.
Finally, I am deeply grateful to my kind parents, brother, and sisters for their continued patience, encouraging words, strong support, and love which I have received for the completion of my degree; especially my father Hasan Samarat for his concern, careful
advice, boundless support, and constant motivation, which greatly contributed to my ability to finish my research.
Last but not least, I would like to express my utmost recognition to my lovely daughters Balkis, Sajda & Fatima who gave me strength and confidence through my tortuous
journey. Their daily presence has been a great source of inspiration for me.
I admire their sympathetic. I might not have finished this without your amorous sustenance. I am really blessed to have you as daughters and greatest friends.
SAMARAT Kaouthar
September, 2017
iv
TABLE OF CONTENTS
Chapter Page
I. INTRODUCTION ...10
1.1 Motivation ...10
1.2 Objectives ...12
1.3 Methodology ...12
1.4 Dissertation structure ...13
II. LITERATURE REVIEW ...15
III. MODELLING OF CHIMPANZEE NASAL GEOMETRY ...19
3.1 Medical image processes ...19
3.1.1 Computed tomography (CT) ...19
3.1.2 Comparison between CT and MRI ...20
3.2 Computational model of the chimpanzee nasal cavity ...22
3.2.1 Anatomical data ...22
3.2.2 Extraction: Sub-image creation ...23
3.2.3 Surface reconstruction ...24
3.2.4 Smoothing ...26
3.3 Development of the CFD model ...28
3.3.1 CFD model ...29
IV. NUMERICAL METHOD ...31
4.1 Introduction ...31
4.2 Fluid flow general governing equations ...31
4.3 Numerical solver procedure ...33
4.4 Fluid flow discretization ...36
V. NASAL ANATOMY OF CHIMPANZEE ...39
5.1 Chimpanzee nasal topology ...37
5.1.1 Nasal vestibule ...39
v
Chapter Page
5.1.2 Central nasal passages ...40
5.1.3 Nasopharynx ...40
5.2 Discussion ...41
VI. NASAL AIRFLOW AND AIR-CONDITIONING IN CHIMPANZEE...43
6.1 Introduction ...43
6.2 Computational flow model ...44
6.3 Boundary conditions ...45
6.4 Computational parameters ...48
6.5 Flow patterns ...49
6.5.1 Nasal vestibule ...50
6.5.2 Central nasal airways ...51
6.5.3 Nasopharynx ...51
6.6 Air-conditioning distributions ...52
6.7 Discussion ...54
6.7.1 Comparison of nasal airflow to human and rhesus monkey ...55
6.7.2 Analysis of the air-conditioning efficiency ...57
6.8 Model’s accuracy and reliability ...60
VII. HUMAN vs. CHIMPANZEE: NASAL AIR CONDITIONING ...61
7.1 Numerical experiment ...61
7.2 Results ...62
7.3 Discussion ...66
VIII. CONCLUSION ...68
8.1 The anatomy of chimpanzee nasal cavity ...68
8.2 Airflow in chimpanzee nasal cavity...68
8.3 Air-conditioning in chimpanzee nasal cavity ...69
8.4 Future work ...70
REFERENCES ...71
APPENDICES
LIST OF PUBLICATIONS
vi
LIST OF TABLES
Table Page
Table 4.1 The Navier-Stokes equation of an incompressible fluid flow in Cartesian
coordinates ...33
Table 6.1 Subject, scans, and estimated parameters of respiration ...48
7
LIST OF FIGURES
Figure Page
Figure 3.1. (a) Computed tomography scans (slices). (b) Modern CT scanner ...20 Figure 3.2. CT vs MRI scans ...21 Figure 3.3. Three-dimensional surface generation methodology ...22 Figure 3.4. Slice samples of CT scans of the chimpanzee head: (a) Plan xy, (b) Plan yz,
(c) Plan xz ...23
Figure 3.5. Comparison between raw and processed data of a same CT scan: One sliced
image displaying a coronal cross section of the chimpanzee head (left);
Extraction of a sub-image showing the nasal passage topology (right).
Total number of CT scans was 401 slices. ...24 Figure 3.6. Reconstructed surface generated from extracted subset of CT scans ...25 Figure 3.7. Selection of block data that needs manual removal to outline the shapes of
nostrils and nasopharynx. ...27 Figure 3.8. Surface ready for volume mesh generation. ...28 Figure 3.9. Computer model of the chimpanzee nasal cavity: Face meshing of the
generated surface (A); Coronal cross-section of the computational volume mesh (B); Zoom showing unstructured tetrahedron cells (C). ...30 Figure 4.1. Flow process of a CFD analysis ...35 Figure 4.2. Flow chart of the segregated solver ...37 Figure 5.1. Computer model of chimpanzee nasal passages anatomy: (A) Top view,
(B) 3D view, (C) Front view, (D) Side view. The nasal cavity is sectioned by thin, curved, bony shelves termed nasal conchae (unseen). The meatuses are very narrow. The nasal topology is slightly asymmetric (Asymmetry between the right and left nasal cavities is a general aspect common at least for all mammals). ...38 Figure 5.2. Lateral view of the chimpanzee nasal airways. Three characteristic airways
regions are indicated as nasal vestibule, central nasal passages, and nasopharynx. Nine representative sections are shown in frontal view.
Features of interest include the nostrils surface (A), nasopalatine duct (B), anterior margin of the middle turbinate (C), inferior meatus on the ventral and lateral side of the inferior turbinate (D), posterior extent of the septal wall (E), and outlet (F). ...39 Figure 6.1. Boundary conditions for numerical simulation: the outward velocity at the
nasopharyngeal level was 1.4 m/s. Nares were considered as free inlets.
Nasal cavity lining had a non-slip boundary. T
o, K
memb, F
o, δ
memb, D
memb8
indicate the tissue layer’s temperature, thermal conductivity of the epithelial layer, tissue layer’s mass fraction of water, epithelial layer’s thickness, and mass diffusion coefficient of the epithelial layer, respectively.. ...46 Figure 6.2. Inspiratory flow structure and flow velocity of chimpanzee nasal passages:
The streamlines (A) and the contours planes (B) indicate the air streams direction and velocity distribution within the nasal airways, respectively.
The middle meatus passed the largest flow rate. The inferior meatus passed lesser flow rate. Smallest airflow rate was observed in the superior airways. Highest velocity was seen around the nasal valve region. ...49 Figure 6.3. 3D views of the temperature distribution inside the nasal passage (inhaled
air: Temperature = 25 ºC, relative humidity = 35%). The left panel (A-B- C) of contour planes are sagittal sections of the right side of the nasal cavity outbounding from the middle of the right nasal airways (top) to outward (down). The right panel (D-E-F) of contour plans are sagittal sections of the left nasal passage outbounding from the septal side (top) to the middle of the left nasal airways (down). ...52 Figure 6.4. Relative humidity distribution inside the nasal passages (inhaled air:
Temperature = 25 ºC, relative humidity = 35%). The contour plans are cross sections of the right nasal cavity (right panel, 2D views) outbounding from outward (top) to the middle of the right nasal airway (down), and left nasal cavity (left panel, 3D views) outbounding from septal side (top) to the middle of the left nasal airway (down). There is no relation between the locations of the sagittal sections in the right and left panels. The airflow relative humidity is higher near the nasal cavity lining. ...53 Figure 6.5. (A) Temperature distribution inside chimpanzee nasal cavity: Initial
temperature of the inspiratory air was less than the body temperature. The inhaled air got gradually warmer while approaching the nasopharyngeal region by absorbing heat from nasal tissue layer via the nasal epithelial layer. By reaching the nasopharynx, the air, initially inspired at 25 ºC, was heated to approximately the nasal tissue layer’s temperature, 34 ºC. (B) Relative humidity distribution inside chimpanzee nasal cavity: Initially inhaled air had a relative humidity equals 35%, whereas humidity in the nasal passage lining is 100%. The air got moistened by absorbing water from the nasal tissue layer via the nasal epithelial layer. The inhaled air got gradually humidified while approaching the nasopharyngeal region. By reaching the nasopharynx, the dry inspiratory air was moistened to almost the nasal tissue layer’s relative humidity, 100%. ...56 Figure 6.6 Temperature distributions inside chimpanzee nasal cavity: Temperature
distribution in the lower airway of the left nasal cavity (blue dots);
Temperature distribution in the middle airway of the left nasal cavity (orange crosses), and temperature distribution in the upper airway of the left nasal cavity (grey squares). . ...57 Figure 6.7 Humidity distributions inside chimpanzee nasal cavity: Humidity
distribution in the lower airway of the left nasal cavity (blue dots);
Humidity distribution in the middle airway of the left nasal cavity (orange
crosses), and humidity distribution in the upper airway of the left nasal
9
cavity (grey squares). . . ...58 Figure 7.1. Evaluation points of simulation: Kumahata, et al. (2010) determined the
temperature and relative humidity in a human computer nasal model; the values were taken at distances of 1.5, 2.5, 3.5, 5.5, and 6.5 cm from the nares. Same parameters were determined at equivalent points (axial direction) of the chimpanzee nasal anatomy ...62 Figure 7.2. Flow inside the chimpanzee nasal cavity of hot-humid (A) and cold-dry
(B) inspiratory air: Most air flowed in middle meatus, a lesser rate of air flowed in the inferior meatus. The least airflow was seen over the superior meatus ...63 Figure 7.3. 3D view of temperature distribution inside chimpanzee nasal cavity: Hot-
humid case (A), cold-dry case (B). Contour planes are coronal cross- sections of the entire nasal airways. The inhaled air was conditioned throughout the nasal lining, and almost adjusted to body temperature by reaching the nasopharynx region. ...64 Figure 7.4. 3D view of water mass fraction distribution inside chimpanzee nasal cavity:
Hot-humid case (A), cold-dry case (B). Contour planes are coronal cross- sections of the entire nasal airways. The inspiratory air was conditioned throughout the nasal lining, and almost adjusted to body water mass fraction by reaching the nasopharynx region. ...65 Figure 7.5 Temperature distributions within the nasal cavity: Human/Hot-wet case
(blue diamonds), Chimpanzee/Hot-wet case (red squares), Human/Cold- dry case (green triangles), and Chimpanzee/Cold-dry case (purple crosses). ...66 Figure 7.6 Distributions of water mass fraction within the nasal cavity: Human/Hot-
wet case (blue dots), Chimpanzee/Hot-wet case (red dots), Human/Cold-
dry case (green dots), and Chimpanzee/Cold-dry case (purple dots). . ...67
10
CHAPTER I
INTRODUCTION
1.1 Motivation
Chimpanzees are colloquially named chimps. Research by Minkel in 2006 found 94% of DNA commonality between human beings and chimpanzees (Minkel, 2006). Such close kinship between human and chimpanzee may provide exclusive understanding of human biology through chimpanzee’s studies (Tarjei, et al., 2005).
Decades ago, there were probably millions of chimpanzees living throughout tropical Africa.
Nowadays, chimpanzees are regarded as an endangered species, and their population is continuously declining.
Disease is considered among the major dangers threatening chimpanzees. The usage of chimpanzee in experimentation is rising (Tarijei, et al., 2005; Gagneux, et al., 2005), and the increased dealings with humans has carried the menace of ailments that could be minor in human being but fatal to chimpanzee (House, et al., 1966).
11
Usually, chimpanzee’s medical care presumes the identity of its physiology and pathology with human. Although humans and chimpanzees are biologically akin, they may be obviously different in their vulnerability to diseases (Gagneux, et al., 2005).
After one year observation study of chimpanzees, Kaur and coworkers (2008) stated that endangered chimps becoming sick from respiratory viral infectious diseases transmitted from research teams and eco-tourists (Kaur and Singh, 2008).
The respiratory tract is largely reported in chimpanzees’ disease. Many research works investigated respiratory system diseases related to primates in general (Lapin et al., 1963; Fiennes et al., 1972a;
Fiennes et al., 1972b; Martin, 1978; Wallach et al., 1983; Lowenstine, 2003). Table A.1 reviews the range of respiratory disease in chimpanzee.
Respiratory system structure is complicated. It meets multiple physiological tasks such as the contact between air and blood, which likely carries with it an exposure to damaging agents. An understanding of respiratory tract and reported respiratory problems in chimpanzee, as well as associated diagnostic approaches and pathology, may widely improve chimps’ clinical management.
The nose is the most superior organ of the breathing system. Its function comprises air exchange, air-conditioning, filtration, vocalization, and sense of smell (Hornung et al., 1981).
Our limited knowledge may restrain our concern about increasing medicine understanding and scientific challenges specific to endangered chimp. Familiarity with chimpanzee nasal topology, airflow patterns, and air-conditioning structures is a source of knowledge to understand chimp’s nasal physiology and pathology. This fact could potentially contribute in accumulating standardized biological information on healthy chimpanzees, and so increasing the ability to care for them. It would also support scientists interested in comparative biomedicine filed.
12
1.2 Objectives
This research work aimed to develop a CFD approach in order to present details about anatomy, airflow structures, and air-conditioning patterns in a chimpanzee nasal cavity. The focus may be categorized into three parts: (i) nasal anatomy (ii) analysis of airflow patterns of an inspiratory phase under physiological flow rate and (iii) visualization of air-conditioning distributions through the nasal airways.
The CFD approach aimed at:
Acquiring a detailed understanding of chimpanzee’s nasal airways topology. A computer nasal geometry was modeled from computed tomography (CT) scans.
Visualizing inhaled airflow patterns of chimpanzee nasal topology using computational fluid dynamics (CFD) approach.
Providing an overview of the air-conditioning distribution inside the nasal cavity of chimpanzee, and discussing the role of anatomical features of the nasal topology in heat and water transfer.
Comparing the nasal air-conditioning performance of chimpanzee and human.
The results of this study may confirm the changeability between nasal geometries of different species and determine how airflow patterns would dependently affected.
1.3 Methodology
The difficulties involved with experiments led into investigation of the nasal airflow field using computational fluid dynamics (CFD) approach. CFD enables comprehensive measurements of airflow parameters without any intervention risk for the subject. To begin the CFD process, a
13
geometrical model of the nasal cavity is initially required. This means either assuming a simplified geometry or obtaining medical scans (CT or MRI) in their electronic format so that they can be uploaded into a computer. The reconstruction and determination of the nasal geometry in this study was done by CT scans. The geometric model is then divided into smaller sections (cells) to create a mesh. The flow equations are then solved numerically for each and every cell to give information about the flow parameters within the entire nasal model.
This research work intended to build an accurate realistic chimpanzee nasal cavity from CT scans.
Modelling of the 3D geometry was accomplished using CAD (Computer-Aided Design) software.
Compared to cast models, biomedical scans are much more accurate in offering detailed data leading to realistic airways geometry. This research work attempted to find out how the airflow patterns, its velocity, and the air-conditioning distributions are structured inside the chimpanzee nasal cavity. The nasal airflow patterns and the air-conditioning distributions were generated using CFD approach.
1.4 Dissertation structure
The motivation to conduct this research work, the objective, and the outline of the dissertation are presented in Chapter one.
Chapter two reviews previous studies of nasal cavity in animals, three-dimensional nasal reconstruction, and computational studies of nasal airflow.
Third chapter reports the process to build the nasal topology. The computational model includes the stages of image processing (sub-image extractions from CT scans), surface generation, and volume mesh construction.
Fundamental concepts related to the mathematical and numerical methodologies for fluid flow are discussed in chapter four. The governing equations that are solved are described.
14
Chapter five explores the anatomical aspects of the chimpanzee nasal topology. These results were discussed and compared to available data of human and rhesus monkey nasal airways.
Chapter six analysis the airflow structure and air-conditioning distributions. Patterns thru different areas of the nasal topology counting the nasal valve and meatuses are described. The heat and water transfer capability of the chimpanzee nasal cavity is also discussed. The temperature and humidity distributions reflected the effect of the conchae and their role in conditioning the inspiratory.
Chapter seven focused on comparing air-conditioning efficiency inside the nasal cavities of human and chimpanzee. Specifically, hot-humid and cold-dry inhaled air cases were computed. The influence of the inhaled air parameters on the airflow patterns was highlighted.
Finally, we conclude this dissertation in chapter eight.
15
CHAPTER II
LITERATURE REVIEW
Because the complex geometry of the nasal cavity, in vivo experimentations of the nasal airflow is problematic. Previous experimental work on animals’ nasal cavities has been done on cat (Eccles et al., 1974), dog (Webber et al., 1987), pig (Eccles, 1978), rat (Bojsen-Moller et al., 1971), and ferret (Reo et al., 1992). Eccles et al., (1981) studied the autonomic innervation in animals’ nose (Eccles et al., 1981). Various studies investigated the morphometry of nasal airways for different Mammalia such as the beagle dog (Schreider et al., 1981), rat (Schreider et al., 1981; Gross et al., 1982; Patra et al., 1987; Kimbell et al., 1997), monkey (Schreider et al., 1981; Yeh et al., 1997;
Kepler et al., 1998; Harris et al., 2003), mouse (Gross et al., 1982), guinea pig (Schreider, 1983), and human (Yeh, et al., 1997; Menache, et al., 1997; Subramaniam, et al., 1998) using sections of nasal cavity casts, slices’ series from fixed tissue of the nasal cavity, or medical imaging scans (either CT or MRI).
One promising field is based on dynamics assessment using the nasal airflow. This has been brought to attention since the nasal physiological function is strongly dependent on the nasal airflow dynamics. Most research methods recorded nasal airflow indirectly such as using a passive airflow through the nose to determine pressure changes.
Experiments to visualize nasal airflow have been conducted for human (Paulsen, 1882; Proetz, 1951, 1953; Swift, et al., 1977; Hornung, et al., 1987; Simmen, et al., 1999), cat (Dawes, 1952),
16
dog (Dawes, 1952; Becker, et al., 1957), rabbit (Dawes, 1952; Corley, et al., 2009), baboon (Patra, et al., 1986), monkey (Morgan, et al., 1990, 1991), and rat (Morgan, et al., 1990, 1991). To visualize the airflow patterns of inhalation and exhalation phases, Dawes (1952) used the smoke associated with sagittal sections of dog nasal airways (Dawes, 1952). Other researches (Becker, et al., 1957) used aerosols and particles’ deposition to visualize nasal airflow patterns. Water-dye visualization techniques (Swift, et al., 1977; Morgan, et al., 1990, 1991) was the most encouraging at showing the airflow patterns inside the nasal cavity.
Experiments of nasal airflow quantitative measurements have been done for human (Hopkins, et al., 2000; Swift, et al., 1977; Hahn, et al., 1993; Kelley, et al., 2000) and baboon (Patra, et al., 1986).
Other researchers investigated the flow measurement using MRI technique (Elkins, et al., 2003;
Taylor, et al., 2004; Marshall, et al., 2004; Elkins, et al., 2007; Vennemann, et al., 2007; Bonn, et al., 2008).
Investigations of main primate taxa (Wen, 1930; Schultz, 1935) contributed to the knowledge of nose structure in primates. The comparative study of the nasal cartilages in primates by Wen (Wen, 1930) has shown the importance of these structures for the configuration of the outer nose which differ among the group of primates. Later on, Hofer (Hofer, 1976) focused on the external nasal structure.
Most early studies of primates’ nasal structure were carried out on fetal stages using serial sections, which cartilages normally disappear at various postnatal stages. As per older animals which cannot be dissected, their gross nasal anatomy are still unknown.
Albeit the research efforts, the dynamics of the nasal airflow in animals is still considered a new topic in the scale of scientific research. There are still many uncertainties even in some of the most basic flow principles, such as the nature and the main path of the nasal airflow as visualization and measurement of nasal airflow remain challenging due to the geometrical complexity and the
17
reduced nasal airways size, so accuracy of experimental data remains limited. On the other hand, discrepancies in the nasal airflow fields when investigated by CFD techniques may arise due to different numerical methods and flow assumptions.
Due to software and hardware development and their recent availability, CFD approach is currently used to study living organs including the nasal cavity. Over few decades, investigators relied on geometrically simplified models for their CFD computations. They designed their models with the aid of graphics software by using data from literature (Weibel, 1963) to estimate the dimensions of their models (geometrical shape, perimeter, cross-sectional area, etc.). Nowadays, with the advancement in biomedical imaging field and computer technological development, researchers became able to develop more geometrically realistic models.
Biomedical imaging such as CT and MRI scans together with 3-dimensional (3D) modelling software endorsed the reconstruction of computer models of the nasal cavity for analysis. By generating different nasal computational models, CFD simulations of inhalation (Minard, et al., 2006; Timchalk, et al., 2001; Kimbell, et al., 1993, 2001; Kepler, et al., 1998; Subramaniam, et al., 1998; Kimbell, et al., 1997), respiration (Lindemann, et al., 2004), and sense of smell (Keyhani, et al., 1995, 1997) have been done. Reconstruction of airways geometry may be done with accuracy comparing to cast models or even cadavers examination. Other researchers used the reconstructed models to create their experimental biological models of intricate geometry with more details (Stitzel, et al., 2003; Hopkins, et al., 2000).
Using CFD technology, various research works reported nasal airflow patterns of human, monkey, and rat in studies of inspiration toxicology (Minard, et al., 2006; Kimbell, et al., 1993, 1997, 2001;
Subramaniam, et al., 1998; Kepler, et al., 1998), olfaction (Tang, et al., 2007; Zhao, et al., 2004, 2006; Keyhani, et al., 1995, 1997), and air-conditioning (Nishimura et al., 2016; Mori, et al., 2015;
Hanida, et al., 2013; Kumahata, et al., 2010; Lindemann, et al., 2004, 2006; Pless, et al., 2004).
18
CHAPTER III
MODELLING OF CHIMPANZEE NASAL GEOMETRY
3.1 Medical image processes
The nasal cavity has a complex geometry which makes the use of Computer Aided Drafting (CAD) unpractical to design its computer model. Recently, the growing concern toward biomedical research field and technology advancement have lead up to develop software useful for creating 3D models from medical images. Modern modalities offer digital data more compatible for three- dimensional reconstruction and computational analysis (Timchalk et al., 2001; Minard et al., 2006) than anatomic sketch provided by early sectioning techniques (Kimbell et al., 1993, 1997, 2001).
To develop a computer model of a nasal passage, someone needs first to acquire the anatomical data of the test subject. Medical imaging data provide voxels (volume elements) of different structures associated with their tissues, that can be distinguished based on threshold of greyscale or brightness. Currently favored medical imaging techniques include CT and MRI.
3.1.1 Computed tomography (CT)
Developed by Sir Godfrey in 1972 (Richmond, 2004). Computed Tomography (CT) is a medical imaging medium that assists doctors in diagnosing pathology by allowing the scan of multiple cross-sections of internal organs and structures of subjects in order to view them. Dissimilar tissues in patient’s body possess various X-ray absorption and transmissivity levels. CT machine measures
19
radiation beams by applying an instrument of great sensitivity, and thus obtains measurement data able to be inputted and processed into a computer.
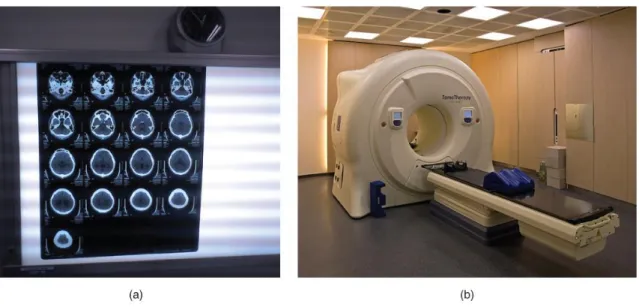
CT scanning consists of X-ray beams of radiation that focuses onto a subject in order to define its structure and internal shape by generating cross-sectional images. X-rays released by a CT machine scan a definite level of thickness of subject’s internal organ and are then detected by a probe. The photoelectric data are converted into electrical signals, and then, through a digital converter, are converted into numbers which may be input to the computer (Figure 3.1). The scanned data undertake a calculation into the computer to get each individual information of X-rays attenuation and/or absorption coefficients and arrange them into a digital matrix. CT is largely used in medical settings due to its diagnostic worth and relatively low-priced apparatus. However, CT scanning exposes subjects to relatively high ionizing radiation levels and has qualitative diagnosis limitations compared to other imaging mediums.
Figure 3.1. (a) Computed tomography scans (sliced images). (b) Modern CT scanner.
(https://upload.wikimedia.org/wikipedia/commons/3/35/113abcd_Medical_Imaging_Techniques.jpg)
20
3.1.2 Comparison between CT and MRI
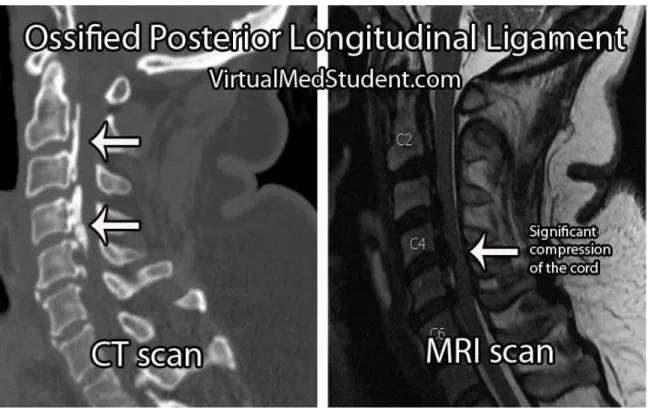
Both CT and MRI images provide 3D volumetric data sets. Additionally, CT scanning generates voxel greyscale values’ matrix into which the voxel tissue’s of CT number to be arranged. As dissimilar tissues present dissimilar characteristics of attenuation and/or absorption, subsequent sliced image differentiates dissimilar tissues by greyscale. This permits a good detection of bone structures. This fact offers CT an advantage over MRI. In regard to the nasal airways, MRI differentiates well structures of mucosa, though the location of turbinate cartilage should be deduced from its mucosal neighboring, because bone actual structures can be invisible. During their comparative study of MRI to CT scans done on paranasal sinuses and nasal cavities of mesaticephalic dogs, De Rycke and co-workers (2003) noticed the efficiency of MRI over CT scans in soft-tissue structure resolution (De Rycke, et al., 2003). Zinreich and co-workers (1988) reported that MRI method is less effective in modeling nasal airways geometry (Zinreich et al. 1988). In this research work both methods can provide the necessary data since our focus is only on the structure of bone without need for high-resolution of the soft tissue.
Figure 3.2 provides a comparison example of MRI to CT scans.
21
3.2 Computer modelling of the chimpanzee nasal passage
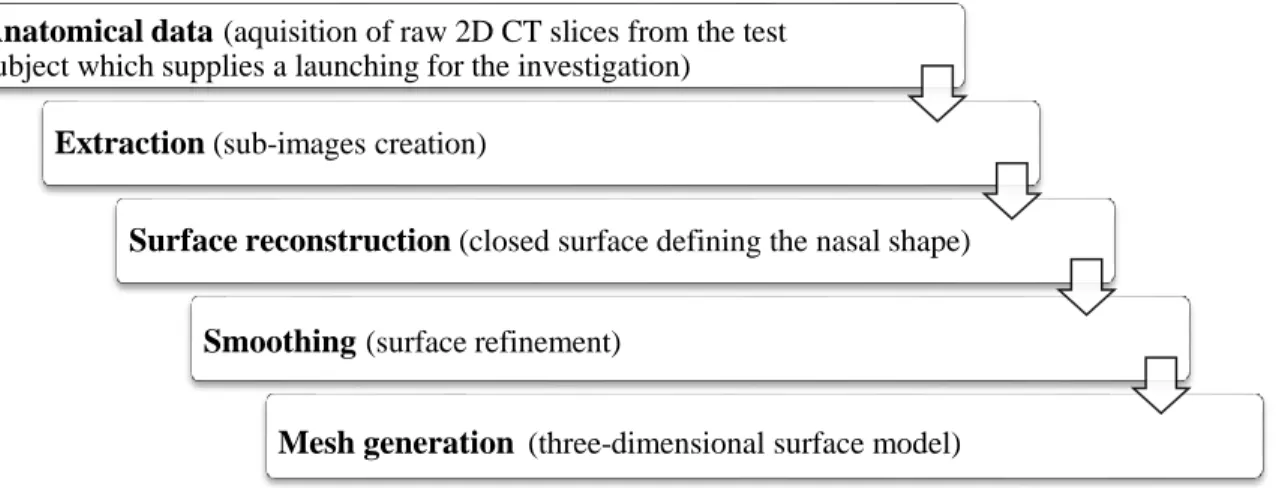
Prior to the creation of a CFD model, chain of procedures associated with the design and development of the model should be achieved. The process of making a computer model may be done thru five steps: (i) Acquisition of anatomical data; (ii) extraction; (iii) reconstruction of a closed surface; (iv) surface smoothing; (v) and generation of volume mesh. Figure 3.3 illustrates the process from converting the raw CT anatomical data till the generation of three-dimensional mesh.
Figure 3.2 CT vs MRI scans
(http://www.virtualmedstudent.com/images/ossified_posterior_longitudinal_ligament_MRI_and_CT.jpg)
22
3.2.1 Anatomical data
The CT scanning used in this study consisted of 401 slices, spanned from mouth tip to just anterior to larynx, of the head of an adult female chimpanzee (estimated age: 35-year-old; weight: 44.1 kg), Pan troglodytes reared at the Primate Research Institute, Kyoto University (KUPRI), Inuyama, Japan (Matsuzawa, et al., 2006). Each slice was composed of 512 x 512 pixels in the DICOM format. Scans resolution was 0.351 mm/pixel and scans pitch was 0.5 mm/slice. The scans were performed in three different axial positions. The CT scans are available on the digital morphology museum (DMM) database (http://dmm.pri.kyoto-u.ac.jp), of the Primate Research Institute, Kyoto University, Inuyama, Japan (CT scans id: PRICT #467 and 468).
Anatomical data(aquisition of raw 2D CT slices from the test subject which supplies a launching for the investigation)
Extraction (sub-images creation)
Surface reconstruction (closed surface defining the nasal shape)
Smoothing(surface refinement)
Mesh generation (three-dimensional surface model)
Figure 3.3 Three-dimensional surface generation methodology
23
3.2.2 Extraction: Sub-image creation
CT scans data consisted of serial coronal sections containing a threshold of greyscale to distinguish different bony structures (Figure A.2). Avizo (Visualization Science Group) software for visualizing CT scans, is an interface between scanned data, STL file format, and CFD analysis.
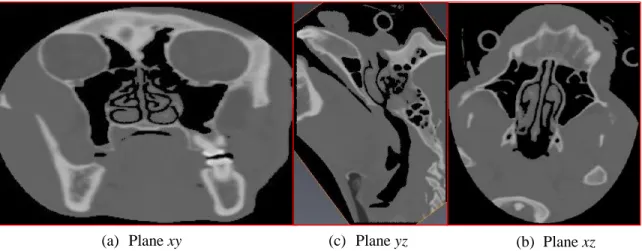
Anatomical data consisted of cross sections of the chimp’s head spanned from the mouth tip to just anterior of the larynx. Considering constraints of resources and time, we limited our interest to the nasal cavity only. The black area represents the airways, was extracted (Figure A.3) based on brightness’ threshold using Avizo 7 software (Figure 3.5). This extraction leads to a sub-image creation necessary for (a) reducing the computational cost and (b) removing the noise (undesirable regions) out the airways. Figure 3.5 displays a raw CT scan with its corresponding extracted sub- image.
(a) Plane xy
Figure 3.4 Slice samples of CT scans of the chimpanzee head: (a) Plane xy, (b) Plane yz, (c) Plane xz.
(b) Plane xz (c) Plane yz
24
3.2.3 Surface reconstruction
To generate a 3D surface following the sub-images creation, the extracted subset of CT scans was exported and the voxel data was converted to STereo Lithography (STL) file format into Avizo.
The obtained data of the STL file were read into the computer program and a surface was generated through image reconstruction saved in STL format. The file (Figure 3.6) will then be exported to a suitable software for smoothing.
Figure 3.5 Comparison between raw and processed data of a same CT scan: One sliced image displaying a coronal cross section of the chimpanzee head (left); Extraction of a sub-image showing the nasal passage topology (right). Total number of CT scans was 401 slices.
25
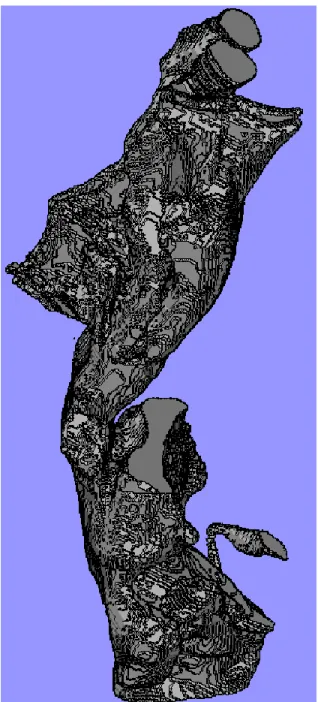
Figure 3.6: Reconstructed surface generated from the extracted subset of CT scans.
26
3.2.4 Smoothing
The nasal airways model of the generated surface should exhibit some irregularities. To avoid distortion in the flow filed values, the reconstructed surface (Figure 3.8a) was refined by performing global and local smoothing in order to remove warping and alleviate the in-built discontinuities generated by the numerous slices and resulting discrepancies. We used Magics 9.5 software (Materialize Inc., Leuven, Belgium) to modify the above data into a smooth surface (Figure 3.8b). The smoothing used in this research work consisted of shifting the vertices of triangulated surfaces in a manner to become more refined. The number of global smoothing is decided by the user. To optimize between keeping the initial geometry and eliminating irregularities, the global smoothing was applied only twice. Local smoothing is a manual process which is a repetitive and time consuming exercise. Several different-sized/shaped holes may appear randomly which necessitates individual manual removal by editing each nearby area while identifying local odd shaped triangles to delete them in order to smoothen the global surface. Holes can be filled using either curvature filling or flat filling techniques. Because of the complexity and highly curved shape of the nasal geometry, curvature filling was perfectly suited since it blended the hole to fit the adjacent area. The flat filling was adequate in case of very small holes. The smoothing was applied in the 3-axial directions. At first, necessary local smoothing on each single irregularity throughout the whole external surface was performed. Then, a manual smoothing in the internal side of the closed airways surface was done to remove unrelated sub-regions, recognized by their shape singularities relative to the whole topology. To ensure maintaining the fundamental geometry as accurate and reliable as possible, amendment of the surface have to be kept to a least possible.
The refined surface was then exported from Magics and opened in Avizo (Figure 3.8b). This transfer into Avizo was required in order to specify the locations of nostrils and nasopharynx. This block data need a manual removal to outline nostrils and nasopharyngeal regions (Figure 3.7).
27
Neighboring the main model, minor isolated data points may exist. This undesirable ‘noise’ needed to be manually removed since they were not parts of the actual geometry. The deletion of unwanted data made the working process more efficient by optimizing computational resources such as overall speed, memory, and power. The file (Figure 3.8c) is then exported to the suitable CFD software in order to define the domain of airflow and generate the volume mesh.
Figure 3.7 Selection of block data that needs manual removal to outline the shapes of nostrils and nasopharynx.
Nasopharynx Nostrils
28
3.3 Development of the CFD model
The creation of the mesh is a major operation in achieving accurate computational results during CFD simulations. In this research work, we used GAMBIT (ANSYS) software for mesh generation.
The reconstructed surface was exported from Avizo as STL format file, to be imported into GAMBIT which detected the generated surfaces as faces.
The advantages of a structured mesh are the reduced memory needed for computation and better convergence solution, however impractical in case of complex geometry such as the nasal cavity.
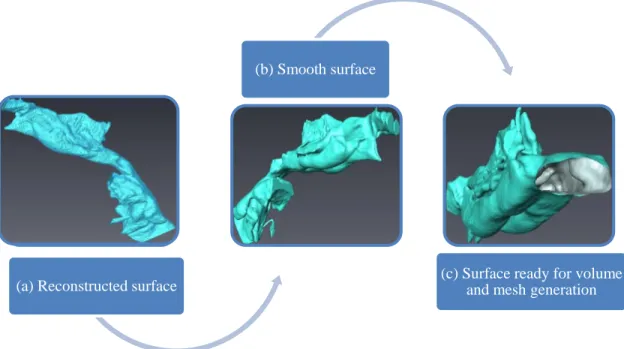
An unstructured grid has the advantage for complicated shapes of using tetrahedron cells that may be clustered under control in the flow domain where it is needed. Whereas structured mesh forcibly places hexahedron elements in regions where they are not wanted. The unstructured grid might suit complex topologies, requiring considerably more computational resources, as neighboring nodes to each individual node increase. Yet, tetrahedron cells can never be aligned to the direction of the flow. This problem may impede convergence. Increasing mesh resolution and choosing (a) Reconstructed surface
(b) Smooth surface
(c) Surface ready for volume and mesh generation
Figure 3.8 Surface ready for volume mesh generation.
29
discretization schemes of higher order are techniques that minimize the possibility of numerical diffusion.
3.3.1 CFD model
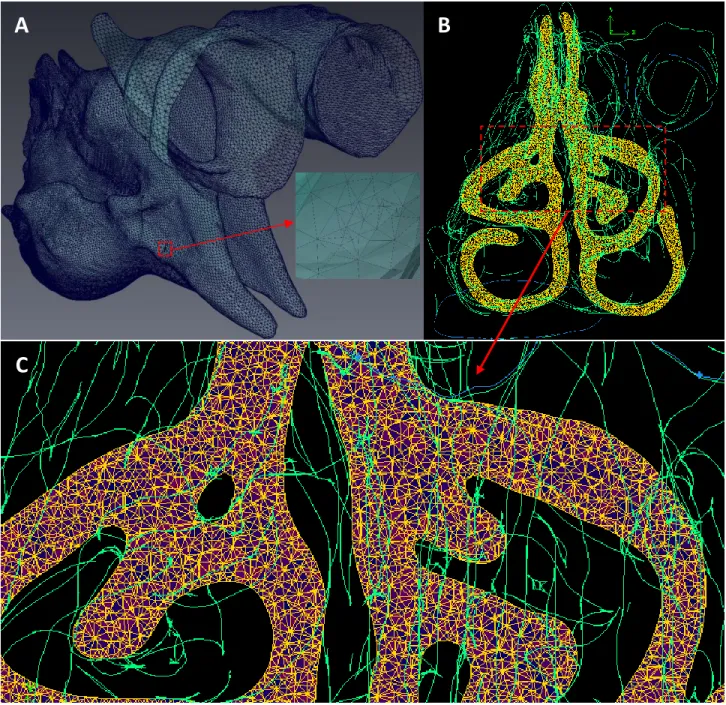
The smoothed data was imported into Gambit 2.4 (ANSYS Inc., Canonsburg, PA, USA) under STL format. The reconstructed surface was detected as faces. The meshing approach started with setting basics for the face mesh and then generating volume cells founded on the face mesh (Figure 3.9).
For the complex geometry of the chimpanzee nasal cavity, an unstructured tetrahedron grdid for CFD analysis was generated with a grid step of 0.3. The mesh contained about 3.7 x 10⁶ tetrahedron cells, 7.6 x 10⁶ triangles, and 7.4 x 10⁵ non duplicated nodes. Its surface area and total volume were 185.41 cm2 and 41.64 cm3, respectively.
30
A B
C
Figure 3.9 Computer model of the chimpanzee nasal cavity: Face meshing of the generated surface (A); Coronal cross-section of the computational volume mesh (B); Zoom showing unstructured tetrahedron cells (C).
31
CHAPTER IV
NUMERICAL METHOD
4.1 Introduction
Chapter four is about the used mathematical equations for numerical simulations. The laminar state model was used to simulate an inhalation case at rest physiological rate. The details of setting the boundary conditions are not discussed in this chapter. They are instead described in chapter 6.
4.2 Fluid flow general governing equations
Computational fluid dynamics basically use the general Navier-Stokes equation that governs the flow and heat transfer within a fluid domain. General Navier-Stokes equation includes an equation of continuity, three equations of momentum, and an equation of energy.
Airflow inside the nasal cavity is regarded as a continuum. Its behavior can be described using its properties for example density, velocity, and their derivative with respect to time. Moreover, it is considered as incompressible fluid.
Defining a fluid property as φ, the governing equations of incompressible fluid flow might be represented by the equation of transport (Eq. 4.1) under its generic form:
32
𝜕∅
𝜕𝑡⏟
𝑙𝑜𝑐𝑎𝑙 𝑎𝑐𝑐𝑒𝑙𝑒𝑟𝑎𝑡𝑖𝑜𝑛
+𝜕(𝑢∅)
𝜕𝑥 +𝜕(𝑣∅)
𝜕𝑦 +𝜕(𝑤∅)
⏟ 𝜕𝑧 𝑎𝑑𝑣𝑒𝑐𝑡𝑖𝑜𝑛
= 𝜕
𝜕𝑥[Γ𝜕∅
𝜕𝑥] + 𝜕
𝜕𝑦[Γ𝜕∅
𝜕𝑦] + 𝜕
𝜕𝑧[Γ𝜕∅
𝜕𝑧]
⏟
𝑑𝑖𝑓𝑓𝑢𝑠𝑖𝑜𝑛
+ 𝑆⏟∅
𝑠𝑜𝑢𝑟𝑐𝑒 𝑡𝑒𝑟𝑚
(4.1)
t denotes time; u, v and w denote the components of velocity, Γ denotes diffusion coefficient, and Sφ represents a source term.
Equation 4.1 is the start-up of finite difference and finite volume methods. By affecting the values of 1, u, v, w and T, to φ, and setting appropriately the diffusion coefficient Γ and the source term Sφ, we get the partial differential equations of mass conservation, momentum conservation, and energy as presented in the following table.
33
Table 4.1 The Navier-Stokes equation of an incompressible fluid flow
4.3 Numerical solver procedure
A CFD solution process includes three phases: (i) pre-processor, (ii) solver, and (iii) post- processing.
The pre-processor phase consists of defining the geometry to be analyzed, the domain of computation, and the properties of fluid. At this step, the type of analysis should be decided as steady, transient, or unsteady flow, and whether its state is laminar or turbulent. The fluid flow
Mass conservation
𝝏𝒖
𝝏𝒙+𝝏𝒗
𝝏𝒚+𝝏𝒘
𝝏𝒛 = 𝟎 (4.2)
Momentum conservation
𝝏𝒖
𝝏𝒕+𝝏(𝒖𝒖)
𝝏𝒙 +𝝏(𝒖𝒖)
𝝏𝒙 +𝝏(𝒖𝒖)
𝝏𝒙 = −𝟏 𝝆
𝝏𝒑
𝝏𝒙+ 𝝏
𝝏𝒙[𝝂𝝏𝒖
𝝏𝒙] + 𝝏
𝝏𝒙[𝝂𝝏𝒖
𝝏𝒙] + 𝝏
𝝏𝒙[𝝂𝝏𝒖
𝝏𝒙] + 𝑺𝒖
𝝏𝒗
𝝏𝒕+𝝏(𝒖𝒗)
𝝏𝒙 +𝝏(𝒗𝒗)
𝝏𝒚 +𝝏(𝒘𝒗)
𝝏𝒛 = −𝟏 𝝆
𝝏𝒑
𝝏𝒚+ 𝝏
𝝏𝒙[𝝂𝝏𝒗
𝝏𝒙] + 𝝏
𝝏𝒚[𝝂𝝏𝒗
𝝏𝒚] + 𝝏
𝝏𝒛[𝝂𝝏𝒗
𝝏𝒛] + 𝑺𝒗
𝝏𝒘
𝝏𝒕 +𝝏(𝒖𝒘)
𝝏𝒙 +𝝏(𝒗𝒘)
𝝏𝒚 +𝝏(𝒘𝒘)
𝝏𝒛 = −𝟏 𝝆
𝝏𝒑
𝝏𝒛+ 𝝏
𝝏𝒙[𝝂𝝏𝒘
𝝏𝒙] + 𝝏
𝝏𝒚[𝝂𝝏𝒘
𝝏𝒚] + 𝝏
𝝏𝒛[𝝂𝝏𝒘
𝝏𝒛] + 𝑺𝒘
(4.3)
(4.4)
(4.5)
Energy equation
𝝏𝑻
𝝏𝒕+𝝏(𝒖𝑻)
𝝏𝒙 +𝝏(𝒗𝑻)
𝝏𝒚 +𝝏(𝒘𝑻)
𝝏𝒛 = 𝝏
𝝏𝒙[(𝝂 𝑷𝒓)𝝏𝑻
𝝏𝒙] + 𝝏
𝝏𝒚[(𝝂 𝑷𝒓)𝝏𝑻
𝝏𝒚] + 𝝏
𝝏𝒛[(𝝂 𝑷𝒓)𝝏𝑻
𝝏𝒛] + 𝑺𝑻 (4.6)
34
behavior is important for defining the appropriate boundary conditions of the flow domain. The chosen settings need to imitate the real behavior of the fluid.
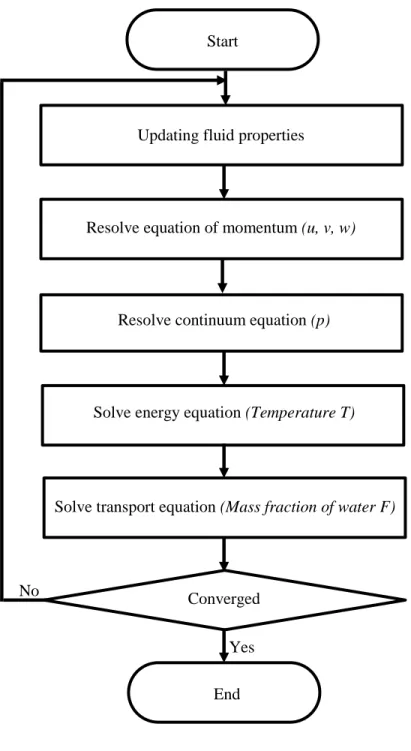
The second phase of a CFD simulation is the settings of the numerical method. The determination of an adequate computational technique for the solution leads to reliable results. These techniques include discretization scheme, pressure-velocity coupling scheme, and convergence criteria. We choose FLUENT segregated solver to solve Navier-Stokes equations. Figure 4.1 shows solver’s flow chart.
Last stage is the Post-processing, which consists of converting raw data into significant outcomes.
CFD offers the possibility to produce precise detailed data and colorful illustrations including streamline, contour, and vector plots.
35 Yes
Solve energy equation (Temperature T) Start
End
Updating fluid properties
Resolve equation of momentum (u, v, w)
Resolve continuum equation (p)
Converged
End
Solve transport equation (Mass fraction of water F)
No
Figure 4.1 Flow chart of the segregated solver
36
4.4 Fluid flow discretization
There are few different discretization schemes of a fluid flow that may be classified according to the accuracy they may offer. The minimum accurate one is the first order scheme, subsequently subject to producing unreliable outcomes. Second order upwind scheme reduces some of the faults generated in first order scheme. Influence of the grid refinement is further significant with a first order scheme than a second order scheme. The third order (QUICK) scheme offers accuracy for greater choice of flows in comparison to the first order and Upwind schemes.
For incompressible flows, an iterative method for pressure-velocity coupling named SIMPLE scheme (Patankar, 1980) is widely used and may be found in almost all CFD codes.
We used the QUICK scheme (Leonard, et al., 1990) to solve the Navier-Stokes equation where the SIMPLE algorithm (Vandoormaal, et al., 1984) was employed for the calculation of the pressure and velocity.
37
CHAPTER V
NASAL ANATOMY OF CHIMPANZEE
5.1 Chimpanzee nasal topology
The images taken by CT scanning are reconstructed and derived to form a three-dimensional geometry for simulating nasal airflow in the later stage. Several types of software have been involved. The following results represent the most detailed anatomic data of a chimpanzee nasal passages. Indeed, accurate experimental determination of nasal airways details is generally problematic because of the narrow dimensions of the nasal passages and the disruptive effect of manipulation tools.
Studying a range of chimpanzee specimens at this level of detail is not presently practical and is well beyond our present scope. Instead, details of some anatomic regions within a typical chimpanzee nasal topology are given. Following the results presented here, a discussion and comparison of available data from human and limited data from the rhesus monkey (Kepler, et al., 1998; Morgan, et al., 1991), with our computer model of chimpanzee nasal topology is given in the subsequent section.
38
The nasal passages of the chimpanzee consisted of two airways (Fig. 5.1-A) separated by a narrow septum, which was roughly planar. The septum extended through the central nasal passages from the end of the nasal vestibule till the anterior of the nasopharynx. In the nasopharynx/pharynx region, the airways continued straight horizontally without bending (Fig. 5.1-D). The chimpanzee has downward-projecting forward-facing nostrils. Air enters through the circular shaped nostril openings (Fig. 5.1-C), the surfaces of which begin at the forward tip of the nose.
The nasal airways are bounded by the septum on the medial side, the dorsal wall above, the ventral floor below, and the lateral wall on the outside. There were three geometrically distinct regions of the nasal airways: nasal vestibule, central nasal passages, and nasopharynx (Fig. 5.2), each of which exhibits characteristic flow patterns.
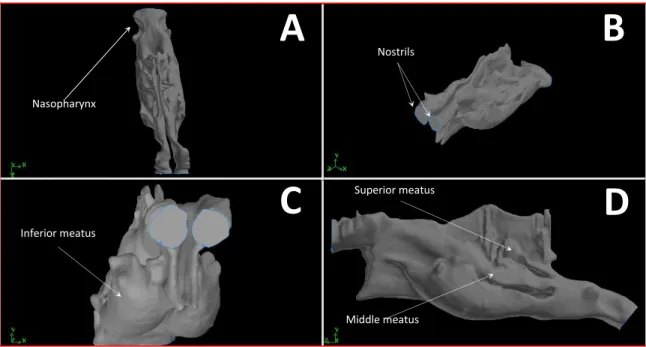
Figure 5.1 Model of nasal passages anatomy: (A) Top view, (B) 3D view, (C) Front view, (D) Side view. The anatomy was reconstructed from 401 head CT slices of a healthy 35-year-old female chimpanzee weighing 44.1 Kg. The nasal cavity is sectioned by thin, curved, bony shelves termed nasal conchae (unseen). The airways inferior and lateral to the conchae are referred to as meatuses. Each meatus is named for the concha that lies above it e.g., superior concha, superior meatus. The meatuses are very narrow. The nasal topology is slightly asymmetric (Asymmetry between the right and left nasal cavities is a general aspect common at least for all mammals).
A
NostrilsNasopharynx
D
Superior meatus
Middle meatus
C
B
Inferior meatus
39
5.1.1 Nasal vestibule
We define the nasal vestibule as the region which extended from the frontier of the nostrils to the beginning of the middle turbinate (Kepler, et al., 1998). Starting at the anterior margin of the nose, airways cross sections were small and roughly circular in shape (Fig. 5.2, section a). Moving posteriorly, the shapes of the cross sections became more elongated (Fig. 5.2, section b). The protrusion of the anterior portion of the inferior turbinate into this airways created curved lateral walls thus the appearance of a curved channel designated the inferior meatus (Fig. 5.2, section c).
The inferior turbinate is the largest (House, et al., 1966), spanning nearly the entire length of the c
e
f d
b g
h
i a
F E
D C
A
B Nasopharynx
Central nasal passages Nasal
vestibule
Figure 5.2 Lateral view of the chimpanzee nasal airways. Nine representative sections are also shown in frontal view. Sections are labeled (a-i) and will be referred to in the text. Features of interest include the nostrils surface (A), nasopalatine duct (B), anterior margin of the middle turbinate (C), inferior meatus on the ventral and lateral side of the inferior turbinate (D), posterior extent of the septal wall (E), and outlet (F). Three characteristic airways regions are also indicated as nasal vestibule, central nasal passages, and nasopharynx.
40
main nasal passage. Progressing toward the central nasal passages, cross sections narrowed, elongated, and became more complex (Fig. 5.2, section d). The protrusion of the middle and superior turbinates into the nasal airways created curved lateral walls.
5.1.2 Central nasal passages
The central nasal passages started with the anterior margin of the middle turbinate and extend posteriorly for the full extent of the inferior, middle, and superior turbinates. The middle turbinate was almost as large as the inferior turbinate while the superior turbinate was much smaller, only about half the length of the middle turbinate, and was in the posterior part of the main nasal passages.
This region of the airways was characterized by long and narrow cross sections. These channel- like airways (Fig. 5.2, section d) were created by the protrusion of the inferior and middle turbinates into the nasal passages. The turbinates protruded into the nasal passages with the airways curling around them ventrally and laterally in a manner that gave the airways’ cross sections a more complex shape (Fig. 5.2, section e). Due to the presence of the turbinates, the cross-sectional perimeter increased (Fig. 5.2, sections d-f). At the posterior end of the main nasal passage, the turbinates and the septum at the same point end and the two cavities merged into one (Fig. 5.2, note E). This region marked the choanae which is the beginning of the nasopharaynx. The cross section area of the airways at this point was inclusive of the two sides of the nose (Fig. 5.2, section g).
5.1.3 Nasopharynx
The portion of the airways designated as nasopharynx contains a small portion of the posterior nasal passages in addition to the true nasopharynx (Kepler, et al., 1998). The central nasal passages ended and the nasopharynx region began at the point where the dorsal wall drop abruptly (Fig. 5.2, note E). The two halves of the nasal cavity joined at the point where the septum ended (Fig. 5.2, section
41
g). In this region, the cross-sections more roughly resembled sections of an ellipse-shaped tube (Fig.
3, sections g-i).
5.2 Discussion
The nasal passage of chimpanzee is long and triangular as seen from a side view, and its nasal vestibule is horizontal and vertically connected to the middle of the nasal passage (Losken, et al., 1994).
A comparison of the results in the chimpanzee computer model to results from experimental and/or computer models of human and rhesus monkey nasal airways is important because of the anatomical similarities between all three species.
The nasal cavity within the facial cranium of chimpanzee and rhesus monkey was triangular-shaped in the lateral view (Losken, et al., 1994). This pattern contrasts with that found in human, who possessed a quadrangular-shaped nasal cavity (Losken, et al., 1994). Results presented by Losken et al., (1994) in its comparative study of nasal cavity patterns in chimpanzee, rhesus monkey and human showed a longest and highest nasal cavity in chimpanzee. House, et al., (1966) reported that the area between the superior nasal concha and the roof is larger in chimpanzee than in human.
Human nasal cavity is longer and taller than that in rhesus monkey (Losken et al., 1994).
Our observation of three distinct regions in the chimpanzee nasal airways corresponds to observations of Schreck, et al., (1993) done on 3x plastic replica of human nasal airways, and Kepler, et al., (1998) done on a right nasal airway computer model of rhesus monkey. In their analysis of flow fields in human and rhesus monkey airways, they also partitioned the airways into three compartments which are equivalent to the nasal vestibule, central nasal passages, and nasopharynx of the chimpanzee.
42
Cross-sectional areas in the nasal vestibule of the chimpanzee and human (Schreck, et al., 1993) nasal airways decreased up to the point of the nasal valve and then increased, whereas cross- sectional areas in the nasal vestibule of the rhesus monkey increased monotonically (Kpeler, et al., 1998; Morgan, et al., 1991).
The nostrils in chimpanzee were horizontal (Nishimura, et al., 2016). However human nostrils were vertically oriented (Kumahata, et al., 2010; Hanida, et al., 1013) and rhesus monkey exhibited expanding nostrils (Morgan, et al., 1991; Kepler, et al., 1998). The horizontal nostrils in chimpanzee were connected vertically with the middle of the nasal cavity (Nishimura, et al., 2016) whereas the human ascending nostrils were connected close to the floor of the nasal cavity (Losken, et al., 1994).
A nasopalatine duct was found in chimpanzee (Smith, et al., 2001; Nishimura, et al., 2016) and rhesus monkey (Morgan, et al., 1991; Kepler, et al., 1998) nasal topologies. This feature wasn’t observed in human nasal cavity studies.
In the nasopharynx/pharynx, the airways made a 90º bend toward the larynx in human (Kumahata, et al., 2010; Hanida, et al., 2013) and rhesus monkey (Kepler, et al., 1998). This feature was not seen in chimpanzee where the airways remained horizontal in nasopharynx/pharynx region without bending.
Kepler, et al., (1998) and Morgan, et al., (1991) found that the ventral floor of the nasal vestibule in rhesus monkey made approximately a 45º angle with the ventral floor of the central nasal passages. This feature wasn’t reported in human and chimpanzee nasal airways. We attribute this characteristic to the monotonically expanding nasal vestibule found in rhesus monkey.
43
CHAPTER VI
NASAL AIRFLOW AND AIR-CONDITIONING IN CHIMPANZEE
6.1 Introduction
CFD method was implemented to mimic the airflow pattern and the temperature, humidity, and water distributions inside chimpanzee nasal cavity model derived from CT scans. The technique of CFD is fully developed and commonly applied in fluid studies of human and animals, including the simulation of the body heat, the blood flows in arteries and the airflow in respiratory tract (Oldham et al., 2000; Saber et al., 2003; Moore et al., 2005; Xu et al., 2006). The accuracy and the reliability of the simulation results generated by the CFD method are high. An increasing amount of experiments now rely on the simulation results of CFD to save time and resources required in performing in vivo experiments. The application of CT scans and CFD method provides a non- invasive alternative with great flexibility and capability of computational approach in measuring physical quantities inside the nasal cavity and simulating nasal airflow patterns.
44
6.2 Computational flow model
With the aid of FLUENT (ANSYS Inc., Canonsburg, PA, USA), we simulated a laminar steady airflow state. We investigated the airflow within chimpanzee nasal passages during an inhalation stage. A steady laminar state is logic for a normal breathing frequency corresponding to a flow rate at resting phase. Turbulence doesn’t interfere in the current study because critical Reynolds number cannot be reached by the airflow inside the nasal cavity as we are treating a rest breathing case.
Assumption of incompressible flow is allowed at normal physiological flow rates (Vogel, 1994).
The physiological model used here is based on incompressible, viscid, laminar air flow model considering heat and water transfer, developed by Kumahata, et al. (2010) (Kumahata, et al., 2010).
We adapted it to reflect chimpanzee respiratory physiology.
The governing equations include the equation of momentum conservation (1), the equation of mass conservation (2), the energy transport equation (3), and the water mass fraction transport equation (4).
𝝆{𝛛𝒖 𝛛𝒕⁄ + (𝒖 ∙ 𝜵)𝒖} = −𝜵𝒑 + 𝝁𝜵𝟐𝒖 (1)
𝜵 ∙ 𝒖 = 𝟎 (2)
𝝆𝑪𝒑{𝛛𝑻 𝛛𝒕 + (𝒖 ∙ 𝜵)⁄ 𝑻} = 𝑲𝜵𝟐𝑻 (3)
𝛛𝑭 𝛛𝒕⁄ + (𝒖 ∙ 𝜵)𝑭 = 𝑫𝜵𝟐𝑭 (4)
where ρ, u, t, p, μ, Cp, T, K, D, and F indicate density, velocity, time, pressure, dynamic viscosity, specific heat, temperature, thermal conductivity, coefficient of mass diffusion, and mass fraction of water, respectively. We resolved the above system of equations with the aid of the software FLUENT (ANSYS Inc., Canonsburg, PA, USA) using the finite volume scheme.
45
6.3 Boundary conditions
Nares were considered free inlets. Thermal conductivity was set to 0.0454 W/mK and the coefficient of mass diffusion of the inspiratory air was set to 2.88 x 10⁻⁵ m2/s. The nasopharynx velocity boundary equals the outward flow velocity. During an inspiratory phase under a steady state, the time-averaged velocity was set to 1.4 m/s. This value was determined with a nasopharyngeal cross-section’s area of 1.62 cm2, a breathing rate of 18 respiratory/min (Worthington, et al., 1991) and a tidal volume per breath equals 294.6 ml (Stahl, 1967). Nasal lining was considered rigid where no-slip boundary condition was set for the fluid velocity.
The nasal tissue layer’s temperature To was set to the body temperature, 34 oC. At a relative humidity of 100%, nasal tissue layer’s water mass fraction Fo equaled 3.34%. Nasal epithelial layer’s thermal conductivity Kmemb was 0.6 W/mK (Lervik, et al., 2010). The coefficient of mass diffusion of the epithelial layer, as a high density-water vapor source (Lee, et al., 1954), Dmemb
equaled 2.6 x 10⁻⁵ m2/s. Figure 6.1 illustrates the material properties and the boundary conditions.
46
At nasopharyngeal level, time-averaged velocity of the inspiratory airflow was determined using the nasopharynx/pharynx cross-section’s area, the breathing rate (Worthington, et al., 1991), and the tidal volume at rest state (Stahl, 1967) (see Table 6.1). The area of nasopharynx/pharynx cross- section was determined from CT scanning with the aid if the software Magics.
Tidal volume at rest state was calculated referring to the following equation (Stahl, 1967).
𝑻𝑽 = 𝟕. 𝟔𝟗𝑩𝑾𝟏.𝟎𝟒 (5)
where TV and BW denote the chimpanzee tidal volume at rest and its body weight, respectively.
The breathing rate was calculated referring to the following equation (Worthington, et al., 1991).
𝒇 = 𝟎. 𝟖𝟒𝑩𝑾−𝟎.𝟐𝟖 (6) Fig. 6.1 Boundary conditions for numerical simulation: Nasopharynx/pharynx was assigned an outward velocity of 1.4 m/s. Nares were treated as free inlets. Nasal cavity lining had a non-slip boundary. To, Kmemb, Fo, δmemb, Dmemb indicate the tissue layer’s temperature, thermal conductivity of the epithelial layer, tissue layer’s mass fraction of water (under relative humidity of 100% at 34oC), epithelial layer’s thickness, and mass diffusion coefficient of the epithelial layer, respectively.