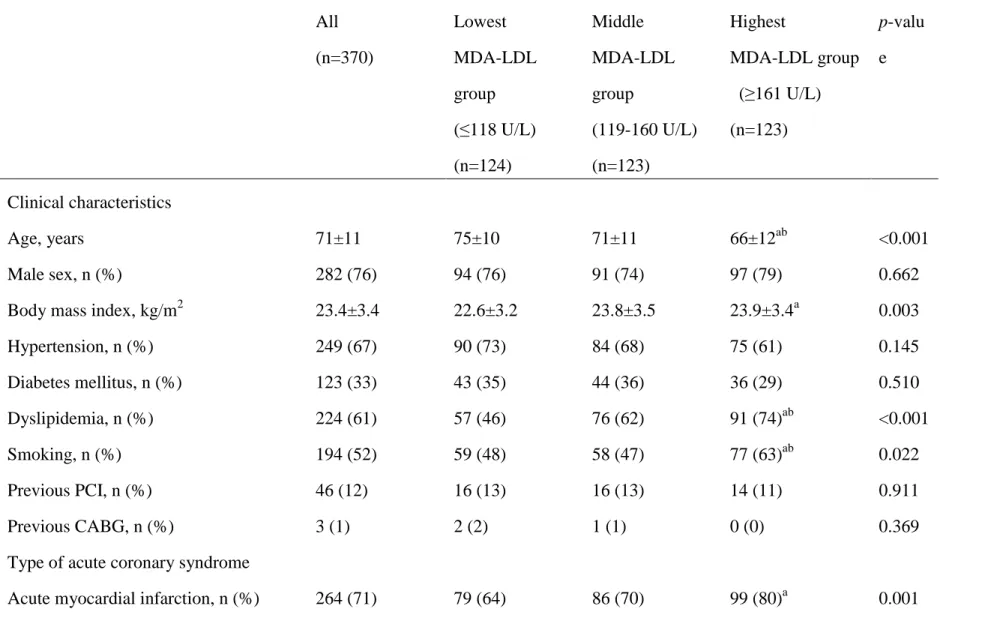
Table 1. Baseline characteristics of patients with ACS in each three groups according to tertile value of serum MDA-LDL levels (main study).
All (n=370)
Lowest MDA-LDL group (≤118 U/L) (n=124)
Middle MDA-LDL group
(119-160 U/L) (n=123)
Highest
MDA-LDL group (≥161 U/L) (n=123)
p-valu e
Clinical characteristics
Age, years 71±11 75±10 71±11 66±12ab <0.001
Male sex, n (%) 282 (76) 94 (76) 91 (74) 97 (79) 0.662
Body mass index, kg/m2 23.4±3.4 22.6±3.2 23.8±3.5 23.9±3.4a 0.003
Hypertension, n (%) 249 (67) 90 (73) 84 (68) 75 (61) 0.145
Diabetes mellitus, n (%) 123 (33) 43 (35) 44 (36) 36 (29) 0.510
Dyslipidemia, n (%) 224 (61) 57 (46) 76 (62) 91 (74)ab <0.001
Smoking, n (%) 194 (52) 59 (48) 58 (47) 77 (63)ab 0.022
Previous PCI, n (%) 46 (12) 16 (13) 16 (13) 14 (11) 0.911
Previous CABG, n (%) 3 (1) 2 (2) 1 (1) 0 (0) 0.369
Type of acute coronary syndrome
Acute myocardial infarction, n (%) 264 (71) 79 (64) 86 (70) 99 (80)a 0.001
Unstable angina pectoris, n (%) 106 (29) 45 (36) 37 (30) 24 (20)a 0.001 Angiographic characteristics
Multi-vessel disease, n (%) 164 (44) 47 (38) 55 (45) 62 (50) 0.141
Infarct-related artery
Right, n (%) 136 (37) 41 (33) 51 (41) 44 (36) 0.377
Left anterior descending, n (%) 184 (50) 69 (56) 51 (41) 64 (52) 0.069
Left circumflex, n (%) 45 (12) 13 (10) 18 (14) 14 (11) 0.577
Left main trunk, n (%) 5 (1) 1 (1) 3 (2) 1 (1) 0.442
% stenosis of target lesion
90%, n (%) 105 (28) 43 (35) 37 (30) 25 (20)a 0.038
99%, n (%) 117 (32) 36 (29) 38 (31) 43 (35) 0.592
100%, n (%) 148 (40) 45 (36) 48 (39) 55 (45) 0.387
TIMI grade of pre-PCI
0, n (%) 147 (40) 44 (36) 48 (39) 55 (45) 0.327
Ⅰ, n (%) 28 (8) 8 (7) 10 (8) 10 (8) 0.847
Ⅱ, n (%) 90 (24) 29 (23) 28 (23) 33 (27) 0.726
Ⅲ, n (%) 105 (28) 43 (35) 37 (30) 25 (20)a 0.038
Stent use, n (%) 362(98) 119 (96) 122(99) 121 (98) 0.194
Bare metal stent, n (%) 153 (41) 49 (40) 48 (39) 56 (46) 0.514
Drug eluting stent, n (%) 209 (56) 70 (56) 74 (60) 65 (53) 0.512 Follow up coronary angiography, n (%) 232 (63) 77 (62) 76 (62) 79 (64) 0.911 Biochemical data
Total cholesterol, mg/dl 196±36 170±35 194±33 222±40ab <0.001
Triglyceride, mg/dl 110 (69-164) 89 (55.8-130) 110 (69-149) 136 (96-210)ab <0.001
LDL-C, mg/dl 120±33 98±31 119±31 143±38ab <0.001
HDL-C, mg/dl 49±14 52±14 49±14 47±14a 0.023
LDL-C / HDL-C ratio 2.6±0.9 2.0±0.8 2.6±0.9 3.2±1.0ab <0.001
MDA-LDL, U/L 150±37 93±18 138±11 221±60ab <0.001
MDA-LDL/LDL-C ratio 1.3±0.5 1.0±0.4 1.3±0.5 1.6±0.6ab <0.001
Hemoglobin A1c, % 6.3±1.2 6.2±1.1 6.4±1.4 6.2±1.3 0.349
Brain natriuretic peptide, pg/dl 79 (20-212) 117 (29-362) 40 (16-126) 68 (16-212) 0.047 Peak CPK, IU/L 1684 (522-3432) 913 (365-2500) 1797 (688-3575) 2019 (733-5270)a <0.001
Peak CK-MB, IU/L 74 (17-250) 36 (13-150) 86 (17-248) 125 (32-355)a 0.004
eGFR, ml · min-1· 1.73 m-2 54±19 52±19 52±19 59±18ab 0.006
Medications on admission
Aspirin, n (%) 81 (22) 35 (28) 26 (21) 20 (16) 0.073
Clopidogrel, n (%) 49 (13) 19 (15) 15 (12) 15 (12) 0.704
ACEI, n (%) 19 (5) 7 (6) 7 (6) 5 (4) 0.805
ARB, n (%) 113 (31) 41 (33) 42 (34) 30 (24) 0.190
Beta-blocker, n (%) 36 (10) 14 (11) 16(13) 6 (5) 0.076
Statin, n (%) 76 (21) 29 (23) 31 (25) 16 (13)ab 0.038
Insulin, n (%) 17 (5) 4 (3) 10(8) 3 (2) 0.069
Oral hypoglycemic agent, n (%) 67 (18) 25 (20) 23 (9) 19 (15) 0.616
Values are expressed as mean ± standard deviation, median and interquartile range, or absolute number of cases (relative percentage) as appropriate. ACEI = angiotensin-converting enzyme inhibitor; ACS = acute coronary syndrome; ARB = angiotensin II receptor blocker; CABG = coronary artery bypass grafting; CK-MB = creatine kinase MB; CPK = creatine phosphokinase; eGFR = estimated glomerular filtration rate; HDL-C = high-density lipoprotein cholesterol; LDL-C = low-density lipoprotein cholesterol; MDA-LDL = malondialdehyde-modified low-density lipoprotein; PCI = percutaneous coronary intervention.
ap < 0.05 vs the lowest group; bp < 0.05 vs the middle group.
Table 2. Comparison of clinical events among three groups according to serum MDA-LDL levels in patients with ACS (main study).
All (n=370)
Lowest
MDA-LDL group (≤118 U/L)
(n=124)
Middle
MDA-LDL group (119-160 U/L) (n=123)
Highest MDA-LDL group (≥161 U/L)
(n=123)
p-value
MACCE (all cause), n (%) 82 (22) 12 (10) 30 (24) 40 (33) <0.001
Cardiovascular death, n (%) 11 (3) 1 (1) 5 (4) 5 (4) 0.219
Non-fatal myocardial infarction, n (%) 6 (2) 2 (2) 1 (1) 3 (2) 0.601
Non-fatal stroke, n (%) 6 (2) 3 (2) 2 (2) 1 (1) 0.607
Revascularization (%) 49 (13) 3 (2) 17 (14) 29 (24) <0.001
Heart failure requiring hospital admission, n (%) 10 (3) 3 (2) 5 (4) 2 (2) 0.485
Values are expressed as absolute number of events (relative percentage). ACS = acute coronary syndrome; MACCE = major adverse cardiovascular and cerebral events; MDA-LDL = malondialdehyde-modified low-density lipoprotein.
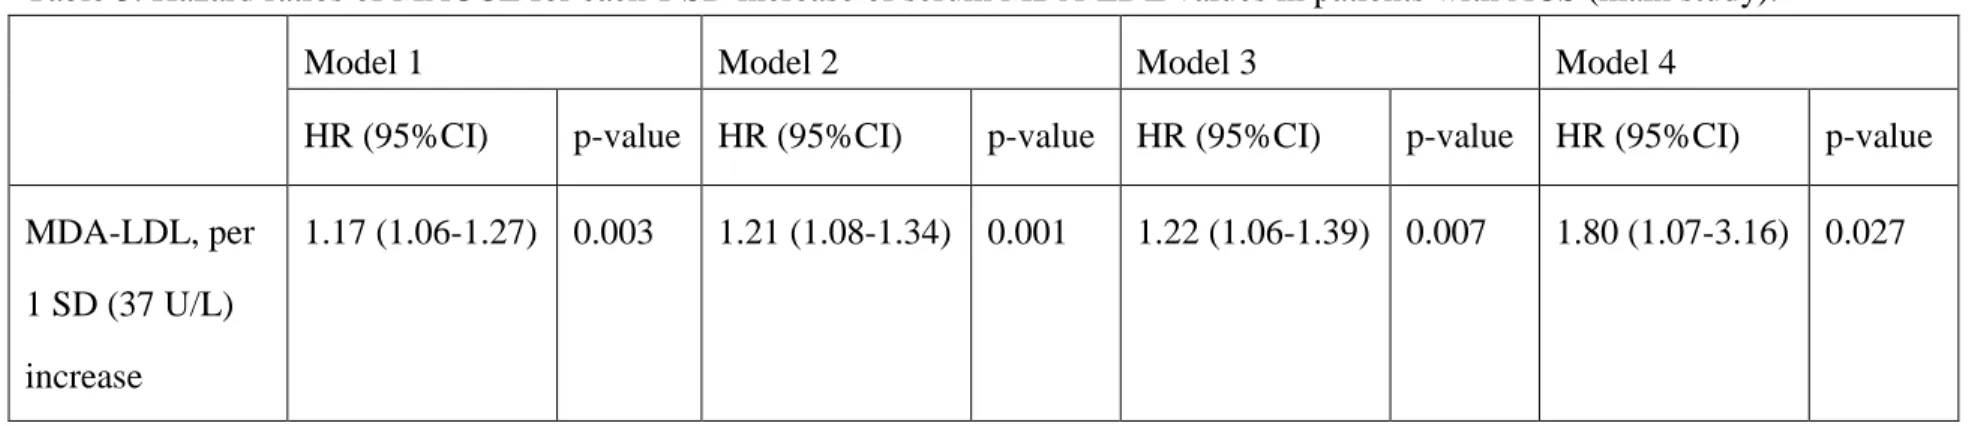
Table 3. Hazard ratios of MACCE for each 1 SD increase of serum MDA-LDL values in patients with ACS (main study).
Model 1 Model 2 Model 3 Model 4
HR (95%CI) p-value HR (95%CI) p-value HR (95%CI) p-value HR (95%CI) p-value MDA-LDL, per
1 SD (37 U/L) increase
1.17 (1.06-1.27) 0.003 1.21 (1.08-1.34) 0.001 1.22 (1.06-1.39) 0.007 1.80 (1.07-3.16) 0.027
Model 1: unadjusted.
Model 2: adjusted for age, sex, hypertension, dyslipidemia, diabetes mellitus, smoking, and body mass index.
Model 3: adjusted for total cholesterol (per 1 SD [36 mg/dl] increase), triglycerides (*), low-density lipoprotein cholesterol (per 1 SD [33 mg/dl] increase), high-density lipoprotein cholesterol (per 1 SD [14 mg/dl] increase), and statin use (on admission), in addition to model 2.
Model 4: adjusted for peak creatine phosphokinase (*), brain natriuretic peptide (*), and presence or absence of multivessel disease, in addition to model 3.
* per 1 increase in logarithmic transformed number
CI = confidence interval; HR = hazard ratio; MACCE = major adverse cardiovascular and cerebral events; MDA-LDL = malondialdehyde-modified low-density lipoprotein; SD = standard deviation.
Table 4. Baseline characteristics of patients with AMI in each two groups according to median value of serum MDA-LDL levels (sub-study).
All patients with acute myocardial infarction
(n=264)
Lower MDA-LDL group
(≤141 U/L) (n=130)
Higher MDA-LDL group
(≥142 U/L) (n=134)
p-value
Clinical characteristics
Age, years 71±12 74±11 68±11 <0.001
Male sex, n (%) 197 (75) 92 (71) 105 (78) 0.157
Body mass index, kg/m2 23.2±3.4 22.7±3.5 23.7±3.3 0.015
Hypertension, n (%) 163 (62) 78 (60) 85 (63) 0.566
Diabetes mellitus, n (%) 81 (31) 42 (32) 39 (29) 0.573
Dyslipidemia, n (%) 158 (60) 61 (47) 97 (72) <0.001
Smoking, n (%) 143 (54) 67 (52) 76 (57) 0.399
Previous PCI, n (%) 26 (10) 13 (10) 13 (10) 0.935
Previous CABG, n (%) 2 (1) 1 (1) 1 (1) 0.979
Type of acute myocardial infarction
STEMI, n (%) 190 (72) 89 (68) 101 (75) 0.211
NSTEMI, n (%) 74 (28) 41 (32) 33 (25) 0.211
Angiographic characteristics
Multi-vessel disease, n (%) 119 (45) 46 (35) 73 (54) 0.002
Infarct-related artery
Right, n (%) 98 (37) 46 (35) 52 (39) 0.565
Left anterior descending, n (%) 127 (48) 60 (46) 67 (59) 0.532
Left circumflex, n (%) 35 (13) 22 (17) 13 (10) 0.084
Left main trunk, n (%) 4 (2) 2 (2) 2 (1) 0.976
% stenosis of target lesion
90%, n (%) 47 (18) 28 (22) 19 (14) 0.118
99%, n (%) 83 (31) 40 (31) 43 (32) 0.817
100%, n (%) 134 (51) 62 (48) 72 (54) 0.327
TIMI grade of pre-PCI
0, n (%) 133 (50) 61 (47) 72 (54) 0.269
Ⅰ, n (%) 18 (7) 6 (5) 12 (9) 0.162
Ⅱ, n (%) 66 (25) 35 (27) 31 (23) 0.477
Ⅲ, n (%) 47 (18) 28 (22) 19 (14) 0.118
Stent use, n (%) 258 (98) 125 (96) 133 (99) 0.091
Bare metal stent, n (%) 122 (46) 59 (45) 63 (47) 0.791
Drug eluting stent, n (%) 128 (49) 66 (51) 70 (52) 0.811
Follow up coronary angiography, n (%) 169 (64) 83 (64) 86 (64) 0.955
Biochemical data
Total cholesterol, mg/dl 199±44 181±38 217±41 <0.001
Triglyceride, mg/dl 104 (69-160) 87 (58-127) 126 (91-200) <0.001
LDL-C, mg/dl 124±40 109±34 138±40 <0.001
HDL-C, mg/dl 50±14 52±14 48±14 0.059
LDL-C / HDL-C ratio 2.6±1.0 2.3±0.9 3.0±1.0 <0.001
MDA-LDL, U/L 157±69 107±24 206±63 <0.001
MDA-LDL/LDL-C ratio 1.3±0.6 1.0±0.4 1.6±0.7 <0.001
Hemoglobin A1c, % 6.3±1.2 6.2±1.2 6.3±1.2 0.741
Brain natriuretic peptide, pg/dl 111 (25-308) 162 (43-403) 41 (13-226) 0.028
Peak CPK, IU/L 1692 (526-3451) 1035 (411-2880) 2105 (787-4554) <0.001
Peak CK-MB, IU/L 151 (44-320) 101 (36-276) 195 (81-377) <0.001
eGFR, ml · min-1· 1.73 m-2 55±19 54±19 56±18 0.369
Medications on admission
Aspirin, n (%) 39 (15) 20 (15) 19 (14) 0.783
Clopidogrel, n (%) 15 (6) 10 (8) 5 (4) 0.165
ACEI, n (%) 12 (5) 6 (5) 6 (4) 0.957
ARB, n (%) 73 (28) 37 (28) 36 (27) 0.772
Beta-blocker, n (%) 17 (6) 7 (5) 10 (7) 0.492
Statin, n (%) 45 (17) 27 (21) 18 (13) 0.113
Insulin, n (%) 9 (3) 5 (4) 4 (3) 0.700
Oral hypoglycemic agent, n (%) 42 (16) 23 (18) 19 (14) 0.435
Values are expressed as mean ± standard deviation, median and interquartile range, or absolute number of cases (relative percentage) as appropriate. ACEI = angiotensin-converting enzyme inhibitor; ACS = acute coronary syndrome; ARB = angiotensin II receptor blocker; CABG = coronary artery bypass grafting; CK-MB = creatine kinase MB; CPK = creatine phosphokinase; eGFR = estimated glomerular filtration rate; HDL-C = high-density lipoprotein cholesterol; LDL-C = low-density lipoprotein cholesterol; MDA-LDL = malondialdehyde-modified low-density lipoprotein; NSTEMI = non-ST-elevation myocardial infarction; PCI = percutaneous coronary intervention; STEMI = ST-elevation myocardial infarction.
ap < 0.05 vs the lowest group; bp < 0.05 vs the middle group.
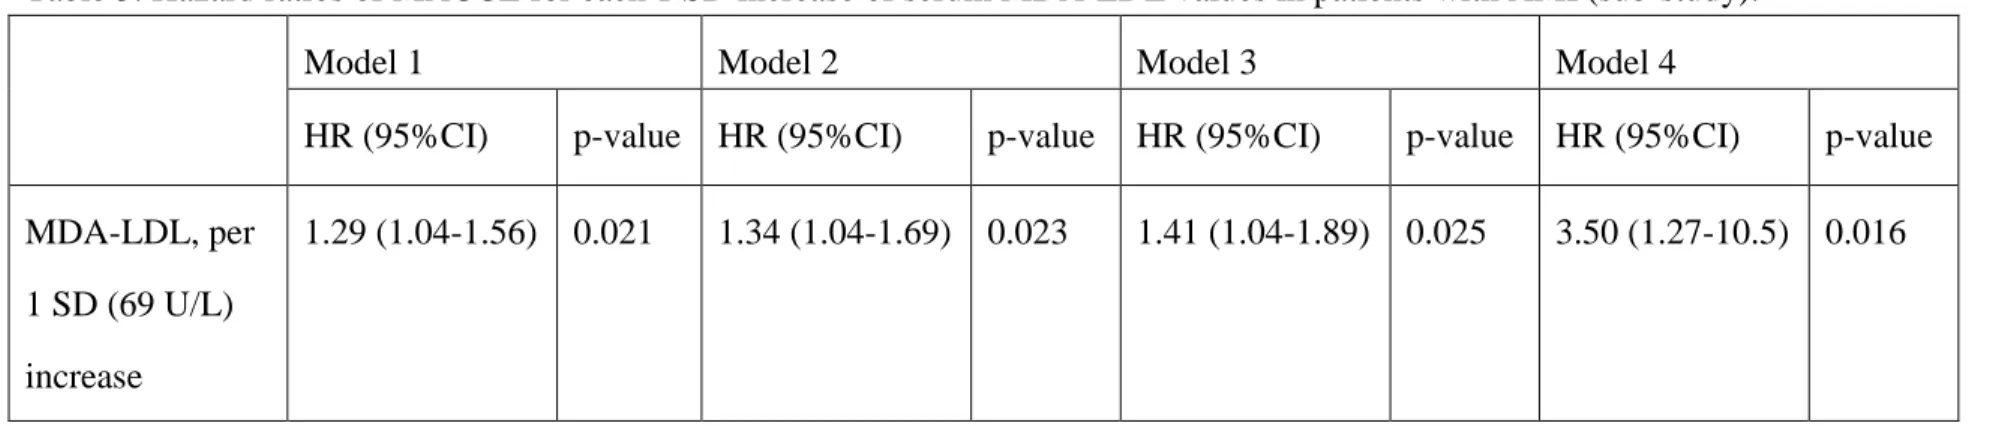
Table 5. Hazard ratios of MACCE for each 1 SD increase of serum MDA-LDL values in patients with AMI (sub-study).
Model 1 Model 2 Model 3 Model 4
HR (95%CI) p-value HR (95%CI) p-value HR (95%CI) p-value HR (95%CI) p-value MDA-LDL, per
1 SD (69 U/L) increase
1.29 (1.04-1.56) 0.021 1.34 (1.04-1.69) 0.023 1.41 (1.04-1.89) 0.025 3.50 (1.27-10.5) 0.016
Model 1: unadjusted.
Model 2: adjusted for age, sex, hypertension, dyslipidemia, diabetes mellitus, smoking, and body mass index.
Model 3: adjusted for total cholesterol (per 1 SD [44 mg/dl] increase), triglycerides (*), low-density lipoprotein cholesterol (per 1 SD [40 mg/dl] increase), high-density lipoprotein cholesterol (per 1 SD [14 mg/dl] increase), and statin use (on admission), in addition to model 2.
Model 4: adjusted for peak creatine phosphokinase (*), brain natriuretic peptide (*), and presence or absence of multivessel disease, in addition to model 3.
* per 1 increase in logarithmic transformed number
AMI = acute myocardial infarction; CI = confidence interval; HR = hazard ratio; MACCE = major adverse cardiovascular and cerebral events; MDA-LDL = malondialdehyde-modified low-density lipoprotein; SD = standard deviation.