Analysis of dependency of ice-cloud on cloud base temperature with the polarized micro-pulse lidar over Ny-Alesund
Kyohei Yamada1, Masataka Shiobara1,2 and Yutaka Kondo1
1National Institute of Polar Research
2The Graduate University for Advanced Studies
Cloud is one of the important factor to affect on the surface energy budget. To investigate cloud, micro-pulse lidar (MPL) is a compact, eye-safe and maintenance-free lidar system to be useful instrument. Because of the advantages of capability for night-time, high-resolution, and accuracy observation, MPL analysis is widely used for investigation of cloud in the Arctic region, however it cannot retrieve cloud phase (liquid/water or solid/ice) information. Polarized micro-pulse lidar (PMPL) can retrieve information of cloud particle phase by receiving polarization. Ny-Alesund, Svalbard (78o56’N, 11o52’, 40m a.s.l.;
Figure 1) has PMPL, however it is not analysed yet because it started recently. In this study, we used PMPL at Ny-Alesund and estimated the dependency of cloud base temperature (CBT) for ice cloud.
PMPL at Ny-Alesund is SigmaSpace MPL-4-Pol, model and installed by the National Institute of Polar Research (NIPR) from 2013. The data of PMPL is used from May, 2014 to December, 2015, which period is continuously observed except from the middle of September to the middle of December, 2015. The range resolutions are 30 m from 5 December 2014 to 6 March 2015 and 15 m for other observation period. Max range is 32,700 m. The time resolution is 1 minute.
Cloud base height (CBH) is estimated by an increasing ratio of the attenuated backscatter (ABS); if the vertical gradient of ABS becomes greater than 2x10⁻⁵ /km/sr and the ABS is not smaller than the next upper layer, the layer is cloud base (Sugimoto et al., 2001). To specify cloud containing ice or not, we used the depolarization ratio, Δ, is defined as below formula,
Δ=P⊥(r) /P//(r), (Eq.1)
where P and P∥ are perpendicular and parallel polarization signals, respectively. If Δ is equal or larger than 10 %, we consider that the cloud layer is “high-depolarization” and mixed with ice-particle. If Δ is smaller than 10 %, the cloud layer is “low-depolarization” and the layer is assumed to be constructed only by water droplet. When ABS and Δ are estimated, vertical and time resolutions are smoothed from 15 or 30 m to 90 m and 1 minute to 15 minutes, respectively. CBH is estimated only below 12 km. If standard deviation of Δ among before and after 15 minutes and upper and lower layers is larger than 0.1, laser at the layer is extinct and the layer is not used. If CBH is not be retrieved, the observation time is “undetected”, which is not be estimated cloud phases. Figure 2 shows an example of classification of cloud phase from ABS and Δ on 1 October 2014. In this study, information of only bottom of cloud is used. To retrieve cloud base temperature (CBT), vertical distribution data of temperature observed by radiosonde is used. Radiosonde observation is normally executed at 11 UTC at Ny-Alesund. Because there is only limited data for temporal, temperature is interpolated by radiosonde data to adjust lidar temporal resolution.
Figure 3 indicates the monthly means frequencies of cloud with bottom of low-depolarization, high-depolarization, and no- detection over Ny-Alesund. Cloud with low-deporarization bottom, which is mainly constructed by water droplet, increases in summer and decreases in winter season; the maximum ratio of monthly mean low-depolarization is approximately 64 % in July and the minimum is approximately 17 % in February. On the other hands, cloud with high-depolarization bottom, which is mainly constructed by ice particle, decreases in summer seasons; the maximum and minimum ratios of high-depolarization are approximately 36 % in March and 9% in July, respectively. Frequency of low-depolarization cloud is dominant throughout the
Figure 1. Location. Figure 2. An example of classification at October 1st, 2014.
year. The seasonal cycles of total cloud frequency is similar to that of low-depolarization cloud. In comparison with Shupe (2011), the seasonal cycle at Ny-Alesund is similar to that at Barrow (71o49’N, 15o41’W) but very different from Eureka (80o48’N, 85o52’W). The ratio of high-depolarization (ice) cloud of Ny-Alesund is smaller than Barrow and Eureka stations.
Figure 4 shows the distribution of frequencies of CBT. Frequency of cloud with bottom of low-depolarization is maximum at - 6℃ and frequencies of -15 to +4℃ maintain large. High-depolarization cloud appears frequently from -10 to +2℃.
Frequencies both of low- and high-depolarization cloud decrease with decreasing CBT below the temperature of approximately -8℃. Frequency of appearance of low-depolarization cloud is very small under 20℃. Shupe (2011) investigated the cloud temperature and phase information at Barrow, Eureka, and SHEBA (75o–80oN, 143o–167oW). They showed that complete water cloud does not exist below -24℃ and mostly mixed cloud does not exists below -40℃. The present study is corresponding to the result of previous study from the other Arctic stations.
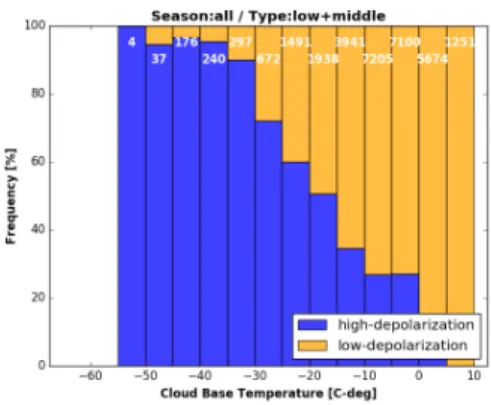
Figure 5 shows the frequencies depending on CBT for low and middle cloud (CBH <6km). For low and middle cloud, frequency of cloud with bottom of high-depolarization increases with decreasing CBT. The ratio of low-depolarization cloud is smaller than half (50 %) with CBT below -15℃ and smaller than 5 % below -35℃. Below -40℃, low-depolarization cloud bottom appears frequently. Comparing with Leipzig, Germany (51.18°N, 12.24°E; Seifert et al., 2010), water (low- depolarization) cloud of low-middle altitude in Ny-Alesund appears frequently from -20 to -30℃. In the other temperature zone, the CBH dependency of ice (high-depolarization) cloud of low-middle altitude existence in the present study is generally corresponding to Leipzig.
References
Seifert, P., Ansmann, A., Mattis, I., Wandinger, U., Tesche, M., Engelmann, R., ... & Haustein, K. (2010). Saharan dust and heterogeneous ice formation: Eleven years of cloud observations at a central European EARLINET site.Journal of Geophysical Research: Atmospheres, 115(D20).
Shupe, M. D. (2011). Clouds at Arctic atmospheric observatories. Part II: Thermodynamic phase characteristics. Journal of Applied Meteorology and Climatology, 50(3), 645-661.
Sugimoto, N., Matsui, I., Liu, Z., Shimizu, A., Asai, K., Yoneyama, K., & Katsumata, M. (2001). Latitudinal distribution of aerosols and clouds in the western Pacific observed with a lidar on board the research vessel Mirai.Geophysical research letters, 28(22), 4187-4190.
Figure 3. Frequencies of cloud with bottom of low-depolarization, high-depolarization, and no-detection over Ny-Alesund.
Figure 5. Frequencies of CBT for low-middle over Ny-Alesund.
Numbers at top are retrieval frequencies.
Figure 4. Distributions of frequencies of cloud base temperature.