New functional polar maps for estimating regional cardiac function using ECG‑gated technetium‑99m‑tetrofosmin SPECT
著者 Onoguchi Masahisa, Maruno Hirotaka, Takayama Teruhiko, Naoi Yutaka, Irimoto Masahiro, Maehara Nobuyuki, Katayama Hitoshi, Murata Hajime
journal or
publication title
Journal of Nuclear Medicine Technology
volume 280
number 1
page range 294‑354
year 2000‑03‑01
URL http://hdl.handle.net/2297/6999
New Functional Polar Maps for Estimating Regional Cardiac Function Using ECG-Gated Technetium-99m-Tetrofosmin SPECT
Masahisa Onoguchi, Hirotaka Maruno, Teruhiko Takayama, Yutaka Naoi, Masahiro Irimoto, Nobuyuki Maehara, Hitoshi Katayama and Hajime Murata
Department of Clinical Radiological Technology, School of Health Sciences, Kanazawa University, Kanazawa; Division of Nuclear Medicine, Toranomon Hospital, Tokyo; Department of Radiology, School of Medicine, Jyuntendo University, Tokyo; and National Institute of Radiological Sciences, Chiba, Japan
Objective: The purpose of this work was to develop func- tional parameters to analyze regional cardiac function using ECG-gated 99mTc-tetrofosmin SPECT. Our goal was to de- velop a methodology that used slice thickness correction, the generation of a time-activity curve and a polar map.
Methods: Fourteen normal patients without evidence of coronary artery disease were studied. One hour after intrave- nous injection of 740–1110 MBq (20–30 mCi)99mTc-tetrofos- min, ECG-gated SPECT data were acquired by dividing a cardiac cycle into 12 frames. The SPECT data were recon- structed from 11 of 12 frames into 3 views. The reconstruction of these images was repeated after performing slice thick- ness correction. Excluding the effect of different apex-to-base lengths at any frame during a cardiac cycle, 10 short-axis images with the same slice thickness were obtained. Each short-axis image was divided by 40 radii into 40 segments.
The time-activity curve was generated from the total counts included in each segment plus both neighboring segments.
Subsequently the curve fitting was performed using the second Fourier function.
Results: From fitted curves and their differentials, we calcu- lated end-systolic count, end-diastolic count, percent count increase, uptake, peak contraction rate, peak distention rate and contraction time.
Conclusion: The functional polar maps visually demon- strated regional myocardial function. This method is expected to be helpful for assessing regional cardiac function using
99mTc-tetrofosmin.
Key Words: regional cardiac function; ECG-gated SPECT;
99mTc-tetrofosmin; functional polar map J Nucl Med Technol 2000; 28:29–35
It is important to evaluate cardiac function as well as myocar- dial perfusion in most patients with coronary artery disease (CAD). Myocardial perfusion has been evaluated with201Tl and
99mTc myocardial imaging agents (1–4). The simultaneous assessment of myocardial perfusion and cardiac function is preferable for convenience and cost (5–7). Electrocardio- graphic (ECG) gated SPECT has the potential to provide simultaneous assessment of myocardial perfusion and cardiac function. Since Moore et al. (8) first reported ECG-gated SPECT for cardiac blood-pool scintigraphy, various parameters have been derived to estimate cardiac function, including left ventricular ejection fraction (LVEF), amplitude, phase, percent count increase (%CI) and percent wall thickening (%WT) (9–16). Many authors have estimated absolute values and the curve patterns of these parameters. However, there are not many reports on functional images using these parameters (9–10,17). The aim of this study was to develop functional polar map displays using parameters derived from99mTc-tetrofosmon ECG-gated SPECT data.
MATERIALS AND METHODS Study Population
The study population consisted of 14 patients (10 men and 4 women) without known CAD. Their ages ranged from 24–61 y (mean age: 40.6⫾13.7 y). All patients had echocardiography.
All of the ECGs demonstrated normal sinus rhythm. We then performed ECG-gated SPECT after administering 740–1110 MBq (20–30 mCi)99mTc-tetrofosmin.
Preparing Technetium-99m-Tetrofosmin
Technetium-99m-tetrofosmin (Nihon Medi⫹Physics Corp., Tokyo, Japan) was prepared from a freeze-dried kit by reconsti- tution with approximately 740–1110 MBq (20–30 mCi) in 2 mL of a sterile pertechnetate solution. Each preparation met or exceeded the manufacturer’s quality control recommendations.
Imaging Protocol
One hour after injecting 740–1110 MBq (20–30 mCi)
99mTc-tetrofosmin, ECG-gated SPECT studies were performed using a rotating gamma camera (4000 XC/T–Starcam; General Electric, Milwaukee, WI) equipped with a low-energy all-
For correspondence or reprints contact: Masahisa Onoguchi, Department of Clinical Radiological Technology, School of Health Sciences, Kanazawa University, 5–11–80 Kodatsuno, Kanazawa, Ishikawa, Japan 920–0942; Phone:
⫹81–76–265–2526; E-mail: [email protected].
purpose collimator. The energy discriminator was centered on 140 keV with a 20% window. Thirty-two projections for 50 s per projection were acquired over a 180° semicircular arc extending from the 45° right anterior oblique (RAO) position to the 45° left posterior oblique (LPO) position. Twelve frames per cardiac cycle were acquired at each projection. All images were obtained with a 64⫻64 matrix and a zoom of 1.33. The SPECT data were prefiltered with a Hanning filter (cutoff 0.8). The SPECT images were reconstructed with a filtered backprojec- tion algorithm and ramp filter (cutoff 0). No attenuation correction was performed.
Procedure for Creating the Polar Map Display
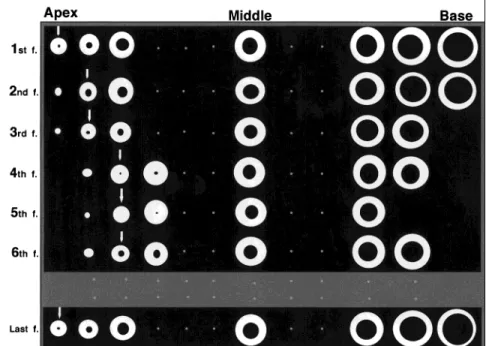
Step 1: Reconstruction of the SPECT Images. The cardiac cycle was divided into 12 frames, and the horizontal long-axis, vertical long-axis and short-axis images were reconstructed from the SPECT data. Figure 1 shows the alignment of short-axis images from the apex to the base for each frame during a cardiac cycle. The 12th frame was excluded from the analysis because it had greater variation in counts than the first 11 frames.
Step 2: Performing the Slice Thickness Correction. Ten short-axis images with the same slice thickness were obtained from each frame (Fig. 2) to exclude the effect of the different apex-to-base lengths at any frame during a cardiac cycle. After performing the slice thickness correction, the reconstruction of these images was repeated.
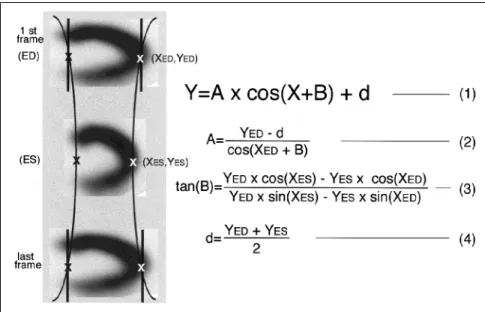
Step 3: Identification of End-Systole and End-Diastole. The apex and the base in the end-systolic (ES) and the end-diastolic (ED) images were manually determined. From these locations, the apex (A) and the base (B) at each frame was automatically determined because these locations at the remaining frames can be approximated by trigonometric function using the least square method (Fig. 3):
Y⫽A⫻cos (X⫹B)⫹d (1)
A⫽(YED⫺d)/cos (XED⫹B) (2)
tan (B)⫽YED⫻cos (XES)⫺YES⫻cos (XED)/
[YED⫻sin (XES)⫺YES⫻sin (XED) (3)
d⫽(YED⫹YES)/2, (4)
where X and Y are the locations of the apex (A) and the base (B), respectively, at any frame. Examples of ES and ED are shown in Figure 3.
Step 4: Slice Reframing Process. The short-axis images were aligned after reconstruction using the slice thickness correction (Step 2). Each frame was divided into 10 slices (Fig. 4).
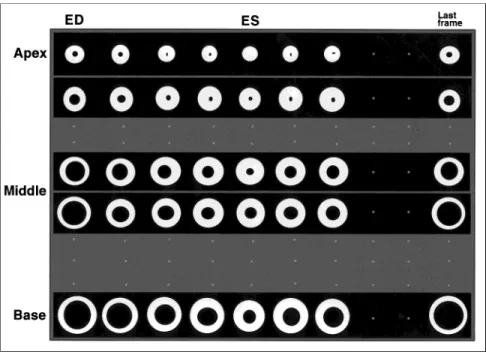
Step 5: Generation of Time-Activity Curve. The centers and the radii on the apical and the basal images at ES and ED were manually determined (Fig. 5). The myocardium of the left ventricle was defined as the area whose counts were more than 20% (threshold value) of the maximum counts. The centers and the radii in the remaining slices were determined by Equation 1 above. Each short-axis image was divided by 40 radii into 40 segments. The time-activity curve (TAC) from each segment was generated from the total counts included in each segment plus both neighboring segments. A total of 400 TACs were used for analysis for each patient.
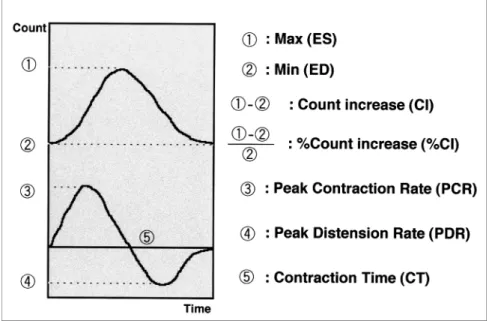
Step 6: Curve Fitting and Derivation of Functional Parameters. Each time-activity curve was fitted to the second order Fourier function. By analyzing fitted curves and these differential curves (Fig. 6), the following parameters were obtained: ES count (MAX); ED count (MIN); count increase (CI); percent count increase (%CI); uptake; peak contraction rate (PCR); peak distention rate (PDR); and contraction time (CT), where:
MAX⫽the maximum count on the fitted curve MIN⫽the minimum count on the fitted curve
FIGURE 1. The alignment of short-axis im- ages from the apex to the base (left to right) for each frame during a cardiac cycle. Thirty-two projections were acquired.
Count increase (CI)⫽MAX⫺MIN
Percent count increase (% CI)⫽(MAX⫺MIN)
MIN ⫻100
Uptake⫽the average count in the fitted curve Peak contraction rate (PCR)⫽the peak counting rate
increase at ES
Peak distention rate (PDR)⫽the peak counting rate decrease at ED
Contraction time (CT)⫽the time interval from ED to ES Step 7: Generation of Polar Maps. Each functional polar map was made of 10 slices from the apex to the base and was estimated after dividing the polar map into 5 regions, represent- ing the apex, anterior, septal, inferior and lateral regions of the myocardium. The means in each region were calculated.
Percent ESMax(%ESMax), percent EDMin(%EDMin) and percent uptake (%Uptake) were obtained by dividing ESMax, EDMinand Uptake, respectively, by the maximum of each parameter in the 5 regions. Percentage CT (%CT) was obtained by dividing CT by the minimum in the 5 regions. Percentage PCR (%PCR) and
%PDR were obtained by dividing the PCR and the PDR, respectively, by each Min value in 5 regions. Finally, the functional polar maps were interpreted by visual analysis.
Statistical Analysis
All results were expressed as mean⫾1 SD. The significant difference was assessed with Fisher’s protected least significant difference (Fisher’s PLSD). Significance was defined at the level of P⬍0.05.
RESULTS
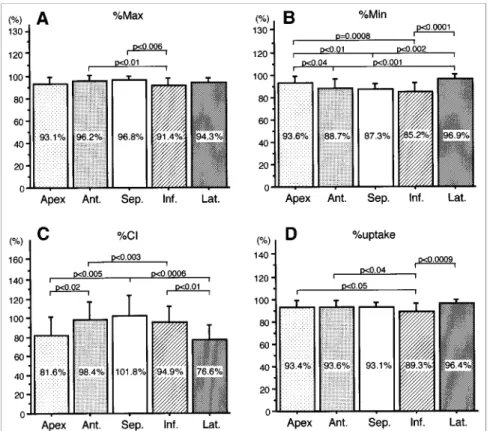
Figure 7 shows an example of the functional polar maps generated from 1 individual. Figures 8 and 9 show the mean values of the functional parameters by myocardial region in the normal subjects.
% Max
The mean %Max (Fig. 8A) was greater in the anterior and the septal regions, but lower in the inferior region. There was a statistically significant difference between the inferior and the anterior septal region (91.4% versus 96.2%, P⬍0.01; 91.4%
versus 96.8%, P⬍0.006).
FIGURE 3. After the manual identification of the apex and the base at both end-diastole (ED) and end-systole (ES), the locations if the ED and ES frames were automatically determined using the function Y⫽A⫻cos (X⫹B)⫹d.
FIGURE 2. Technique for slice thickness correction. The apex-to- base length of each frame was divided into 10 slices with the same thickness.
% Min
The mean %Min (Fig. 8B) was greater in the apex (93.6%) and lateral (96.9%) regions. The mean %Min was significantly lower in the septal (87.3%) and inferior (85.2%) regions.
% CI
The mean %CI (Fig. 8C) was 81.6%⫾19.6% in the apex, 98.4%⫾18.0% in the anterior, 101.8%⫾21.5% in the septal, 94.9%⫾ 17.1% in the inferior, and 76.6% ⫾ 15.4% in the lateral region. There was a significant difference between the septal and lateral regions (P⬍0.0006).
% Uptake
The %Uptake (Fig. 8D) in the inferior region was signifi- cantly lower than that in the lateral region (89.3% versus 96.4%, P⬍0.0009.
% PCR
The mean %PCR (Fig. 9A) was greater in the septal (4.17%), anterior (3.99%) and inferior regions (3.88%). This patter also n was shown in the %CI results. There was a significant difference between the septal and the lateral regions (P⬍0.0002).
% PDR
The mean %PDR (Fig. 9B) in the apex (3.58%) and the lateral (3.23%) regions was slightly lower than the values in the other regions, although there was no significant difference between the regions.
% CT
The mean %CT (Fig. 9C) was greater in the apex (110.5%), inferior (108.5%) and the lateral (110.5%) regions. It was significantly lower than in the septal region (101.5%; P ⬍ 0.002).
DISCUSSION
Since the first report on ECG-gated SPECT in cardiac blood-pool scintigraphy (8), many parameters have been de- rived (9–16). There are few reports of quantitative methods using these parameters and the generation of functional images (9–10,17).
The main improvements our method employs are the use of slice thickness correction and the generation of the time-activity curve. For the slice thickness correction, we made 10 short-axis images with the same thickness per frame to exclude the effect of different apex-to-base lengths during a cardiac cycle. For the FIGURE 5. The centers and the radii of the apical and the basal
images at end-diastole (ED) and end-systole (ES) were determined manually. ED and ES at all other frames were automatically deter- mined after selection of the 20% maximum count threshold level.
FIGURE 4. The realignment of the short-axis images after reconstruction with slice thickness correction. Each frame was divided into 10 slices.
generation of the time-activity curve, we used the total counts included in each segment plus both neighboring segments.
In previous reports the mean or the maximal counts only were used for generating the time-activity curve (10,12,16,17).
Since we used the total counts to generate the time-activity curve, we were able to derive new parameters including PCR, PDR and CT. These parameters may prove to be helpful in evaluating the cardiac function.
It has been noted that the center of short-axis images moves
toward the apex along the long axis from ED to ES and that the left ventricle has different sizes (13). The center of the short-axis images, therefore, should be determined according to the size of the left ventricle. For this reason, we manually determined the centers of the apical and the basal images at ED and ES and developed the software so that the centers of the remaining images were automatically determined by the for- mula given in Equation 1.
Technetium-99m myocardial imaging agents have character- FIGURE 6. A curve obtained by fitting the second order Fourier function to a time-activity curve, and its differential curve. The following parameters were derived from these curves:
end-systolic count (Max); end-diastolic count (Min); percentage count increase (%CI); uptake;
peak contraction rate (PCR); peak distention rate (PDR); and contraction time (CT).
FIGURE 7. Functional polar maps of %CI, %Uptake, %Max, %Min, %PCR, %PDR and %CT in a normal subject shows the differences between each segment. The scale for each parameter was normalized to 100% of the maximum of each parameter, except for %CI, which was normalized to 100% at the delayed contraction time.
istic increased extracardiac activity. After manually determin- ing the effective radius within the myocardium, the myocardial area was determined by the threshold value of 20% of the maximum counts to reduce the influence of scatter from hepatic activity.
Normal subjects showed different %CI in different segments.
The %Cl was greater in the septal (101.8%), anterior (98.4%) and inferior (94.9%) regions, and significantly lower in the apex (81.6%) and inferior (76.6%) regions. There was a significant difference between the septal and lateral regions (P⬍0.0006).
Our results were slightly higher than those reported by other authors. The difference seems to be caused by the difference in the way the myocardial counts were used for the generation of the time-activity curve. Mochizuki (10) and Shirakawa et al.
(18) used the maximal and mean counts, respectively, to
generate the time-activity curve. We used the total counts included in each region plus both neighboring regions.
The cardiac function has been estimated using parameters, such as peak ejection rate (PER) and peak filling rate (PFR), that is, the maximal up and down slopes of the left-ventricular volume curve, normalized to ED counts (19). A comparison between these parameters and our results should be performed.
In this study the effect of rotation of the left ventricle was ignored. It is known that contraction of the obliquely oriented fibers results in a counterclockwise twist of the left ventricle on the long axis (20–23). The correction of twist phenomenon should be analyzed.
It took 27 min for data acquisition with a single-head rotating gamma camera. Acquisition time would be reduced if a multihead rotating gamma camera were used. It took 20 min per patient to FIGURE 8. Bar graphs show mean⫾1 SD of
each parameter in 14 normal subjects: (A) %Max;
(B) %Min; (C) %CI; and (D) %Uptake. Segment abbreviations are: Ant.⫽anterior, Sep.⫽sep- tal, Inf.⫽inferior and Lat.⫽lateral.
FIGURE 9. Bar graphs show mean⫾1 SD of each parameter in 14 normal subjects: (A) %PCR; (B) %PDR; and (C) %CT. Segment abbreviations are: Ant.⫽anterior, Sep.⫽septal, Inf.⫽inferior and Lat.⫽lateral.
perform the data processing. The consumption of so much time restricted the routine use of this protocol. It was performed only in the institution where a supercomputer was available.
CONCLUSION
We developed an automatic software program to calculate several parameters including Max, Min, %CI, Uptake, PCR, PDR and CT and displayed functional images as polar maps.
This method may prove to be helpful for accurately assessing cardiac function. Additional study, of normal individuals and patients with CAD and other diseases that adversely affect myocardial function, needs to be performed.
REFERENCES
1. Canby RC, Silber S, Pohost GM. Relations of the myocardial imaging agents99mTc-MIBI and201Tl to myocardial blood flow in a canine model of myocardial ischemia insult. Circulation. 1990;81:289–296.
2. Glover DK, Okada RD. Myocardial kinetics of 99mTc-MIBI in canine myocardium after dipyridamole. Circulation. 1990;81:628–631.
3. Sinusas AJ, Shi Q, Saltzberg MT, et al. Technetium-99m-tetrofosmin to assess myocardial blood flow: experimental validation in an intact canine model of ischemia. J Nucl Med. 1994;35:664–671.
4. Rigo P, Leclercq B, Itti R, et al. Technetium-99m-tetrofosmin myocardial imaging: a comparison with thallium-201 and angiography. J Nucl Med.
1994;35:587–593.
5. Chua T, Kiat H, Germano G, et al. Gated technetium-99m sestamibi for simultaneous assessment of stress myocardial perfusion, postexercise re- gional ventricular function and myocardial viability. Correlation with echocardiography and rest thallium-201 scintigraphy. J Am Coll Cardiol.
1994;23:1107–1114.
6. Mazzanti M, Germano G, Kiat H, et al. Fast technetium-99m-labeled sestamibi gated single-photon emission computed tomography for evalua- tion of myocardial function. J Nucl Cardiol. 1996;3:143–149.
7. Williams KA, Lang RM, Reba RC, Taillon LA. Comparison of technetium- 99m sestamibi-gated tomographic perfusion imaging with echocardiogra- phy and electrocardiography for determination of left ventricular mass. Am J Cardiol. 1996;77:750–755.
8. Moore ML, Murphy PH, Burdine JA. ECG-gated emission computed tomography of the cardiac blood pool. Radiology. 1980;134:233–235.
9. Graf G, Mester J, Clausen M, et al. Reconstruction of Fourier coefficients: a fast method to get polar amplitude and phase images of gated SPECT. J Nucl Med. 1990;31:1856–1861.
10. Mochizuki T, Murase K, FuJiwara Y, et al. Assessment of systolic thickening with thallium-201 ECG-gated single-photon emission computed tomogra- phy: a parameter for local left ventricular function. J Nucl Med. 1991;32:
1496–1500.
11. DePuey EG, Nichols K, Dobrinsky C. Left ventricular ejection fraction assessed from gated technetium-99m-sestamibi SPECT. J Nucl Med.
1993;34:1871–1876.
12. Cooke CD, Garcia EV, Cullom SJ, et al. Determining the accuracy of calculating systolic wall thickening using a fast Fourier transform approxi- mation: a simulation study based on canine and patient data. J Nucl Med.
1994;35:1185–1192.
13. Adachi I, Sugioka Y, Tabuchi K, et al. Assessment of myocardial contraction and relaxation with99mTc-tetrofosmin multi-gated myocardial SPECT. Kaku Igaku. 1994;31:1453–1463.
14. Germano G, Kiat H, Kavanagh PB, et al. Automatic quantification of ejection fraction from gated myocardial perfusion SPECT. J Nucl Med.
1995;36:2138–2147.
15. Toba M, Kumita SI, Mizumura S, et al. Evaluation of left ventricular diastolic function using gated SPECT with 99mTc-MIBI. Kaku Igaku.
1996;33:409–413.
16. Snapper HJ, Shea NL, Konstam MA, et al. Combined analysis of resting regional wall thickening and stress perfusion with electrocardiographic- gated technetium-99m-labeled sestamibi single-photon emission computed tomography: prediction of stress defect reversibility. J Nucl Cardiol.
1997;4:3–10.
17. Suyihara H, Tamaki N, Nozawa M, et al. Assessment of left ventricular count increase with ECG-gated99mTc-MIBI SPECT using a single-head rotating gamma-camera. Kaku Igaku. 1994;31:1201–1208.
18. Shirakawa S, Hattori N, Tamaki N, et al. Assessment of left ventricular wall thickening with gated99mTc-MIBI SPECT—value of normal file. Kaku Igaku. 1995;32:643–650.
19. Bacharach SL, Green MV, Borer JS, et al. Left-ventricular peak ejection rate, filling rate, and ejection fraction frame rate requirements at rest and exercise: concise communication. J Nucl Med. 1979;20:189–193.
20. Gelberg HJ, Brundage BH, Glantz S, Parmley WW. Quantitative left ventricular wall motion analysis: a comparison of area, chord and radial methods. Circulation. 1979;59:991–1000.
21. Beyar R, Yin FC, Hausknecht M, et al. Dependence of left ventricular twist-radial shortening relation on cardiac cycle phase. Am J Physiol.
1989;257:1119–1126.
22. Buchalter MB, Weiss JL, Rogers WJ, et al. Noninvasive quantification on left ventricular rotational deformation in normal humans using magnetic resonance imaging myocardial tagging. Circulation. 1990;81:1236–1244.
23. Yun KL, Niczyporuk MA, Daughters GT 2nd, et al. Alterations in left ventricular diastolic twist mechanics during acute human cardiac allograft rejection. Circulation. 1991; 83:962–973.