Assessment of Left Ventricular Dyssynchrony using Gated Myocardial Perfusion SPECT in Cardiac Resynchronization Therapy
著者 中村 学
著者別表示 Nakamura Manabu journal or
publication title
博士論文本文Full 学位授与番号 13301乙第2108号
学位名 博士(保健学)
学位授与年月日 2019‑09‑26
URL http://hdl.handle.net/2297/00059274
Creative Commons : 表示 ‑ 非営利 ‑ 改変禁止 http://creativecommons.org/licenses/by‑nc‑nd/3.0/deed.ja
A S c i T e c h n o l J o u r n a l
Research Article
All articles published in International Journal of Cardiovascular Research are the property of SciTechnol, and is protected by
*Corresponding author: Masahisa Onoguchi, Department of Quantum Medical Technology, Graduate School of Medical Sciences, Kanazawa University, 5-11- 80 Kodatsuno, Kanazawa, Ishikawa, 920-0942, Japan, Tel: +81 76-265-2526;
E-mail: [email protected]
Received: April 03, 2018 Accepted: April 18, 2018 Published: April 23, 2018
Assessment of Left Ventricular Dyssynchrony using Gated Myocardial Perfusion SPECT in Cardiac Resynchronization Therapy
Manabu Nakamura
1,2*, Masahisa Onoguchi
2and Takayuki Shibutani
2Abstract
In cardiac resynchronization therapy (CRT), even if patient selection is made according to Japanese adaptive criteria, there are non-responders. Its main factor is considered to be the lack of adequate preoperative assessment against mechanical left ventricular dyssynchrony. Recently, phase analysis was enabled on gated myocardial perfusion SPECT (GMPS). The purpose of this study was to examine the relationship between the index of phase analysis using the two software (cardioREPO
®and QGS) and the left ventricular reverse remodeling index (ΔLVESV) for the evaluation of left ventricular dyssynchrony in CRT patients is there.
It also evaluated whether it could be an index of adaptation decision and effect determination.
Methods: For 15 patients with severe heart failure who underwent CRT, GMPS was performed before (baseline) and after CRT. In cardioREPO
®, standard deviation of the time to end systolic phase of 17 segments of the left ventricle (SDTES) and Bandwidth and Phase SD, Entropy of phase histogram were used as left ventricular dyssynchrony index. In QGS, standard deviation of the time to maximum displacement of each segment (SDTTMD) was used as an index. An example in which ΔLVESV (%Reduction) after 6 months of CRT decreased by 15% or more was defined as a CRT responder.
Results: 10 of 15 patients were responders. Bandwidth at baseline of the responder group was significantly higher. SDTES, Phase SD, Entropy and SDTTMD of the responder group tended to be higher.
All indexes decreased significantly in the responder group after 6 months of CRT but not in the non-responder group. Excluding SDTES, positive correlation was shown between baseline and ΔLVESV, and the optimal cutoff value of responder prediction was SDTES 7.637%, Bandwidth 218°, Phase SD 50.0°, Entropy 0.785, SDTTMD 19.85 ms.
Conclusion: Phase analysis by GMPS showed that quantitative assessment of left ventricular dyssynchrony of CRT was possible and that the index was related to response prediction to CRT. In particular, SDTTMD showed good correlation between baseline and ΔLVESV, suggesting that it may be a more sensitive index of reaction prediction.
Introduction
Cardiac resynchronization therapy (CRT) has become widespread as a treatment for drug resistant severe heart failure. However, CRT adaptation criteria most commonly used in Japan. Chronic heart failure of drug resistant New York Heart Association (NYHA) Class III · IV, left ventricular ejection fraction (LVEF) ≤ 35%, QRS width
≥ 120 msec [1], it is known that nonresponsive cases, so-called non-responders, are generated for CRT [2]. It was defined as a CRT responder with an improvement of NYHA class 1 or more in the chronic phase (3 to 6 months), an improvement of 10% or more of the maximum oxygen intake in the 6-minute walking distance or exercise stress test [3,4]. Yu et al. [5], However, showed that left ventricular volume and cardiac function improvement by echocardiography of CRT patients is a predictor of long-term survival, we concluded that a reduction of LV end-systolic volume (ΔLVESV) is the most sensitive, and it is best to predict heart failure by setting 10% of ΔLVESV cutoff value. At present it is standard to define CRT responder with ΔLVESV
≥ 10 to 15% after 3 to 6 months [5-7]. On the other hand, using the QRS width ≥ 120 msec as the adaptation criterion is based on the idea that if there is an electric left ventricular dyssynchrony, there is a deviation in contraction phase, so-called mechanical left ventricular dyssynchrony, There are a number of cases that there is no mechanical left ventricular dyssynchrony even if the QRS width is wide, and CRT effect is poor in such cases. As a cause of this, CRT treatment is corrected mechanically in the left ventricular dyssynchrony, and the lack of proper mechanical left ventricular dyssynchrony failure evaluation before the operation is considered to be the maximum factor. Despite these facts, in the current guidelines, there is no requirement for left ventricular dyssynchrony other than the QRS width. However, it has been pointed out that the QRS width is not a sufficient index in judging the effectiveness of CRT [8]. Recently, a new technique for evaluating left ventricular dyssynchrony was developed from gated myocardial perfusion SPECT (GMPS) as an evaluation method other than ECG by phase analysis. Chen et al. [9] and Henneman et al. [10] developed a count-based method to obtain phase information from the local left ventricular count change of the cardiac cycle on GMPS and developed quantitative index of left ventricular dyssynchrony (histogram bandwidth, phase SD, histogram skewness and histogram kurtosis) obtained from Emory Cardiac Toolbox™ software. Also, recently, Boogers et al. [11] compared the quantitative gated SPECT (QGS) phase analysis algorithm (histogram bandwidth, phase SD) with TDI using echocardiography on left ventricular dyssynchrony in order to verify the algorithm in CRT patients with severe heart failure and the prediction of the therapeutic effect of CRT was also evaluated. Also, at cardioGRAF (Nippon Medical College 2
ndHospital/Yamamoto, FUJIFILM RI Pharma Co., Ltd.) [12], local volumetric curve differential analysis software, Keida et al. [13] tried quantitative evaluation of left
Keywords
Left ventricular dyssynchrony; Gated myocardial perfusion SPECT;
Cardiac resynchronization therapy; Left ventricular reverse remodeling; Standard deviation of the time to end systolic phase;
Bandwidth; Phase SD; Entropy; Standard deviation of the time to
maximum displacement
Citation: Nakamura M, Onoguchi M, Shibutani T (2018) Assessment of Left Ventricular Dyssynchrony using Gated Myocardial Perfusion SPECT in Cardiac Resynchronization Therapy. Int J Cardiovasc Res 7:2.
doi: 10.4172/2324-8602.1000358
• Page 2 of 7 • Volume 7 • Issue 2 • 1000358
ventricular dyssynchrony in CRT patients by phase analysis from left ventricular local volume curves. However, the evaluation method of left ventricular dyssynchrony using GMPS has just begun, and the most effective measurement method and criteria for diagnosis of dyssynchrony or prediction of effect of CRT have not been established.
In addition, the usefulness of left ventricular dyssynchrony evaluation by phase analysis using QGS software of CRT patients has not yet been clarified. In this study, we focused on the left ventricular local wall motion change in the phase analysis algorithm newly enabled by QGS 2007 (Cedars-Sinai Medical Center/Germano) [14], and tried to evaluate the left ventricular dyssynchrony from the index. In addition, in July 2014, in collaboration with Professor Kenichi Nakajima of Kanazawa University and EXINI Diagnostics Inc. of Sweden and Fuji Film RI Pharma Corporation cardioREPO
®(Fuji Film RI Pharma Co., Ltd./EXINI Diagnostics Inc.) [15], a myocardial blood flow analysis software, was newly released. Therefore, using the cardioREPO
®and QGS program, we examined the relationship between indices of dyssynchrony and indices of left ventricular reverse remodeling (ΔLVESV) for assessment of left ventricular dyssynchrony in CRT patients. It was also evaluated whether it could be an index of its adaptation decision and effect determination.
Materials and Methods Population and protocol
The subjects were 20 consecutive patients who underwent CRT according to the adaptation criteria in the Japanese guidelines (chronic heart failure of drug resistant NYHA class III · IV, LVEF ≤ 35%, QRS width ≥ 120 msec), of which 20 patients with perfusion defect 15 patients excluding 5 patients of ischemic cardiomyopathy.
GMPS with
99mTc-sestamibi (MIBI) was performed before CRT and 6 months later, phase analysis was performed with cardioREPO
®and QGS, and left ventricular dyssynchrony was evaluated. At the same time, plasma B type natriuretic peptide (BNP) concentration was measured by enzyme immunoassay as an evaluation of heart failure. In addition, a case where the decrease of the left ventricular end systolic volume (ΔLVESV) obtained by QGS remained below 15% by GMPS re-examination after 6 months of CRT was defined as non-responder [16-18]. This study was approved by the local Ethics Review Committee (No. 0170223-11).
Equipment and acquisition
GMPS imaging with
99mTc-MIBI (740 MBq, rest administration) was performed with a 2 head SPECT camera system (Vertex Plus:
PHILIPS/ADAC Laboratories, Bothell, Washington, USA) with a low energy general purpose collimator. Acquisition was carried out at 180
°by dividing the R - R interval into 16 using energy window width ± 10% at 140 keV for
99mTc. A total of 32 projection data (step & shoot mode, 50 sec/projection, acquisition time approximately 14 min) was obtained with a pixel size of 4.74 mm, a matrix of 128 × 128, and a zoom of 1.00. Data was reconstructed by filtered back projection method using ramp filter with Butterworth filter (order 10, cut off frequency 0.30 cycles/pixel) for the pre-processing. Using the gated short axis images, phase analysis was performed with cardioREPO
®and QGS.
Analysis and evaluation
Phase analysis of cardioREPO
®based on the idea that increases the count when the wall thickness increases with the myocardial wall contraction due to the “partial volume effect” and the count decreases
when it is expanded, Fourier analysis is performed the count change per pixel per cardiac cycle to identify the end-systolic phase. The phase is the first time phase to the end-systolic phase of the R-R division.
The local wall thickness change rate data of each phase obtained was divided into local wall thickness change rate data of 17 segments by the left ventricular section of American Heart Association (AHA) [19].
From that, time to end systole of each segment (time to end systole:
TES) was measured. Standard deviation (Standard Deviation of TES:
SDTES), which is a variation in the whole segment, was calculated and used as an index of left ventricular dyssynchrony.
SDTES(%)=SD of all 17 TESs/R-R interval (time) × 100
Also, from the histogram showing the frequency of the end systolic phase in one cardiac cycle, Bandwidth which is 95% phase width of the histogram, Phase SD which is the standard deviation of the histogram and Entropy which is the index showing the degree of synchronization are calculated, it was used as a left ventricular dyssynchrony index. In QGS, the phase in the local left ventricular wall motion change of the cardiac cycle is an index of left ventricular synchrony. It divided the three-dimensional left ventricular myocardial wall into 17 segments by the left ventricular segment of AHA, and found the local wall motion curves at the center of the myocardial wall in each segment.
Based on the position in the R wave on the electrocardiogram as the base point, the time to the so-called end systole, which is displaced to the center of the left ventricle (time to maximum displacement:
TTMD), was measured. The standard deviation in all the segments (standard deviation of TTMD: SDTTMD) was calculated and used as an index of left ventricular dyssynchrony.
SDTTMD (ms) = SD of all 17 TTMDs/R-R interval (time) × 100 Statistical analysis
Baseline characteristics showed continuous data as mean ± standard deviation. For data comparison, Mann- Whitney’s U test was used for two groups of unpaired tests, and the Wilcoxon signed- rank test was used for the tests of two groups with correspondence.
Spearman’s rank correlation coefficient was used for the relationship between baseline left ventricular dyssynchrony index (SDTES, Bandwidth, Phase SD and SDTTMD) and ΔLVESV. The optimal cutoff value of each index of left ventricular dyssynchrony was determined from receiver-operating-characteristic (ROC) curve analysis to predict CRT response. A value at which the average value of the sensitivity and the specificity becomes the maximum is set as the optimal cutoff value for predicting the response to CRT. For all analyzes, p value <0.05 was considered to be statistically significant.
Results
Baseline characteristics of study population
Baseline characteristics of the 15 patients (12 men; mean age, 68 ± 6 y) is shown in Table 1. All of the causes of heart failure were idiopathic dilated cardiomyopathy. Left ventricular end-diastolic volume was 308 ± 138 mL, LVEF was 22 ± 8%, and all cases were severe heart failure (average NYHA class 3.3 ± 0.6) by QGS analysis before CRT.
Clinical responders and non-responders
After the 6 months follow-up, ΔLVESV was 38 ± 23% on average,
and assuming ΔLVESV ≥ 15% as CRT responder [16-18] there were
10 responders (67%) and 5 non-responders (33%). Table 2 shows
whereas non-responder indexes showed no obvious improvements (Table 3). BNP level decreased significantly (P<0.005) from baseline 477 ± 292 pg/mL in responder to 156 ± 150 pg/mL after 6 months but from 312 ± 204 pg/mL to 322 ± 216 pg /mL in non-responder I did not see any change. SDTES by cardioREPO
®decreased significantly (P<0.005) from baseline 10.9 ± 4.7% to 7.1 ± 4.3%
after 6 months in responder, but from 8.0 ± 2.2% to 8.4 ± 5.2%
in non-responder I did not see any change. Bandwidth decreased significantly (P<0.05) from baseline 237.2 ± 62.7° to 131.5 ± 76.6
°in responder but was not significantly changed from 159.4 ± 63.4°
to 155.2 ± 70.5
°in non-responder. Phase SD decreased significantly (P<0.05) from baseline 54.3 ± 13.2
°to 6.3 months to 33.9 ± 16.5
°in responder, but was not significantly changed from 38.6 ± 13.5°
to 37.0 ± 15.3° in non-responder. Entropy decreased significantly (P<0.05) from baseline 0.815 ± 0.053° to 0.704 ± 0.105° after 6 months in responder, but was not significantly changed from 0.711
± 0.101
°to 0.730 ± 0.089
°in non-responder. On the other hand, the change of SDTTMD by QGS decreased significantly (P<0.05) from baseline 19.2 ± 7.9 ms to 12.7 ± 7.8 ms after 6 months in responder but from 11.6 ± 5.5 ms to 11.9 ± 2.5 ms in non-responder at baseline was not so high and no significant change was noted. In order to predict the response of CRT, Fig. 1 to 5 show changes in the left ventricular dyssynchrony index from the baseline, and the optimal cutoff value was determined from ROC curve analysis.
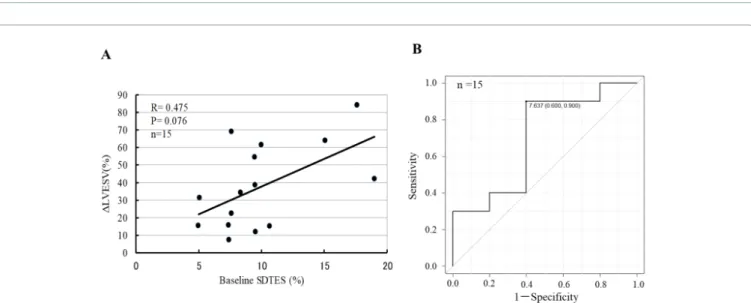
The relationship between baseline SDTES and ΔLVESV after 6 months was not significantly correlated with R=0.475 and P=0.076 (Figure 1A). The area under the curve (AUC) was 0.7 from the ROC curve, and the optimal cutoff value for predicting CRT responder was 7.64% (sensitivity 90%, specificity 60%) (Figure 1B). The relationship between baseline Bandwidth and ΔLVESV after 6 months showed a positive correlation trend with R=0.513, P=0.05 (Figure 2A). The optimal cutoff value for predicting the CRT responder from the ROC curve was 218° (AUC 0.82, sensitivity comparison of baseline characteristics and imaging variables at
baseline of responder and non-responder. NYHA class (3.2 ± 0.4 vs.
2.7 ± 0.3), QRS width (174.7 ± 32.8 ms vs. 146.8 ± 21.5 ms), LVEDV (353.5 ± 149.5 mL vs. 215.8 ± 27.1 mL), LVESV (293 ± 144.7 mL vs.
159.2 ± 22.4 mL), Bandwidth (237.2 ± 62.7° vs. 159.4 ± 63.4°) between baseline responder and non-responder and the responder was high significantly (P<0.05). Phase SD (54.3 ± 13.2° vs. 38.6 ± 13.5
°, P=0.055), Entropy (0.815 ± 0.053
°vs. 0.711 ± 0.101°, P=0.075), SDTTMD (19.2
± 7.3 ms vs. 11.6 ± 5.5 ms, P=0.075) were no statistically significant difference, but the responder tended to be higher.
Baseline and 6 months follow-up data
The ΔLVESV, which is an index of the therapeutic effect of CRT, was 50.1 ± 20.4% for responder and 12.9 ± 3.6% for non-responder, and the responder was significantly high (P<0.001). In the 6-month follow-up, responders showed obvious improvements in all indexes,
Data at represented as mean±SD or number, with percentages in parentheses NYHA: New York Heart Association; LVEDV: Left Ventricular End Diastolic Volume; LVESV: Left Ventricular End Systolic Volume; LVEF: Left Ventricular Ejection Fraction.
Table 1: Baseline Characteristics of Study Population.
Baseline characteristic Data
Age(Years) 68±6
Sex(M/F) 12/3
Idiopathic dilated cardiomyopathy 15 (100%)
NYHA functional class 3.0±0.4
QRS duration (ms) 165±32
LV function by QGS parameters
LVEDV(mL) 308±138
LVESV(mL) 248±136
LVEF(%) 22±8
BNP(pg/mL) 422±271
Data are represented as meat±SD or number
NYHA: New York Heart Association; LVESV: Left Ventricular End Diastolic Volume; LVESV: Left Ventricular End
Systolic Volume; LVEF: Left Ventricular Ejection Fraction; SDTES: Standard Deviation of Time to End Systole; SDTTMD: Standard Deviation of Time to Maximum Displacement
Table 2: Baseline Characteristics of Clinical Responders and Non-responders.
Baseline characteristic Responders (n=10) Non-responders (n=5) P
Age(Years) 68±6.5 67±6.4 NS
Sex(M/F) 9/1 3/2
Clinical evaluation
NYHA functional class 32±0.4 2.7±0.3 < 0.05
QRS duration(ms) 174.7 ± 32.8 146.8±21.5 < 0.05
BNP(pg/mL) 477±292 312±204 NS
LV function by QGS parameter&
LV EDV(mL) 353.5±149.5 215.8±27.1 < 0.05
LV ESV(mL) 293±144.7 159.2±22.4 < 0.005
LV EF(%) 19.2±7.9 26.2±6.8 NS
PhaseÝistribution
SDT ES(%) 10.9±4.7 8.0±2.2 NS
Bandwidth(
°) 237.2±62.7 159.4±63.4 < 0.05
Phase SD( ° ) 54.3±13.2 38.6±13.5 0.055
Entropy(°) 0.815±0.053 0.711±0.101 0.075
SDTTMD(ms) 19.2±7.3 11.6±5.5 0.075
*P<0.05 follow-up vs. baseline
Data are represented as mean±SD or number NS: Not Significant; other abbreviations as in Table 2.
Table 3: Baseline and 6 Months Follow-up Characteristics: Responders Versus Non-responders.
Characteristic Responders
(n=10) Non-responders (n=5)
ΔLVESV(mL) 50.1±20.4 12.9±3.6 < 0.001
BNP(pg/mL)
Baseline 477±292 312±204 NS
Follow-up 156±150* 322±216 NS
SDTES(%)
Baseline 10.9±4.7 8.0±2.2 NS
Follow-up 7.1±4.3* 8.4±5.2 NS
Bandwidth(°)
Baseline 237.2±62.7 159.4±63.4 < 0.05
Follow-up 131.5 ±76.6* 155.2±70.5 NS
Phase SD(°)
Baseline 54.3±13.2 38.6±13.5 0.055
Follow-up 33.9±16.5* 37.0±15.3 NS
Entropy(°)
Baseline 0.815±0.053 0.711±0.101 0.075
Follow-up 0.704±0.105* 0.730±0.089 NS
SDTTMD(ms)
Baseline 19.2±7.3 11.6±5.5 0.075
Follow-up 12.7±7.8* 11.9±2.5 NS
Citation: Nakamura M, Onoguchi M, Shibutani T (2018) Assessment of Left Ventricular Dyssynchrony using Gated Myocardial Perfusion SPECT in Cardiac Resynchronization Therapy. Int J Cardiovasc Res 7:2.
doi: 10.4172/2324-8602.1000358
• Page 4 of 7 • Volume 7 • Issue 2 • 1000358
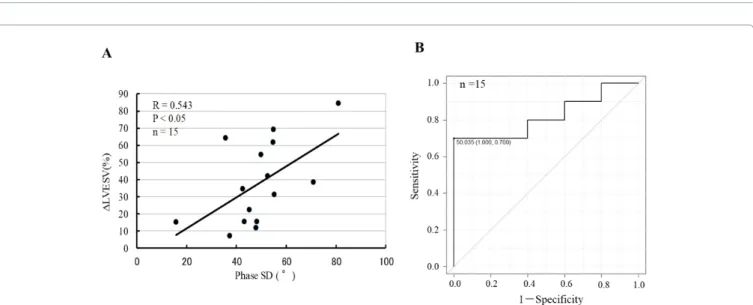
70%, specificity 80%) (Figure 2B). The relationship between baseline Phase SD and ΔLVESV after 6 months showed a significant positive correlation with R=0.543, P<0.05 (Figure 3A). The optimal cutoff value for predicting the CRT responder from the ROC curve was 50.0° (AUC 0.82, sensitivity 70%, specificity 100%) (Figure 3B).
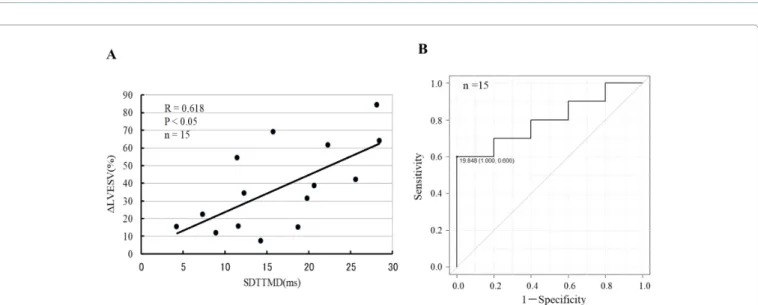
The relationship between baseline Entropy and ΔLVESV after 6 months showed a significant positive correlation with R=0.539, P<0.05 (Figure 4A). The optimal cutoff value for predicting the CRT responder from the ROC curve was 0.785° (AUC 0.80, sensitivity 70%, specificity 60%) (Figure 4B). On the other hand, the relationship between baseline SDTTMD and ΔLVESV after 6 months showed a significant positive correlation with R=0.618, P<0.05 (Figure 5A). The optimal cutoff value for predicting the CRT responder from the ROC curve was 19.85 ms (area under the curve 0.80, sensitivity 60%, specificity 100%) (Figure 5B).
Discussion
In the present study, left ventricular dyssynchrony was evaluated by phase analysis based on local myocardial counts and wall motion changes using GMPS. It showed that it is related to the clinical effect on CRT. In baseline, responder group was significantly high in left ventricular volume, NYHA class and Bandwidth which is indicative of left ventricular dyssynchrony in cardioREPO
®. In the left ventricular dyssynchrony index in SDTES, Phase SD, Entropy and SDTTMD, the responder group tended to be high. Changes from the baseline of left ventricular dyssynchrony index in cardioREPO
®significantly decreased in the responder group after 6 months in all indices, but not significantly in the non-responder group. There was a positive correlation between the baseline and ΔLVESV with the index excluding SDTES, and the optimal cutoff values for predicting the responder were SDTES 7.637%, Bandwidth 218°, Phase SD
Figure 1: (A) Relations with baseline SDTES and ΔLVESV 6 months follow-up did not accept a meaningful correlation in R=0.475, P=0.076. (B) ROC curve analysis for SDTES showed predictive value (AUC, 0.7) of response to CRT. Optimal cutoff value was defined at 7.64%, yielding sensitivity of 90%
and specificity of 60%.
Figure 2: (A) Relations with baseline Bandwidth and ΔLVESV of 6 months follow-up showed a positive correlative tendency with R=0.513, P=0.05. (B) ROC
curve analysis for Bandwidth showed good predictive value (AUC, 0.82) of response to CRT. Optimal cutoff value was defined at 218 degrees, yielding
sensitivity of 70% and specificity of 80%.
Figure 3: (A) Relations with baseline Phase SD and ΔLVESV of 6 months follow-up showed meaningful positive correlation with R=0.543, P<0.05. (B) ROC curve analysis for Phase SD showed good predictive value (AUC, 0.82) of response to CRT. Optimal cutoff value was defined at 50.0 degrees, yielding sensitivity of 70% and specificity of 100%.
Figure 4: (A) Relations with baseline Entropy and ΔLVESV of 6 months follow-up showed meaningful positive correlation with R=0.539, P<0.05. (B) ROC curve analysis for Entropy showed good predictive value (AUC, 0.80) of response to CRT. Optimal cutoff value was defined at 0.785, yielding sensitivity of 70% and specificity of 60%.
50.0°, Entropy 0.785°. On the other hand, although SDTTMD by QGS decreased significantly in the responder group after 6 months, the non-responder group was not so high in baseline and did not change after 6 months. There was a good positive correlation of the correlation coefficient 0.62 between the baseline and ΔLVESV, and the optimal cutoff value for predicting the responder was 19.85 ms. In addition, the positive correlation between the baseline of the index except SDTES and ΔLVESV was considered to suggest that CRT is effective in the patient showing a high value at baseline. Studies on ventricular dyssynchrony using nuclear medicine have been put to practical use since the early 1980’s for the purpose of evaluating mutual dyssynchrony between ventricles [20-22]. Fauchier et al.
[23] used equilibrium RI angiography and Fourier phase analysis to evaluate the prognostic index of ventricular and intraventricular dyssynchrony in 103 patients with idiopathic dilated cardiomyopathy.
Interventricular dyssynchrony was evaluated by the difference in the average phase angle between the left ventricle and right ventricle,
and intraventricular dyssynchrony was evaluated with the standard
deviation of the average phase angle in each ventricle. A large cardiac
event (cardiac death of 7 patients, 11 patients of deterioration leading
to heart transplantation) occurred in 18 patients during the follow-up
period of 27 ± 23 months, multivariate analysis on 13 factors of cardiac
event prediction caused left ventricular dyssynchrony It was shown
to be the only independent predictor of cardiac events. In recent
years, a new technique has been developed to evaluate left ventricular
dyssynchrony by phase analysis on GMPS. Chen et al. [9] developed
a count-based method to obtain phase information from the local left
ventricular count change of the cardiac cycle on GMPS. The phase
information is related to the end of the local mechanical systole of
the LV and provides information on the synchronicity of the LV
systole. Then, the normal range of the quantitative index (histogram
bandwidth, phase SD, histogram skewness and histogram kurtosis)
of left ventricular dyssynchrony obtained from Emory Cardiac
Toolbox™ (ECTb) software was evaluated in 90 normal subjects. In
Citation: Nakamura M, Onoguchi M, Shibutani T (2018) Assessment of Left Ventricular Dyssynchrony using Gated Myocardial Perfusion SPECT in Cardiac Resynchronization Therapy. Int J Cardiovasc Res 7:2.
doi: 10.4172/2324-8602.1000358
• Page 6 of 7 • Volume 7 • Issue 2 • 1000358
addition, Henneman et al. [10] compared these four GMPS indexes with left ventricular dyssynchrony index by TDI in 75 heart failure patients. Among the four quantitative indices of phase analysis, it was shown that the index of Histogram Bandwidth and Phase SD correlated most with TDI index of left ventricular dyssynchrony. The count base method was fully automated, and it was shown that high reproducibility can be obtained. The method can also be applied to cases where the perfusion is highly reduced, and information on the left ventricular dyssynchrony can be obtained from GMPS data which can simultaneously evaluate cardiac function and perfusion [24]. In addition, Henneman et al. [25] evaluated whether it is possible to predict the therapeutic effect of CRT according to the degree of left ventricular dyssynchrony evaluated by GMPS in 42 patients who underwent CRT with severe heart failure. In the prediction of the therapeutic effect of CRT, the sensitivity and specificity of histogram bandwidth (optimal cutoff value: 135°) is 70% and the sensitivity and specificity of phase SD (optimum cutoff value: 43°) is 74% it was obtained. In 40 patients who were scheduled to implant CRT with drug resistant heart failure, Boogers et al. [11] compared echocardiography using TDI to verify the QGS phase analysis algorithm for left ventricular dyssynchrony assessment, the effect prediction was also evaluated. The index of left ventricular dyssynchrony by QGS phase analysis correlated significantly with that of TDI, and high diagnostic accuracy was obtained by Histogram Bandwidth (Optimum cutoff value: 72.5°) and Phase SD (Optimum cutoff value: 19.6°) in CRT effect prediction. In addition, Fereydoon et al. [26] evaluated left ventricular dyssynchrony in GMPS and TDI in 31 patients with severe heart failure (EF ≤ 35%), and compared GMPS software QGS and ECTb in the same patients.
QGS and ECTb showed good correlation with histogram bandwidth and phase SD which is index of left ventricular dyssynchrony, but QGS showed lower value than ECTb. This was thought to be due to the difference between the quantitative and sampling methods of both. Although correlation was found only with QGS with TDI, it reported that only good correlation was found with entropy. The limit of this study is that it consists of populations with few subjects, in order to determine better left ventricular dyssynchrony index better predictive of CRT effect and to obtain optimal cutoff value of left ventricular dyssynchrony indices should be examined in more
populations, including typical non-responder patients. In addition, the time resolution of gated SPECT is said to be relatively lower than that of echocardiography. However, by curve fitting by Fourier transformation, artifacts with low temporal resolution are expected to be significantly reduced. Recently, perfusion defect and the existence of scar tissue and its effect on the therapeutic effect of CRT have been reported [27-33]. However, our research purpose is to evaluate whether the left ventricular dyssynchrony due to the phase analysis by the rate of change in local wall thickness and the wall motion change can be an index of the therapeutic effect of CRT, so in our GMPS excluded examples of blood flow deficits that are a drawback in the evaluation from this study. However, other diagnostic imaging methods also have major disadvantages, and MRI is unsuitable for CRT patients. TDI and STE by echocardiography are highly dependent on the surgeon and there is no optimum acoustic window in 20% of patients. Furthermore, phase analysis by GMPS is a great advantage that simultaneous evaluation of left heart function, perfusion and dyssynchrony is possible. This information may be useful for CRT adaptation decisions.
Conclusions
Phase analysis of cardioREPO
®and QGS on GMPS showed that quantitative evaluation of left ventricular dyssynchrony in CRT patients was possible and that the left ventricular dyssynchrony index was related to prediction of response to CRT. In particular, SDTTMD obtained from QGS shows a good correlation between baseline and ΔLVESV, suggesting that it may be a more sensitive index for predicting response to CRT. In this study, verification with more population including non-responder patients is necessary.
Acknowledgements
The authors would like to thank Dr Itsuro Morishima of Cardiology and Radiologist Fumihiko Niwa, Ogaki Municipal Hospital, who provided data.
References
1. Japanese Circulation Society (2011) Guidelines for non-pharmacotherapy of cardiac arrhythmias. Circulation J 77: 249-274.
2. Birnie DH, Tang AS (2006) The problem of non-response to cardiac resynchronization therapy. Curr Opin Cardiol 21: 20-26.
Figure 5: (A) Relations with baseline SDTTMD and ΔLVESV of 6 months follow-up showed meaningful positive correlation with R=0.618, P<0.05. (B) ROC
curve analysis for Entropy showed good predictive value (AUC, 0.80) of response to CRT. Optimal cutoff value was defined at 19.85 ms, yielding sensitivity
of 60% and specificity of 100%.
3. Alonso C, Leclercq C, Victor F, Mansour H, Place C (1999) Electrocardiographic predictive factors of long-term clinical improvement with multisite biventricular pacing in advanced heart failure. Am J Cardiol 84:1417-1421.
4. Molhoek SG, Bax JJ, Erven L, Bootsma M, Boersma E, et al. (2004) Comparison of benefits from cardiac resynchronization therapy in patients with ischemic cardiomyopathy versus idiopathic dilated cardiomyopathy. Am J Cardiol 93: 860-863.
5. Yu CM, Bleeker GB, Fung JWH, Schalij MJ, Zhang Q, et al. (2005) Left ventricular reverse remodeling but not clinical improvement predicts long- term survival after cardiac resynchronization therapy. Circulation 112: 1580- 1586.
6. Yu CM, Fung JW, Zhang Q, Chan CK, Chan YS, et al. (2004) Tissue Doppler imaging is superior to strain rate imaging and postsystolic shortening on the prediction of reverse remodeling in both ischemic and nonischemic heart failure after cardiac resynchronization therapy. Circulation 110: 66-73.
7. Bax JJ, Abraham T, Barold SS, Breithardt OA, Fung JW, et al. (2005) Cardiac Resynchronization Therapy: Part 1-Issues Before Device Implantation. J Am Coll Cardiol 46: 2153-2167.
8. Kass, David A (2003) Predicting cardiac resynchronization response by QRS duration. J Am Coll Cardiol 42: 2125-2127.
9. Chen J, Garcia EV, Folks RD, Cooke CD, Faber TL, et al. (2005) Onset of left ventricular mechanical contraction as determined by phase analysis of ECG- gated myocardial perfusion SPECT imaging: development of a diagnostic tool for assessment of cardiac mechanical dyssynchrony. J Nucl Cardiol 12:
687-695.
10. Henneman MM, Chen J, Ypenburg C, Dibbets P, Bleeker GB, et al. (2007) Phase analysis of gated myocardial perfusion single-photon emission computed tomography compared with tissue Doppler imaging for the assessment of left ventricular dyssynchrony. J Am Coll Cardio 49: 1708-1714.
11. Boogers MM, Van Kriekinge SD, Henneman MM, Ypenburg C, Van Bommel RJ, et al. (2009) Quantitative gated SPECT–derived phase analysis on gated myocardial perfusion SPECT detects left ventricular dyssynchrony and predicts response to cardiac resynchronization therapy. J Nucl Med 50: 718- 725.
12. Takahashi N, Yamamoto A, Tezuka S, Ishikawa M, Abe J, et al. (2008) Assessment of left ventricular dyssynchrony during development of heart failure by a novel program using ECG-gated myocardial perfusion SPECT.
Circ J 72: 370-377.
13. Keida T, Ohira H, Fujita M, Chinen T, Nakamura K, et al. (2009) Quantitative assessment of dyssynchrony using ECG-gated SPECT myocardial perfusion imaging prior to and following cardiac resynchronization therapy. Circ J 73:
1550-1553.
14. Germano G, Kavanagh PB, Slomka PJ, Van Kriekinge SD, Pollard G, et al.
(2007) Quantitation in gated perfusion SPECT imaging: the Cedars-Sinai approach. J Nucl Cardiol 14.4: 433-454.
15. Nakajima K, Okuda K, Nyström K, Richter J, Minarik D, et al. (2013) Improved quantification of small hearts for gated myocardial perfusion imaging.
European journal of nuclear medicine and molecular imaging 40: 1163-1170.
16. Stellbrink C, Breithardt OA, Franke A, Sack S, Bakker P, et al. (2001) Impact of cardiac resynchronization therapy using hemodynamically optimized pacing on left ventricular remodeling in patients with congestive heart failure and ventricular conduction disturbances1. J Am Coll Cardiol 38: 1957-1965.
17. Pitzalis MV, Iacoviello M, Romito R, Massari F, Rizzon B, et al. (2002) Cardiac resynchronization therapy tailored by echocardiographic evaluation of ventricular asynchrony. J Am Coll Cardiol 40: 1615-1622.
18. Yu CM, Fung WH, Lin H, Zhang Q, Sanderson JE, et al. (2003) Predictors of left ventricular reverse remodeling after cardiac resynchronization therapy for heart failure secondary to idiopathic dilated or ischemic cardiomyopathy. Am J Cardiol 91: 684-688.
19. Cerqueira MD, Weissman NJ, Dilsizian V, Jacobs AK, Kaul S, et al. (2002) Standardized myocardial segmentation and nomenclature for tomographic imaging of the heart: a statement for healthcare professionals from the Cardiac Imaging Committee of the Council on Clinical Cardiology of the American Heart Association. Circulation 105: 539-542.
20. Frais MA, Botvinick EH, Shosa DW, O’Connell WJ, Scheinman MM, et al.
(1982) Phase image characterization of ventricular contraction in left and right bundle branch block. Am J Cardiol 50: 95-105.
21. Frais MA, Botvinick EH, Shosa DW, O’Connell WJ, Alvarez JP, et al. (1984) Phase image characterization of localized and generalized left ventricular contraction abnormalities. J Am Coll Cardiol 4: 987-998.
22. Kerwin WF, Botvinick EH, O’Connell JW, Merrick SH, DeMarco T, et al.
(2000) Ventricular contraction abnormalities in dilated cardiomyopathy: effect of biventricular pacing to correct interventr icular dyssynchrony. J Am Coll Cardiol 35: 1221-1227.
23. Fauchier L, Marie O, Casset-Senon D, Babuty D, Cosnay P, et al. (2002) Interventricular and intraventricular dyssynchrony in idiopathic dilated cardiomyopathy: a prognostic study with Fourier phase analysis of radionuclide angioscintigraphy. J Am Coll Cardiol 40: 2022-2030.
24. Cooke CD, Garcia EV, Cullom SJ, Faber TL, Pettigrew RI (1994) Determining the accuracy of calculating systolic wall thickening using a fast Fourier transform approximation: a simulation study based on canine and patient data. J Nucl Med 35: 1185-1192.
25. Henneman MM, Chen J, Dibbets-Schneider P, Stokkel MP, Bleeker GB, et al. (2007) Can LV dyssynchrony as assessed with phase analysis on gated myocardial perfusion SPECT predict response to CRT?. J Nucl Med 48:
1104-1111.
26. Rastgou F, Shojaeifard M, Amin A, Ghaedian T, Firoozabadi H, et al. (2014) Assessment of left ventricular mechanical dyssynchrony by phase analysis of gated-SPECT myocardial perfusion imaging and tissue Doppler imaging:
Comparison between QGS and ECTb software packages. J Nuc Cardiol 21:
1062-1071.
27. Ypenburg C, Schalij MJ, Bleeker GB, Steendijk P, Boersma E, et al. (2006) Impact of viability and scar tissue on response to cardiac resynchronization therapy in ischaemic heart failure patients. Eur Heart J 28: 33-41.
28. Adelstein EC, Saba S (2007) Scar burden by myocardial perfusion imaging predicts echocardiographic response to cardiac resynchronization therapy in ischemic cardiomyopathy. Am Heart J 153: 105-112.
29. Morishima I, Okumura K, Tsuboi H, Morita Y, Takagi K, et al. (2016) Impact of basal inferolateral scar burden determined by automatic analysis of 99mTc- MIBI myocardial perfusion SPECT on the long-term prognosis of cardiac resynchronization therapy. Europace 9: 573-580.
30. Žižek 1, Cvijić M, Ležaić L, Salobir BG, Zupan I (2013) Impact of myocardial viability assessed by myocardial perfusion imaging on ventricular tachyarrhythmias in cardiac resynchronization therapy. J Nucl Cardiol 20:
1049-1059.
31. Ludwig DR, Friehling M, Schelbert EB, Schwartzman D (2014) Impact of scar on SPECT assay of left ventricular contraction dyssynchrony. Eur J Nucl Med Mol imaging 41: 529-535.
32. Sciagrà R, Giaccardi M, Porciani MC, Colella A, Michelucci A, et al. (2004) Myocardial perfusion imaging using gated SPECT in heart failure patients undergoing cardiac resynchronization therapy. J Nucl Med 45: 164-168.
33. Hou PN, Tsai SC, Lin WY, Cheng CM, Chiang KF, et al. (2015) Relationship of quantitative parameters of myocardial perfusion SPECT and ventricular arrhythmia in patients receiving cardiac resynchronization therapy. Ann Nucl Med 29: 772-778.
Author Affiliations Top
1
Department of Medical Examination, Ogaki Munitipal Hospital, Ogaki, Japan
2