1. Introduction
A vast amount of research on relationship banking or relationship lending accumulated since the 1990s shows the importance of this business model (e. g., positive impact on lending) . For example, Boot (2000) , who is known for corporate finance research, argues that rela- tionship banking is actually the best approach to solving information asymmetry. In Ja- pan, specific action items for regional financial institutions were laid out in the “Action Program Concerning the Enhancement of Relationship Banking Functions”, which was re- leased by the Financial Services Agency in March 2003. The purpose of the program was to enhance the function of relationship banking.
Lending through relationship banking as a business model has also generated research interest among academics in China in recent years. For example, He (2010) used World Bankʼs 2003 survey data on 2,400 companies to show that as interest rate lowered and the number of banks with which these companies do business with increases, the length of business relationship with a particular bank does not significantly affect the lending terms. He (2013) also showed that a stronger relationship reduced the collateral cost at the time of obtaining a loan. In addition, Tang (2011, 2012) conducted an empirical analysis on relationship banking based on the data collected on small and medium-sized enterprises (SMEs) located mainly in three regions, namely, Ningbo, Shaoxing, Jiaxing/Jiashan, and Huzhou, where textile industry clusters in Zhejiang Province are situated. His research showed that dealing with a smaller number of banks and cultivating a long term relation- ship with them had the positive effect of reducing the level of financial constraints on the borrowing parties. He also demonstrated the tendency that as the relationship between
Cheng Tang
Relationship Lending and the Role of Loan Officers in China:
Empirical Analysis Based on the Data on Companies in Industrial Clusters
1. Introduction 2. Previous Studies
3. Hypotheses and Descriptive Analysis of the Data 4. Estimation Results
5. Conclusion
borrowing industry and the lending banks grew closer and the possibility for more inti- mate relationship lending in terms of financing for SMEs within industry clusters increas- es, the terms and conditions under which the borrowers conducted business with the banks (e. g., collateral) improved.
Previous studies on the benefit of relationship lending in China often focus on the im- pact on lowered interest rate, reduced funding constraints, and the availability of funding.
As a result, these analyses tend to affirm theoretically expected benefits, that is, the effec- tiveness of relationship lending, such as reduced information asymmetry, attributed to soft information that lenders obtain through their close relationship with borrowers.
However, while relationship lending is a lending behavior in which loan decisions are made based on soft information that the financial institution has accumulated on borrow- ers, it is also important to explore who generates and accumulates such information and in what ways. Muramoto (2010) points out that soft information is generated more by individ- uals than by organizations and accumulated by loan officers in many cases. Xu (2010) showed that the financing for SMEs by commercial banks is generally broken down into five stages: accepting the loan application, researching, screening, approving, and financ- ing. It is conceivable that loan officers play an important role in producing and accumulat- ing soft information during these processes.
1)However, even though the importance of loan officerʼs role was recognized, to date, no one has demonstrated this empirically.
Thus, using a survey conducted among SMEs located in the apparel industry clusters in the Zhejiang and Jiangsu provinces, this paper demonstrates empirically whether loan of- ficers are playing a role in producing soft information under relationship lending in China and sheds light on our understanding of the role of loan officer in concrete terms.
2)There are two critical issues this paper hopes to address. First, what is the actual financing be- havior of loan officers and whether they are playing an important role as generators of soft information on companies. Second, once we establish that loan officers are important and the soft information they generate actually has a positive effect on relationship lending, then we can say that relationship lending has its merit.
With these two objectives in mind, I will review previous studies on loan officers in Sec- tion 2 to show that this paper is the first empirical study on China. In Section 3, I will pro- pose two hypotheses for the empirical study, provide an overview of the individual compa- ny data used in this paper, and analyze independent variables and descriptive statistics.
In Section 4, I will conduct empirical analyses on those two hypotheses to explain the role of loan officers in China. Finally, I will summarize the main findings of this paper in Sec- tion 5 and describe future research tasks.
1 ) The role of loan officers was also verified in the interview that we conducted with S City commercial bank in January 2016.
2 ) This type of analysis method is based on Uchida, Udell, and Yamori (2012).
2. Previous Studies
Of the few previous studies on the role of loan officers, Scott (2006) suggests that financ- ing could worsen when the loan officer changes. Garica-Appendini (2007) pointed out that soft information becomes critical when bank and company have a close business relation- ship. Based on the importance of using soft information, Godbillon-Camus and Godlewski (2007) noted that it is desirable to provide loan officers with incentives in the form of appro- priate salary valuation and delegated authority. Cerqueiro (2009) discussed the issue with loan officersʼ discretion vs. rules in setting interest rates. The study by Berger and Black (2011) indicated that smaller financial institutions tend to emphasize relationship lending.
Uchida, Udell, and Yamori (2012) demonstrated with empirical evidence that the role of loan officers is important to some extent in Japan.
Meanwhile, our review indicated that no empirical study has been conducted on the ac- tivities and characteristics of loan officers relative to relationship banking, even though there are case studies. Xu (2010) looked at the Tailong Commercial Bank in Taizhou City, Zhejiang Province and found that its management model in valuing soft information has resulted in a successful business transaction at the Bank, which mainly serves small and micro enterprises. In its business model, Tailong Bank has a unique screening system called Sanpinsanbiao which can be roughly translated as “three qualities and three fig- ures.” The “three qualities” refer to personality, collateral, and products which indirectly check the intention of the borrowers to repay loans by asking employees, business part- ners, and people who are indirectly involved with the company about the personality of the business operator and assess the companyʼs actual repayment capability by examining the quality of a companyʼs products, sales figures, and outlook. The bank also considers it im- portant to verify the collateral to minimize the risk of the loan. Furthermore, the loan offi- cer scrutinize the actual production activities of the company by analyzing “three figures,”
which refer to the amount of electricity usage, the amount of water usage, and customs declarations, so as to reduce information asymmetry.
That said, it became clear from the interview that we conducted in March 2011 with the
assistant general manager of the financing division of a state-owned commercial bank
branch in S City that Tailong Bank is not the only bank that focuses on soft information
relative to actual financing behavior. Tang (2012) showed that banks do not necessarily
trust information given to them, such as a companyʼs credit rating, tax reports, and finan-
cial statements. This is because it is well known that there are frequent cases of underre-
porting in the State Administration of Taxation filings by SMEs. Therefore, it is essential
for banks to obtain information independently on companies to which the banks consider
making loans. When doing so, the due diligence report prepared by the loan officer (project
manager) becomes an important reference material to determine whether to finance or not.
This report includes mainly the following items: 1) personal disposition of the business op- erator (personality, creditworthiness, etc.) , 2) management tenure and position in the indus- try, 3) personal assets, 4) foreign investments, 5) future prospects of the industry, 6) infor- mation obtained from business partners and competitors, 7) verification of the inventory, and 8) verification of the electricity and water bills. In other words, these are what the banks consider important. We can see that loan officers generate and accumulate various types of soft information on the business operator and the company in the form of a report at the time of loan screening.
3. Hypotheses and Descriptive Analysis of the Data
Thus, in order to test whether the role of loan officers as described above actually leads to the theoretical outcome, we conducted a survey on the textile industry clusters in China between February and April of 2012 (hereinafter referred to as “2012 Survey”) . It is an indepen- dent face-to-face survey that covered a total of 157 companies in the cotton-spinning-relat- ed industry in regions located in the Zhejiang and Jiangsu provinces. Notably, in addition to collecting “hard information” (e. g., financial data) on the companies, the 2012 Survey also asked a wide range of questions relating to the activities of loan officer, soft information (attributes on the company and the business operator) , business relationship with financial in- stitutions, companyʼs business challenges, initiatives for innovation, and desired govern- ment policies. This paper will focus particularly on the role of loan officers in relationship lending based on individual company data we collected during the survey. Since a similar survey (albeit with slightly different questions) was also conducted in 2010 and 2011, we know the quality of the 2012 survey is reliable because its findings are consistent with the previ- ous two yearsʼ survey.
Given that soft information is considered important in relationship lending as described above, we would like to propose the following two hypotheses regarding the role of loan of- ficers. The first (Hypothesis 1) is that loan officers play an important role in generating soft information in relationship lending. For this hypothesis, we will use our company survey data to explain what kind of activities loan officers actually undertake during the process of generating soft information, as well as to verify their role. It is represented by Equation (1) as follows:
Amount of soft information = f (Characteristic and activities of the loan officer,
strength of the relationship, control variable) (1)
In other words, the dependent variable in Hypothesis 1 is soft information (SOFT) . Inde-
pendent variables include loan officerʼs characteristics and activities to produce soft infor-
mation, various variables to represent the strength of the relationship, the variables to re-
move the hard information on the company, and various control variables to represent the
characteristics of the company.
The next hypothesis (Hypothesis 2) is that if soft information is being accumulated, it must provide some kind of benefit to a company through the role of loan officers in obtain- ing financing. This is expressed in Equation (2) as follows:
Benefit of the relationship = g (amount of soft information, control variables) (2) In other words, the dependent variable of Hypothesis 2 is the benefit of the relationship.
As independent variables, the equation uses soft information (SOFT) , which is the depen- dent variable in Hypothesis 1, as well as a variety of variables to represent the strength of the relationship and various control variables that represent the characteristics of the company.
Under these two hypotheses, the important thing is how to measure soft information (SOFT) . Following Scott (2004) and Uchida, Udell, and Yamori (2012) , we prepared a set of six questions to have companies rate how well the financial institutions know about them.
The six questions are: 1) whether they know your company, 2) whether they know your companyʼs management team and owner, 3) whether they know the industry your compa- ny belongs to, 4) whether they know the market your company is involved in, 5) whether they know the local community your company belongs to, and 6) the frequency of daily con- tact between your company and the loan officer. We decided to use the responses to each question based on a five-point scale, where 1 means “doesnʼt know at all” and 5 means
“knows very well,” to perform the principal component analysis and create variables for soft information.
3)Table 1 shows the percentages as to how each company rated the six items based on a five-point scale. According to the table, the most chosen rating category was 3 (knows) for all items, except for Item 5; in general, many companies rated financial institutions as 3 or 4. Furthermore, among the six items, Item 1 had the highest mean score of 3.43, whereas Item 4 had the lowest mean score of 3.04. The first principal component obtained from the principal component analysis using the rating scores for the six items as described above is the dependent variable of soft information (SOFT) .
4)Next, the variables given below are used as independent variables. First, the following variables related to the characteristics and activities of the loan officer could come to mind as variables that affect the production and accumulation of soft information by the loan of-
3 ) Such a verification method is based on Uchida, Udell, and Yamori (2012).
4 ) In addition, we have created dummy variables, which were assigned the value of 1 when the
response was “Quite excellent,” and we performed the principal component analysis using those six
dummy variables to create the dependent variable SOFT 2 by using the first principal component
obtained as a result. However, given that SOFT produced more results with better quality, we have
determined to proceed with the analysis by using SOFT as the dependent variable.
Table 1 Items for Companies to Rate Financial Institutions
Rating Items 1.
Doesnʼt know at all
Doesnʼt 2.
know well
3.
Knows
Knows 4.
well
Knows 5.
very well
Total (Mean) 1 ) Knows your
company 2.3 13.2 36.4 35.7 12.4 100%
(3.43) 2 ) Knows your
companyʼs owner and management team
1.6 18.6 41.1 26.4 12.4 100%
(3.29) 3 ) Knows your
companyʼs industry 1.6 22.5 41.1 14.0 20.9 100%
(3.30) 4 ) Knows the markets
related to your
company 1.6 26.4 41.9 27.1 3.1 100%
(3.04) 5 ) Knows the local
community your
company belongs to 3.1 17.1 33.3 39.5 7.0 100%
(3.30) 6 ) Frequency of daily
contacts between your company and the loan officer
0.8 14.7 48.8 28.7 7.0 100%
(3.26)
Note: Sample size =129
Table 2 Business Activities and Relationship with the Loan Officer
Choices Sample size
(companies) Percentage (%) Replacement of the
loan officer
None 104 75.4
Once 24 17.4
Twice or more 10 7.3
Total 138 100.0
Age of the loan officer
In his/her 20s 18 13.1
In his/her 30s 88 64.2
In his/her 40s or older 31 22.6
Total 137 100.0
Meeting place
At the company 44 32.4
At the bank 90 66.2
Other 2 1.5
Total 136 100.0
Contact method
Meet in person 54 39.4
Telephone 79 57.7
E-mail, etc. 4 2.9
Total 137 100.0
Temporal distance to meet
5 minutes or less 43 34.1
6 to 10 minutes 48 38.1
More than 10 minutes 33 26.2
Total 126 100.0
ficer. In other words, the loan officer-replacement dummy variable can be used to indicate that the loan officer was never replaced in the past two years (replacement = 1 and no replace- ment = 0; however, the coding was reversed at the time of analysis) .
5)Theoretically, the variable is expected to have a positive sign in relation to SOFT, given that the amount of informa- tion generated would increase when no loan officer replacement occurs.
Another one is the age group dummy variable (in his/her 30s = 1) , which represents the ex- perience of the loan officer. The variable is expected to be positive, given that those in a younger age group are generally less knowledgeable and experienced with various aspects of their clients, whereas those in their 40s or older have a richer collection of soft informa- tion on their clients. However, Uchida, Udell, and Yamori (2012) pointed out that the sign is not always clear because younger loan officers might visit their clients more frequently and strive to collect soft information.
The questionnaire also asks about the frequency of contact with the bank in terms of how many times they meet each other per month or per year. With the dummy variable for the place for meeting the loan officer (at the company = 1, at the bank = 0) , having the loan of- ficer visit the company in person rather than meeting at the bank is probably a plus for generating soft information. As for the most frequently used contact method (in person = 1, telephone, fax, QQ, etc. = 0) , in-person communication should have a better effect on generat- ing soft information than telecommunication.
The characteristics and activities of the loan officer, as described above, are shown in Table 2. Based on the table, loan officers were not replaced in approximately 75.4% of all cases, whereas the cases of one-time replacement accounted for 17.4%, and the cases with twice or more replacements accounted only for 7.3%. In the case of China, a system to ro- tate personnel every two to three years, similar to the one found in Japan, is rarely seen, and there is usually a system in which loan officers are held accountable until their financ- ing projects are completely paid off.
6)As for the age group of loan officers, those in their 20s and 30s account for 13.1% and 64.2%, respectively, for a total of 77.3%. In addition, 66.2%
meet at the bank, 57.7% use the telephone, and 39.4% meet in person in terms of contact method. In addition, we can see that 72.3% are located within a 10-minute drive in terms of the temporal distance between the company and bank. This is probably attributable to the fact that many of the companies we studied are located in the suburbs or rural areas.
In addition, the frequency of financial statement submissions to the bank is categorized as (1) at least once a month, (2) once every three months, (3) once every six months, and (4)
5 ) The interval based on which the loan officer is rotated probably differs by bank; however, given that the interviews we conducted indicated that loan officers at commercial banks are sometimes transferred and replaced every two to three years, we use the period of two years in this paper.
6 ) In many cases, compensation, such as bonuses for the loan officer, is dependent on the repayment
status of the company (according to an interview with a bank branch manager conducted by the
authors in May 2015).
Table 3 Descriptive Statistics Sample Size
(companies) Mean SD Min Max
(1) Company and Operator Attributes
Age of the company (years) 144 9.514 5.238 2 26
Capital (10,000 yuan) 141 549.175 1,407.424 15 10,000
M anagement tenure of the
CEO (years) 144 7.951 4.891 1 24
N umber of employees
(individuals) 144 168.819 139.055 15 820
Asset size (10,000 yuan) 139 2,441.424 4,679.646 100 31,061
(2) Main Variables
Frequency of visit (per year) 135 15.585 33.174 0 240
Distance (minutes) 126 10.901 8.886 1 80
R eplacement of the loan
officer (times) 138 0.754 0.432 0 1
Age of the loan officer 137 0.774 0.420 0 1
Meeting place 136 0.324 0.470 0 1
Contact method 137 0.394 0.490 0 1
N umber of banks financing
the company 116 1.690 0.807 1 5
L ongest relationship with a
bank 136 4.390 3.089 1 23
Diversification of business 133 3.195 0.957 1 6
once a year. Here, the dummy variable is coded so that “ (1) at least once a month” has the value of 1. This can be regarded as an important control variable to remove hard informa- tion because we can say that a higher frequency in which the lender company submits fi- nancial statements to the bank implies that the bank is making such a demand to the lender company and monitoring the companyʼs financial situation carefully. By doing this, the frequency of contact with the loan officer increases, thus helping produce soft informa- tion. With regards to variables representing the scale of the company, we asked for infor- mation about the size of capital, size of total assets, sales, number of employees, age of company, and sales performance in the past two years, which is categorized into (1) consec- utive surplus, (2) surplus to deficit, (3) deficit to surplus, and (4) consecutive deficit. Nota- bly, the dummy variable assigns the value of 1 to “ (1) consecutive surplus.”
As for the characteristics of the business operator, we asked for information about the operatorʼs tenure as a manager, educational background, and whether he/she is a founder.
It is probably easier for the loan officer to collect soft information if the company has been
in business for a while. A companyʼs creditworthiness should also be higher if the business
operator is a founder who is better educated. However, these variables do not have a con-
siderable effect on the quantitative analysis because more than 90% of our surveyed com- paniesʼ business operators are founders, and more than 70% of them have an educational background of high school or less.
Finally, as a control variable, the temporal distance dummy variable (DISTANCE, within 10 minutes = 1, 10 minutes or more = 0) is used as an independent variable that represents the strength of the relationship between the company and the bank.
7)According to the rela- tionship theory, the frequency of contact between an SME and their bank increases as the distance between them becomes shorter to make it easier for them to build a close relation- ship. For example, Alessandrini, Presbitero, and Zazzaro (2008) analyzed and found that the amount of funding provided to the company increases as the relationship between the company and bank becomes closer. As regards the number of banks from which a company received loans, although we can expect the relationship to be stronger when there are few- er banks, the mean among SMEs remains at 1.69 banks, as shown in Table 3. The means in Japan and the United States have been reported as 4.1 to 4.2 (Ono and Uesugi, 2009) and 1.2 (Brick and Palia, 2007) , respectively. In addition, the longer the company does business with their main bank, the stronger their relationship should become. Such analyses on the strength of relationship have shown the significance of the length of relationship in empir- ical studies, such as that by Tang (2012) .
The diversity of business services also represents the strength of relationship lending because financial transactions include not only lending to companies but also such items as settlement, wealth management product investment, and foreign currency procure- ment. Looking at Table 3, our study shows that the mean of a bankʼs business services to the company is 3.1. However, as shown by Tang (2012) , it seems that banks often make companies redeposit or reinvest in wealth management products a portion of the loan fi- nanced by the bank. In fact, 38 companies, or 28.6% of all companies we surveyed, used wealth management service from banks. According to Ono and Uesugi (2009) , the mean number of business services (excluding lending transactions) that SMEs receive from their main bank is 4.2. We can say that SMEs in Japan actually conduct more diversified finan- cial transactions with their banks.
4. Estimation Results
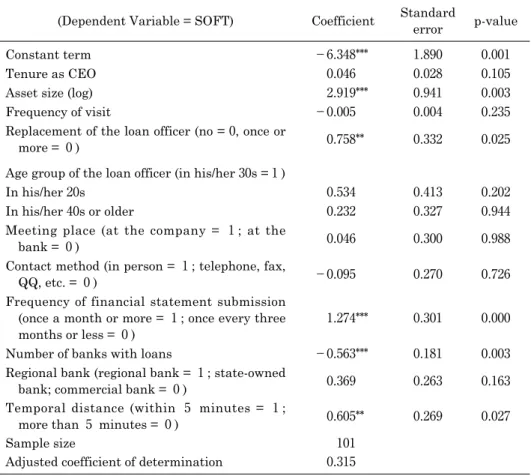
The estimation result for Hypothesis 1 is shown in Table 4. This is the result of analyz- ing a loan officerʼs role in accumulating soft information. Based on this, the result is posi- tive and significant when the loan officer was not replaced. It implies that the amount of soft information produced increases when the same loan officer remains in charge of the lender company on a long-term basis.
7 ) We have also asked about spatial distance.
The reference age group of the loan officer is “in his/her 30s,” and the dummy variables were not significant for “in his/her 20s” or “in his/her 40s or older,” indicating that the col- lection of soft information is not associated with the level of a loan officerʼs skill. In addi- tion, it became clear that factors such as meeting place and contact method were unrelat- ed.
We consider the results for other main independent variables. The dummy variable for submitting financial statements at least once a month was positive and significant. This suggests that frequent submissions of financial statements by the company led the bank to understand the companyʼs financial situation well and/or to increase the frequency of con- tact with the loan officer through visitation. In addition, the dummy variable of temporal distance was positive and significant, thus implying that the relationship becomes closer as the distance between the bank and the company becomes shorter. Furthermore, the number of banks the company does business with was negative and significant, thus sug- gesting that the relationship becomes weak because information on the borrowing compa- ny might not be sufficiently generated.
Table 4 Information Production and Activities of the Loan Officer
(Dependent Variable = SOFT) Coefficient Standard
error p-value
Constant term −6.348
***1.890 0.001
Tenure as CEO 0.046 0.028 0.105
Asset size (log) 2.919
***0.941 0.003
Frequency of visit −0.005 0.004 0.235
Replacement of the loan officer (no = 0, once or
more = 0 ) 0.758
**0.332 0.025
Age group of the loan officer (in his/her 30s = 1 )
In his/her 20s 0.534 0.413 0.202
In his/her 40s or older 0.232 0.327 0.944
Meeting place (at the company = 1 ; at the
bank = 0 ) 0.046 0.300 0.988
Contact method (in person = 1 ; telephone, fax,
QQ, etc. = 0 ) −0.095 0.270 0.726
Frequency of financial statement submission (once a month or more = 1 ; once every three
months or less = 0 ) 1.274
***0.301 0.000
Number of banks with loans −0.563
***0.181 0.003
Regional bank (regional bank = 1 ; state-owned
bank; commercial bank = 0 ) 0.369 0.263 0.163
Temporal distance (within 5 minutes = 1 ;
more than 5 minutes = 0 ) 0.605
**0.269 0.027
Sample size 101
Adjusted coefficient of determination 0.315
Note: ***, **, and * indicate that the coefficient is significant at the 1%, 5%, and 10% levels, respectively.
To sum up the above analysis results for Hypothesis 1, our study has confirmed the role played by loan officers in generating and accumulating soft information. The next analysis task is to test Hypothesis 2 as to what is the significance of soft information. That is, if soft information is being accumulated, it is necessary to demonstrate that it has a positive im- pact on obtaining funding. Here, the dependent variable to represent the benefit of rela- tionship is the question item indicating the level of difficulty that the company encounters while being evaluated for a loan. In particular, this question concerns the current screen- ing process when they want a loan, and we provided answer options, including (1) very strict, (2) slightly strict, (3) relatively easy, and (4) donʼt know (however, given that there were only several companies that said “donʼt know,” (4) was excluded) . Notably, among the valid sam- ple of 134 companies, 35.8% (48 companies) chose (1) , whereas 52.2% (70 companies) and 11.9%
(16 companies) chose (2) and (3) , respectively. If soft information had a positive impact on re- lationship lending, companies should choose (3) , or at least (2) , in terms of the level of diffi- culty they encounter at the time of loan screening.
Given that the choices for this question are related to preference, we are going to mea- sure the determinants of the benefit in procuring funding in Hypothesis 2 by using an ordi- nal choice model. In doing so, we will also add ordinal probit analysis, which has almost the same process. This aims to test the benefit of relationship lending by incorporating the amount of soft information used in Hypothesis 1 as an independent variable.
8)The following estimation model is conceivable:
y
*=βx+ε
(y
*: latent variable, χ: independent variable, β: coefficient vector, and ε: error term)
Furthermore, observed independent variable y and latent variable y
*would have the fol- lowing relationship based on the mechanism of threshold k
j:
1. y=
The threshold and the coefficient vector that satisfy the above relationship are deter- mined by least squares estimation. There are two thresholds, k1 and k2, to be determined to satisfy J = 3 in this paperʼs case. If there are three answer choices for the independent
⎧ ⎜
⎜ ⎜
⎨ ⎜
⎜ ⎜
⎩
0 if y
*≤k
11 if k
1<y
*≤k
2・ ・ ・
J if k
j−1<y
*8 ) We also used a dummy variable that coded only “( 1 ) very strict” as 1 to indicate the level of
difficulty encountered by a company at the time of obtaining a loan and then performed probit
estimation (marginal effects); however, the results were almost the same.
variable at that time, the probability of choosing each option is also expressed specifically as follows:
P ( y=0|x)=1/(1+exp (
−k
1+Σβx))
P ( y=1|x)=1/(1+exp (−k
2+∑βx))−1/(1+exp (−k
1+∑βx)) P ( y=2|x)=1−1/(1+exp (−k
2+∑βx))
As for the estimation for the probit model, it can be described as follows: If the choice of the economic agent y
i*is expressed as y
*=βx+ε, y
*would be observable or would be possi- ble latent variable, and ε would be the error term. Given that y
*, in the case of above equa- tion, is unobservable, y is defined to meet the following conditions:
y=0 if y
*<1 y=1 if y
*≧0
Assuming that ε follows a standard normal distribution, the parameter vector β is esti- mated.
The results of the ordinal logit and ordinal probit estimations are shown in Table 5.
First, looking at Equation (1) in terms of the significance and sign of the parameters, ones such as log of sales and years doing business with the main bank are significant and gen-
Table 5 Determinants for the Level of Difficulty in Loan Screening Ordinal Logit ( 1 ) Ordinal Probit ( 2 ) Coefficient z-value Coefficient z-value
Soft information 0.433
***2.82 0.252
***2.92
Tenure as CEO −0.057 −1.62 −0.028 −1.51
Sales (log) −8.371
**−2.27 −4.781
**−2.32
Regional bank dummy −0.002 −0.05 −0.035 −0.15
Years doing business with the
main bank 0.235
***2.72 0.129
***2.74
Temporal distance 0.474 1.09 0.246 0.99
Frequency of financial statement
submission 0.252 0.56 0.080 0.31
Two-year consecutive surplus
dummy −0.001 −0.21 −0.004 −0.21
cut 1 −5.849 2.489 −3.362 1.446
cut 2 −2.844 2.434 −1.619 1.425
Sample size 116 116
LR chi 2 ( 8 ) 28.31 27.97
Log likelihood −97.110 −97.282
Pseudo R 2 0.127 0.126
Note : ***, **, and * indicate that the coefficient is significant at the 1%, 5%, and 10% levels, respectively.