DISCUSSION PAPER No.190
知識結合に基づく新規性評価に関する研究
A validation study of
knowledge combinatorial novelty
2020
年
11月
文部科学省 科学技術・学術政策研究所 科学技術・学術基盤調査研究室
松本 久仁子 柴山 創太郎 姜 秉祐 伊神 正貫
本DISCUSSION PAPERは、所内での討論に用いるとともに、関係の方々からの御意見を頂くことを目 的に作成したものである。
また、本DISCUSSION PAPERの内容は、執筆者の見解に基づいてまとめられたものであり、必ずしも
機関の公式の見解を示すものではないことに留意されたい。
The DISCUSSION PAPER series is published for discussion within the National Institute of Science and Technology Policy (NISTEP) as well as receiving comments from the community.
It should be noticed that the opinions in this DISCUSSION PAPER are the sole responsibility of the authors and do not necessarily reflect the official views of NISTEP.
【執筆者】
松本 久仁子 文部科学省 科学技術・学術政策研究所 科学技術・学術基盤調査研究室 研究員 [全般についての分析実施及び報告書執筆]
柴山 創太郎 ルンド大学 経済経営学部 上級講師 [分析方針及び報告書についての助言]
姜 秉祐 一橋大学 イノベーション研究センター 准教授 [分析方針及び報告書についての助言]
伊神 正貫 文部科学省 科学技術・学術政策研究所
科学技術・学術基盤調査研究室長 [分析方針助言及び報告書確認]
【Authors】
MATSUMOTO Kuniko Research Fellow, Research Unit for Science and Technology Analysis and Indicators, National Institute of Science and Technology Policy (NISTEP), MEXT SHIBAYAMA Sotaro Senior lecturer, School of Economics and Management, Lund University
KANG Byeongwoo Associate Professor, Institute of Innovation Research, Hitotsubashi University IGAMI Masatsura Director, Research Unit for Science and Technology Analysis and Indicators,
National Institute of Science and Technology Policy (NISTEP), MEXT
本報告書の引用を行う際には、以下を参考に出典を明記願います。
Please specify reference as the following example when citing this paper.
松本 久仁子・柴山 創太郎・姜 秉祐・伊神 正貫 (2020) 「知識結合に基づく新規性評価に関する研 究」,NISTEP DISCUSSION PAPER,No.190,文部科学省科学技術・学術政策研究所.
DOI: https://doi.org/10.15108/dp190
MATSUMOTO Kuniko, SHIBAYAMA Sotaro, KANG Byeongwoo and IGAMI Masatsura (2020) “A validation study of knowledge combinatorial novelty”, NISTEP DISCUSSION PAPER, No.190, National Institute of Science and Technology Policy, Tokyo.
DOI: https://doi.org/10.15108/dp190
知識結合に基づく新規性評価に関する研究
A validation study of knowledge combinatorial novelty
文部科学省 科学技術・学術政策研究所 科学技術・学術基盤調査研究室 松本 久仁子, 柴山 創太郎, 姜 秉祐, 伊神 正貫
要旨
論文の質的評価指標の代表的なものとして
Top10%論文のように被引用数を用いた指標が主流となっている一方で、被引用数という引用の数量的視点のみから論文を評価することへの限界も指摘されて いる。
本研究では、知識源の新結合に着目し、引用文献の組合せ(類似度)により測定される新規性指標の 提案を試みた。そして、日本の機関に所属する研究者の論文を対象としたサーベイ調査の結果を用いて、
本研究で提案する新規性指標が、どのような研究の新規性を測っているのか、validation 分析も実施した。
その結果、本研究で提案した新規性指標は、自然科学系の分野のさまざまな研究成果の類型において、
研究者が判定する研究の新規性を反映するものであることがわかり、研究者による研究の新規性を計測 するための代理変数として有用であることが伺えた。
A validation study of knowledge combinatorial novelty
MATSUMOTO Kuniko, SHIBAYAMA Sotaro, KANG Byeongwoo and IGAMI Masatsura
Research Unit for Science and Technology Analysis and Indicators, National Institute of Science and Technology Policy (NISTEP), MEXT
ABSTRACT
Citation counts have long been considered the primary bibliographic indicator in evaluating the quality of research-a practice premised on the assumption that citation count is reflective of the impact of a scientific publication. However, identifying several limitations in the use of citation counts alone, scholars have advanced the need for multifaceted quality evaluation methods.
In this study, we applied a new novelty indicator which quantifies the degree of citation similarity between a focal paper and a pre-existing same-domain paper to various fields of natural sciences.
Furthermore, we also tested the convergent validity of the novelty indicator by using researchers' self- assessments of the degree of relevance of each research type obtained from a survey to Japanese researchers. Our validation analysis reveals that the novelty indicator we propose seems suited for identifying papers suggesting the novelty of various research types in the fields of natural sciences.
目次
概要 ... i
<本編> 1. Introduction ... 1
2. Literature review ... 2
3. Proposed measure of novelty ... 3
4. Data and Methods of Validation ... 6
4.1. Survey data ... 6
4.2. Bibliometric data for the measurement of novelty ... 7
4.3. Validation Methods ... 7
5. Results and Discussion ... 8
5.1. Descriptive Statistics ... 8
5.1.1. Novelty scores ... 8
5.1.2. Relevant degrees of research types by researchers' self-assessments ... 9
5.2. Regression results ... 10
5.2.1. Results of All fields ... 10
5.2.2. Results of each fields ... 15
6. Conclusion ... 18
【Acknowledgment】 ... 19
【References】 ... 19
【Appendix 1】 Descriptive statistics of novelty in each field... 23
【Appendix 2】 Box plots of novelty indicators ... 24
【Appendix 3】 Regression results in each field ... 26
概要
i
1.
はじめに
1.1. 背景
論文の質的評価指標の代表的なものとして
Top10%論文のように被引用数を用いた指標が主流となっている。他方で、被引用数という引用の数量的視点のみから論文を評価することへの限界が指摘されて おり(Baird & Oppenheim, 1994; MacRoberts & MacRoberts, 1996)、論文の質的評価において、多面的な 評価が求められる。
ここ数十年の間、科学計量学の分野において、新規性を測るための書誌情報を用いた様々な指標が 提案されている。その代表的なものとして、知識源の新結合に着目した新規性指標(combinatorial
novelty literature)がある(Uzzi et al., 2013 , Wang et al., 2018)。この指標は、既存知識の今までにない 組合せが革新的な成果を生み出すのに貢献するという考えに基づいている(Mednick, 1962; Simonton,
2003; Kaplan & Vakili, 2015)。これまでの既存研究では、引用文献、引用文献のジャーナル、キーワードなどが、知識の組合せを測るための書誌データとして用いられている(eg. Lee et al., 2015, Wang et al,
2017, Wang et al, 2018, Dahlin and Behrens, 2005, Trapido, 2015, Uddin and Khan, 2016)。引用文献の組合せは、引用ジャーナルやキーワードと比較して、より多くの組合せの中での新規性を測るので、計算コ ストが高い一方、より多様な知識の組合せを測ることができる利点がある。引用文献の組合せによる指標 は、これまでの研究でいくつか提案されている。Dahlin and Behrens (2005)は、特許の新規性を測るため、
引用文献の組合せによる指標を提案しており、Trapido (2015)は
Dahlin and Behrens (2005)の指標を論文へ適用した。
様々な指標が提案される一方で、研究評価等へ指標を導入することは、研究者の行動を変化させる可 能性すらある(Hicks et al., 2015)。したがって、提案されてきた新規性指標が、どのような研究の新規性を 測っているのか、検証することは、指標を政策立案等で活用する上で重要である。近年、サーベイ調査を 用いた新規性指標の
validationの研究がいくつか見られるようになってきている(eg. Tahamtan and
Bornmann, 2018, Bornmann et al., 2019)。1.2. 目的
本分析では、Dahlin and Behrens (2005)によって提案された新規性指標を、自然科学全般への拡張を 試みる。そのために、書誌データのみで新規性指標の算定が可能な新しい方法を提案する。書誌データ のみで算定することにより、書誌データ以外のデータに関する制約が緩和され、どの分野でも算定可能と なる。
さらに、日本の機関に所属する研究者の論文を対象としたサーベイ調査の結果を用いて、本研究で提 案する新規性指標が、どのような研究の新規性を測っているのかの
validation分析も試みる。
2.
本分析で用いる新規性指標
Dahlin and Behrens (2005)による新規性指標は、分析対象となる特許の引用文献と同分野の既存特許
の引用文献の類似性によって定義される。
同分野の定義方法についてみると、Dahlin and Behrens (2005)では、テニスラケットの特許を分析対象
としており、国際特許分類のサブクラスが同一の特許を同分野の特許と定義している。論文の場合、国際
特許分類のサブクラスに該当するような標準的かつ詳細な分類区分が存在しない。本分析で用いる
Webii
of Science
の書誌データに収録されている分野分類の最小単位はサブジェクトカテゴリである
i。サブジェ
クトカテゴリ数は約
250であり、既存研究の分野の粒度と比較して非常に大きい
ii。分類区分が大きいほ ど、引用文献の類似性は低くなり、新規性の計測が難しくなる。Dahlin and Behrens (2005)の指標を論文 に適用した研究として、Trapido (2015)による情報理論を対象とした分析が挙げられる。当該研究では、
論文データベースに収録されている書誌情報以外の情報を用いて特定した情報理論の研究者の論文を 情報理論の論文と定義している。
本研究では、どの分野についても、同じ基準で新規性指標の算定を可能とするために、論文データベ ースに収録されている書誌情報のみで同分野の論文を特定できるような方法を提案する。具体的には、
サブジェクトカテゴリよりも小さい分野単位を定義するため、本分析では、分析対象とする論文とサブジェ クトカテゴリが完全一致する論文群のうち、引用文献を少なくとも
1件以上、共引用する論文群を同分野 の論文群と定義する(概要図表
1参照)。
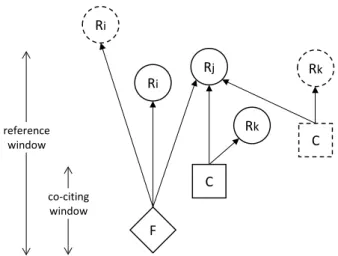
概要図表 1 対象文献と同分野文献の関係
注) F:対象文献、R:対象文献の引用文献、C:対象文献の引用文献を引用する文献(同分野)
当該指標は、分析対象文献の引用文献と同分野の既存文献の引用文献の積集合を和集合で除した 値(OS:Overlap Score)を 1 から差し引くことで算定される iii。算定式は以下のようになる。
Novelty は 0 から 1 の値をとり、1 に近づくほど、既存の知識の組合せと比較して新しい知識を
組合せており、新規性が高いことを示す。
𝑂𝑂𝑂𝑂𝐹𝐹𝐹𝐹=[N_Ref]𝐹𝐹∩[N_Ref]𝐹𝐹
[N_Ref]𝐹𝐹∪[N_Ref]𝐹𝐹 Novelty = 1−1
𝑛𝑛 � 𝑂𝑂𝑂𝑂𝐹𝐹𝐹𝐹
𝑛𝑛 𝑐𝑐=1
i ジャーナルごとに付与されるもので、1ジャーナルに複数付与される(原則最大6分野付与)。
https://images.webofknowledge.com/WOKRS525R8.4/help/ja/WOS/hp_subject_category_terms_tasca.html
(2020年1月アクセス)
ii 国際特許分類のサブクラス数は約650である。(IPC-2020.01版)
iii なお、当該指標の算定にあたり、2つのcitation windowを設定する必要がある。1つは分析対象文献の引用文献の 出版年をどの範囲まで含めるかを決定するためのcitation windowである(reference window)。もう1つは、同分野の既存 文献の出版年をどの範囲まで含めるかを決定するためのcitation windowである(co-citing window)。reference windowと
co-citing windowの関係については、概要図表1を参照のこと。
Ri
Ri Rj Rk reference
window
co-citing window
C
F C
Rk
iii
3.
新規性指標の
validation分析
3.1. 分析データおよび分析手法
(1) 分析対象文献
本分析の調査対象とする論文は、一橋大学イノベーション研究センターと
NISTEPが共同で実施した
「科学における知識生産プロセスに関する調査(以下、科学者サーベイ)」(Nagaoka et al., 2010)で有効回 答を得られた調査対象者の論文とする。
分析対象論文は、クラリベイト社の提供する論文データベース(Web of Science:Science Citation Index
Expanded)に収録されている自然科学系の論文で、2001~2006
年に出版された
Articleと
Lettersに該
当するもののうち、いずれかの著者の所属機関に、日本に所在する機関が含まれている論文となる。
分析対象論文数は
2,081件であり、高被引用度論文(566 件)と通常論文(1,515 件)から構成されてい る。高被引用度論文とは、各年、各ジャーナル分野(22 ジャーナル分野 )において被引用数上位
1%の論文(高被引用度論文)である。通常論文は、高被引用度論文を除いた全論文から、日本に所在する機 関が含まれているものを、各年、各ジャーナル分野(22 ジャーナル分野)で無作為に抽出したものである。
(2) 新規性に関するサーベイ結果
科学者サーベイでは、科学における知識生産プロセスとそのイノベーション創出における構造的な特 徴を明らかにするため、大きく
7つの質問群を設定している。
本分析では、調査対象論文についての質問群に含まれる「対象論文の研究成果の類型」の質問の中 の、8 つの選択肢の回答結果を用いる。これらの類型は、理論、現象、手法、機能・機構・物質の
4つの 観点から、新規性の高い類型と既存研究の改良・評価に係る類型の対になっている(概要図表
2参照)。
なお、選択肢ごとに「全く当てはまらない」を
1、「非常に当てはまる」を5として、5 段階で評価する回答形 式となっている。
概要図表 2 研究成果の類型
新規性の高い類型 既存研究の改良・評価に係る類型
理論
new_theory新しい仮説・理論の構築
valid_theory
既存の仮説・理論の検証(反証も含む)
現象
new_phenom未知の現象・物質の発見
under_phenom 現象の解明
手法
new_meth新しい研究方法・手法の構築
imprv_meth
既存の研究方法・手法の改良
機 能 ・ 機 構 ・
物質
new_mat
新しい機能・機構・物質の創出
imprv_mat
既存の機能・機構・物質の改良
(3) 分析手法
本分析では、上記の科学者サーベイの「研究成果の類型」に関する回答結果を被説明変数、書誌デ ータから算定した新規性指標の値を説明変数とする順序ロジットモデル、最小二乗法(OLS)
ivによって、
新規性指標と研究成果の類型の関係を分析することにより
Validationを行う。特定の分野および特定の 出版年の影響をコントロールするため、分野(統合
8分野
v)と出版年についてのダミー変数を加えている。
iv 順序ロジットモデル、最小二乗法ともに係数を標準化したモデルを適用。
v Essential Science Indicators(ESI)の22分野分類を8分野に分類したもの。本編4.2を参照のこと。
iv
3.2. 分析結果
概要図表
3に被説明変数、説明変数の記述統計を示す。新規性指標の値については、どの
citationwindow
のパターンも類似した値が算定されており、citation window のパターンを変化させることで指標
の値が大きく変化することはないことがわかる
vi。サーベイ結果については、under_phenom(現象の解明),
new_theory(新しい仮説・理論の構築)で高い値、imprv_mat(既存の機能・機構・物質の改良), new_mat(新しい機能・機構・物質の創出)で低い値になることがわかる。
概要図表 3 記述統計 (a) 新規性指標
citation window pattern reference window co-citing window
(1) all 3years
(2) all all
(3) 10years 3years
(4) 10years all
Mean 0.948 0.950 0.933 0.933
Std. Dev. 0.051 0.048 0.065 0.064
Min 0.471 0.500 0.333 0.333
Max 0.996 0.996 0.998 0.995
(b) サーベイ結果 研究成果の
類型
new_
theory
valid_
theory
new_
phenom
under_
phenom
new_
meth
imprv_
meth
new_
mat
imprv_
mat Mean 3.502 3.303 3.095 3.718 3.097 2.904 2.795 2.370 Std. Dev. 1.279 1.259 1.451 1.198 1.338 1.247 1.518 1.272
注) どの研究成果の類型、citation windowのパターンも、分析データ数は1,871となる。
概要図表
4に順序ロジットモデルによる分析結果を示す。当該分析結果から、reference window が
10年(window pattern 3,4)の場合、新規性の高い類型全て(new_theory, new_phenom, new_meth, new_mat)
において、統計的に有意性のある正の相関が確認された。そして、理論、現象、手法、機能・機構・物質 の観点ごとに研究成果の類型の結果を比較すると、いずれも新規性の高い類型の方が係数の値が大き くなっている。なお、OLS による分析でも同様の結果が得られた(本編
Table4.2参照)。
このことから、本研究で分析対象とした新規性指標は、reference window が短い場合に、さまざまな研 究成果の類型において、研究者が判定する研究の新規性を反映するものであることがわかる。そのため、
研究者による研究の新規性を計測するための代理変数として有用であることが伺える。
window pattern 3,4
を比較すると、類似した結果となっていることから、co-citing window の長さの影響
は少ないと考えられる。そのため、計算コストの観点から、citation window は、reference window が
10年、
co-citing window
が
3年のパターンが最も実用的であると考えられる。
vi ただし、reference windowが長いほど、新規性スコアが高くなる傾向がある。これは、より長いreference windowを用い ると、分析対象とする論文と関連性の低い論文が新規性指標の計算に含まれる可能性が増加するためであると考えられる。
v
概要図表 4 Validation結果:順序ロジットモデル 説明変数:Novelty
Window Pattern 1 Window Pattern 2 Window Pattern 3 Window Pattern 4
reference window all all 10years 10years
co-citing window 3years all 3years all
被説明変数
(研究成果の類型)
new_theory 0.078 0.096 * 0.107 ** 0.118 **
(1.70) (2.00) (2.67) (2.87)
valid_theory 0.097 * 0.085 0.106 ** 0.083 *
(2.29) (1.89) (2.58) (2.02)
new_phenom 0.097 ** 0.110 ** 0.120 *** 0.139 ***
(2.91) (3.14) (3.73) (4.22)
under_phenom 0.063 0.083 0.091 * 0.102 *
(1.43) (1.95) (2.06) (2.30)
new_meth 0.028 0.047 0.071 * 0.085 *
(0.79) (1.31) (2.02) (2.39)
imprv_meth -0.053 -0.044 -0.037 -0.035
(-1.39) (-1.12) (-0.93) (-0.84)
new_mat 0.065 0.070 0.100 ** 0.104 **
(1.74) (1.75) (2.99) (2.95)
imprv_mat -0.037 -0.035 -0.031 -0.034
(-0.98) (-0.90) (-0.87) (-0.92)
注: 1) *** p < 0.001, ** p < 0.01, * p < 0.05. 係数を標準化したモデルを適用。カッコ内はt値。
2) 当該モデルには、コントロール変数として、論文の出版年および分野ダミーを加えている。
3) どの研究成果の類型、citation windowのパターンも、分析データ数は1,871となる。
4.
おわりに
論文の質的評価指標として
Top10%論文のように被引用数を用いた指標が主流となっている一方で、被引用数という引用の数量的視点のみから論文を評価することへの限界も指摘されている。
本研究では、知識源の新結合に着目し、Dahlin and Behrens (2005)によって提案された引用文献の組 合せにより測定される新規性指標の自然科学全般への拡張を試みた。次に、本研究で用いた新規性指 標が、どのような研究の新規性を測っているのかについて、研究者に対するサーベイ調査の結果を用い
た
validation分析を実施した。その結果、本研究で提案した新規性指標は、さまざまな研究成果の類型
において、研究者が判定する研究の新規性を反映するものであることがわかり、研究者による研究の新 規性を計測するための代理変数として有用であることが伺えた
vii。
これまでの指標の
validation分析は、特定の国、分野等、分析対象の範囲が限定されていた。本研究
の
validation分析は自然科学系の幅広い分野の論文を対象としているが、2001~2006 年に出版された
日本の論文を対象としているなど、範囲の制約がないわけではない。今後、様々な国や年代の文献を対
象に
validation分析を進めていくことで、本研究によって示された新規性指標の特徴が、国や年代に依
らない普遍的なものであるかについての検証を深めていくことができると考えられる。
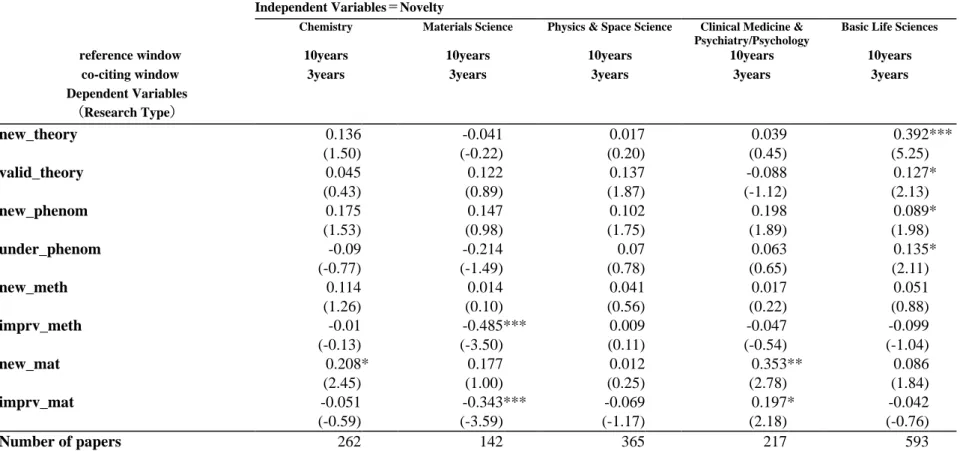
vii ここでは、自然科学系全般についての分析結果を示したが、分野別の分析からは、分野によって統計的な有意性を 示す研究の類型が異なることが示されている。これは、分野によって研究実施に際して、理論、現象、手法、機能・機構・物 質の何れの観点に重きを置くかが異なっているためと考えられる。
本編
1
1. Introduction
Citation counts have long been considered a primary bibliographic indicator in evaluating the quality of research-a practice premised on the assumption that citation count is reflective of impact. However, scholars have identified several limitations in the use of citation counts alone, advancing the need for more multifaceted evaluation methods (Baird & Oppenheim, 1994; MacRoberts & MacRoberts, 1996).
Multifaceted evaluations are particularly necessary insofar as the proper evaluation of the novelty of research is important to both researchers and science and technology policymakers, especially in the context of fostering of disruptive science and technology8.
A range of new indicators were proposed to assess novelty of research. An approach among these is an indicator that focuses on new combinations of knowledge sources, that is, the combinatorial novelty literature (Uzzi et al., 2013, Wang et al., 2018). These indicators assume that novelty develops from unusual combinations of pre-existing knowledge (Mednick, 1962; Simonton, 2003; Kaplan & Vakili, 2015).
Combinatorial novelty indicators are usually measured with pairs of reference papers, journals, or keywords as a unit (eg. Lee et al., 2015, Wang et al, 2017, Wang et al, 2018, Dahlin and Behrens, 2005, Trapido, 2015, Uddin and Khan, 2016).
While the measure by pairs of reference papers is computationally more intensive, it has the advantage of measuring more elaborate unusual combinations of existing knowledge than the other approaches. A novelty indicator proposed by Dahlin and Behrens (2005) is one of the representative indicators measured using pairs of reference papers. They used the indicator to measure the novelty of patents. Trapido (2015) adopted the indicator to measure the novelty of scientific publications. Despite its potential to measure the novelty of research, knowledge accumulation on novelty indicators measured with pairs of reference papers is limited in the current stage.
Simultaneously, not only the development of indicators but also indicators evaluation is necessary.
Indeed, the introduction of new indicators in research evaluation may affect the behavior of researchers (Hicks et al., 2015). Therefore, it is important to check whether indicators really measure what they propose to measure, before they are used, especially in policymaking. This is similarly necessary when new indicators are introduced to scientometrics (Bornmann et al., 2019). If indicators give scores that agree to a large extent with expert human judgments, they can be taken to be useful proxies for the judgments (Thelwall, 2017). There have been several recent empirical studies to validate novelty indicators (eg.
Tahamtan and Bornmann, 2018, Bornmann et al., 2019).
In this study, we apply the novelty indicator proposed by Dahlin and Behrens (2005) to a broader range of natural sciences and conduct a validation analysis using a survey data. In doing so, we propose a new way of identifying papers that fall into the same domain of focal papers using bibliometric data only. In the previous studies, such domain identification has typically relied on non-bibliometric data. This new approach has the advantage of reducing the limit of data availability and enabling measurement of novelty of articles in any fields. Furthermore, we also confirm its usefulness by conducting a validation analysis whether it is consistent with the researchers' subjective judgments about novelty by using a survey data of Japanese researchers in various fields of natural science. Through the validation analysis, we will clarify whether the indicator does measure researchers' subjective novelty, what kind of novelty it measures, and
8 In Japan, the Council of Science, Technology, and Innovation will launch the Moonshot Research and Development program. The program aims to create disruptive innovation in Japan to solve issues facing future society, that are more than just extensions of conventional technology (https://www8.cao.go.jp/cstp/moonshot/index.html in Japanese).
2 what field-specific features it has.
As such, this study contributes to the proposal of a new indicator which is a useful proxy for researchers' subjective novelty judgments and can be measured in articles in any field.
The organization of this paper is as follows. We begin to introduce literature review about novelty indicators in Section 2. Section 3 descries the novelty indicator which we analyzed. In Section 4, we describe in detail a data and method about the validation of the indicator. In Section 5, we show the results of validation analysis by using two regression models. Finally, in Section 6, we discuss the results and conclude with implications and suggestions for future research.
2. Literature review
Scholars in various disciplines have defined novelty as the recombination of pre-existing knowledge components in an unprecedented manner (Schumpeter, 1939; Nelson and Winter, 1982; Romer, 1994;
Wang et al., 2017). Studies on combinatorial novelty have been progressed especially in the technological invention literature. Several studies have demonstrated that new combinations of existing knowledge components provide a potentially huge source of important new discoveries (Fleming, 2001; Uzzi et al.
2013; Verhoeven et al. 2016).
In previous studies, some indicators that focus on new combinations of knowledge sources are proposed to assess the novelty of research. Combinations of knowledge are usually measured with pairs of reference papers, journals, or keywords as a unit. For example, Dahlin and Behrens (2005) introduced an indicator quantifying how unusual combinations of references, i.e., combinations of knowledge sources, in a focal publication overlap with pre-existing combinations in the knowledge domain, and measured technological radicalness with patent data on tennis rackets. Trapido (2015) adopted the measure of novelty from Dahlin and Behrens (2005) to test whether authors' past recognition for highly novel work leads to positive audience valuation for the same authors' new highly novel work. Uzzi et al. (2013) have examined the atypicality of referenced journal pairs in publications, showing that a paper rated highly for both novelty and conventionality is more likely to be highly cited. Uddin and Khan (2016) used a combination of usual and unusual keywords to explore new domains of knowledge and multidisciplinary domains.
As described above, while various novelty indicators have been proposed and used for empirical analysis so far, it is also important to check whether indicators really measure what they propose to measure, because using new indicators to evaluate research may affect researchers' behavior (Hicks et al., 2015).
Several recent empirical studies have validated novelty indicators. Based on interviews with the corresponding authors of breakthrough papers in the field of scientometrics, Tahamtan and Bornmann (2018) found that creative ideas might not always be inspired by past publications. Bornmann et al. (2019) have validated the two novelty indicators proposed by Uzzi et al. (2013) and Wang et al. (2017) with peer- review data from biomedical studies. They found that the novelty indicators of Uzzi et al. (2013) are in strong agreement with peer-review assessments, while the novelty indicators of Wang et al. (2017) don’t reflect peer-review assessments.
3
3. Proposed measure of novelty
To measure the novelty of individual scientific papers, we adopted an indicator of novelty based on the combination-based measure proposed by Dahlin and Behrens (2005). They proposed a method to assess the novelty of patents by quantifying the degree of citation similarity between a focal patent and prior arts in the same technological domain to capture unusual knowledge recombination. They referred to the degree of citation similarity as the overlap score. The overlap score OS𝑖𝑖𝑖𝑖 of two patents i and j is computed as the count of documents cited by both i and j, divided by the sum of unique citations by i or j (Dahlin and Behrens, 2005). They adopted the International Patent Classification (IPC) categories at the 3-digit level to define the same domain of patents. Trapido (2015) adopted the indicator to measure the novelty of scientific publications of electrical engineers specializing in information theory. He defined the domain by using both bibliometric and non-bibliometric information.
When applying Dahlin and Behrens’ indicators to a broader range of natural science papers, two aspects require a methodological consideration in the calculation of the novelty indicators. The first is which data is applicable to consistently define the domains of natural sciences (a choice of data). The second is how to define the domains used to compare citation similarity, because the fields of scientific papers are not classified into detailed units as in the case of the IPC categories (a definition of domains).
In this study, we introduce a means of defining the same domain using only bibliometric information. If we use bibliometric data, we have in common data sources covering a wide range of countries, fields and periods such as Thomson Reuters’ Web of Science (WoS) and Elsevier’s Scopus. On the contrary, in the case of non-bibliometric data (e.g., researchers’ CV), there is no large and common database equivalent to WoS or Scopus. Therefore, it is more difficult to collect non-bibliometric information than bibliometric information, especially in the case of novelty measurement of papers for multi-countries, -fields, and - periods. In this respect, bibliometric data would be the first choice to calculate a novelty indicator in any country, field, and period.
As for the definition of domains, we define same-domain papers by the following two conditions. First, they co-cite at least one reference of the focal paper. Second, their field classification completely matches that of the focal paper in terms of the smallest unit in the bibliometric database9. By the first condition, if the focal paper cites a paper commonly cited in various research fields, papers less relevant to the focal paper are likely to be included in the same domain. By applying the second condition, papers less relevant to the focal paper are removed from the same domain. Figure 1 shows the relationship between the focal paper and the same-domain paper.
9 In this study, we adopted the subject categories of the Web of Science from which the focal papers of our validation are extracted. All records in the Web of Science core collection are assigned one or more of the 254 subject categories
(https://images.webofknowledge.com/images/help/WOS/hp_subject_category_terms_tasca.html).
4
The overlap score OS𝑖𝑖𝑖𝑖 between focal paper i and same-domain paper j is defined as the set of papers cited by both i and j ([Ref]𝑖𝑖∩[Ref]𝑖𝑖), divided by the set that one or the other of them cites ([[Ref]𝑖𝑖∪ [Ref]𝑖𝑖) :
OS𝑖𝑖𝑖𝑖=[Ref]𝑖𝑖∩[Ref]𝑖𝑖 [Ref]𝑖𝑖∪[Ref]𝑖𝑖
The novelty score of a focal paper i is calculated by subtracting the mean overlap score for the same- domain papers from 1:
Novelty(𝑖𝑖) = 1−1
𝑛𝑛 �𝑛𝑛 OS𝑖𝑖𝑖𝑖
𝑖𝑖=1
This score has values between 0 and 1, where 0 indicates completely identical citation patterns and 1 indicates completely dissimilar citation patterns with the same-domain papers. More dissimilar citation patterns reflect novelty defined as the recombination of pre-existing knowledge components in an unprecedented manner (Schumpeter, 1939; Nelson and Winter, 1982; Romer, 1994; Wang et al., 2017).
Figure 1: Simplified illustration of the relation between focal paper and same-domain paper Notes. Three citation networks comprising a focal paper (the diamond), reference papers (the circles), and co-citing reference papers that match the field classification of the focal paper (rectangles). References may be cited only by the focal paper (i), by both the focal paper and its co-citing reference paper (j) or by just its co-citing reference paper (k). The dotted-line circles and rectangles are out of the citation window and not considered in the novelty measurement. The overlap score OS is defined as the set of papers cited by both the focal paper and its co-citing references (N(Rj)), divided by the set that either of them cites (N(Ri)+N(Rj)+N(Rk)).
Ri
Ri Rj
Rk reference
window
co-citing window
C
F
C
Rk
5
To measure novelty scores, two citation windows must be set. One is the reference window, which is the range of publication years of the papers cited by the focal paper. The other is the co-citing window, which is the range of publication years of the same-domain papers. This prompts the question of how long the optimal period for the two citation windows should be.
Firstly, we consider the reference window. In previous citation context studies for the purpose of characterizing the cited works, it is reported that highly-cited old papers are likely to be cited for the purpose of providing historical reasons or background discussion (Oppenheim and Renn, 1978; Ahmed et al., 2004). Therefore, the greater the number of old reference papers with less relevance to the focal paper’s core topic, increasing the possibility that papers less relevant to the focal paper will be included in the same-domain. Therefore, we suggest that shorter reference windows are preferable.
Secondly, we consider the co-citing window. The longer the co-citing window, the greater the number of cited papers—including older and less relevant publications. From the perspective of the life cycle of the research topic, the more the publication years deviate, the greater the possibility of including papers that are less relevant to the focal paper in the same-domain. Therefore, we suggest that the co-citing window should be short rather than long.
In this study, we tried to verify the novelty measure using four patterns of citation windows.
6
4. Data and Methods of Validation
4.1. Survey data
We used a survey of Japanese researchers to validate the novelty indicator. The survey was jointly conducted by the Institute of Innovation Research, Hitotsubashi University and the National Institute of Science and Technology Policy, from the end of 2009 to the early summer of 2010 (Nagaoka et al., 2010).
The survey data is utilized for various studies focus on the research knowledge creation process (Igami et al.
2015; Murayama et al. 2015; Lee et al. 2015; Walsh and Lee, 2015).
In the survey, about 2,100 researchers' responses10 were collected on articles published between 2001 and 2006 (Nagaoka et al., 2010). One-third of the survey sample consisted of highly cited papers (top 1% in the world) and the remainder were randomly selected papers. Stratified sampling was conducted for both the types of papers by science field and year. The survey’s focal paper was selected from among the articles recorded in Clarivate Analytics' Web of Science (Science Citation Index Expanded, SCIE), which largely contains research papers related to natural science.
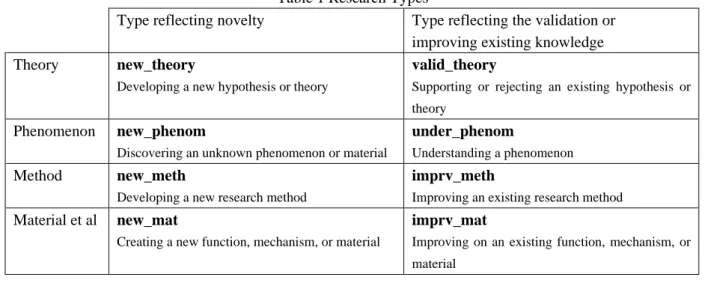
The survey included a self-assessment question about the types of research output of the focal paper. In this question, respondents rated the degree of relevance of the following types of research outputs on a scale of 1 to 5 (1: Not relevant at all to 5: Highly relevant). In this research, we adopted questions about the research types relevant to theory, phenomenon, method, and material. Among the research types listed below (see Table 1), “new_theory” and “valid_theory” (research types related to theory), “new_phenom”
and “under_phenom” (research types related to phenomenon), “new_meth” and “imprv_meth” (research types related to research method), and “new_mat” and “imprv_mat” (research types related to function, mechanism, or material) are paired. Research types with shortened names that contain the word “new”
reflect aspects of novelty in research. By comparing the results of validation of novelty indicator in pairs of research types, we can check whether the indicator is consistent with the researchers' subjective judgments.
Table 1 Research Types
Type reflecting novelty Type reflecting the validation or improving existing knowledge Theory new_theory
Developing a new hypothesis or theory
valid_theory
Supporting or rejecting an existing hypothesis or theory
Phenomenon new_phenom
Discovering an unknown phenomenon or material
under_phenom
Understanding a phenomenon
Method new_meth
Developing a new research method
imprv_meth
Improving an existing research method Material et al new_mat
Creating a new function, mechanism, or material
imprv_mat
Improving on an existing function, mechanism, or material
10 Of the 7,562 survey targets, 2,081 responses were received, making for a total response rate of 27%.
7
4.2. Bibliometric data for the measurement of novelty
We retrieved the data used in the novelty score computation from Clarivate Analytics’ Web of Science XML format. More specifically, We accessed the following files: the Science Citation Index Expanded (SCIE), Social Science Citation Index (SSCI), Arts and Humanities Citation Index (AHCI), Conference Proceedings Citation Index – Science (CPCI-S), and Conference Proceedings Citation Index - Social Sciences & Humanities (CPCI-SSH). Data were extracted from material published between 1981 and the end of 2018.
Regarding research fields, we adopted eight fields, aggregated from nineteenth ESI journal fields (except for Economic & Business, Social Science, General) : namely, 1) Chemistry, 2) Materials Science, 3) Physics & Space Science, 4) Computer Science & Mathematics, 5) Engineering, 6) Environment/Ecology
& Geosciences, 7) Clinical Medicine & Psychiatry/Psychology, and 8) Basic Life Sciences (Agricultural Sciences, Plant & Animal Science, Biology & Biochemistry, Immunology, Microbiology, Biology &
Biochemistry, Neuroscience & Behavior, and Pharmacology & Toxicology). For multidisciplinary papers, one of the twenty-two ESI journal fields was assigned based on backward citation.
In the validation analysis, we used the data of papers for which a valid answer was obtained for the self- assessment question, while excluding outlier novelty scores (i.e., papers for which the novelty scores are zero). The number of total observations was 1,871. We only conduct by-field validation analysis in fields with more than 150 papers in order to ensure more robust results. The following five fields are subject to by-field analysis: Chemistry, Materials Science, Physics and Space Science, Clinical Medicine and Psychiatry/Psychology, and Basic Life Sciences.
4.3. Validation Methods
Using Japanese self-assessment data, this study tests the convergent validity of a novelty indicator based on unusual knowledge combinations from two perspectives. First, this study verifies the consistency between the novelty score and self-assessments of the research types by eliminating the influence of field- specific features by using the data of all fields. Second, this study analyzes each field in order to clarify field-specific features.
To test the robustness of our validation findings, we adopt two regression models: the ordered logit regression model and the ordinary least squares (OLS) regression model. Further, we uses the novelty scores measured by the four citation windows: namely, two reference windows (1981 to the focal paper’s publication year, and the ten years prior to the focal paper’s publication) and two co-citing windows (the same period for the reference window and the three years prior to the focal paper’s publication). The regression models and results are detailed in the next section.
8
5. Results and Discussion
5.1. Descriptive Statistics
5.1.1. Novelty scores
Table 2.1 presents the summary statistics of the novelty scores of all fields for each of the four citation window. As shown in Table 2.1, the longer reference window leads to higher novelty score. This novelty score behavior is consistent with our previous argument. Longer reference window will increase the possibility of the inclusion of papers those are less relevant to the focal paper in the same-domain and this will result in the higher novelty score, i.e., lower overlap score, of the focal papers.
Table 2.1 Descriptive statistics of novelty across all fields citation window pattern
reference window co-citing window
(1) all 3years
(2) all all
(3) 10years 3years
(4) 10years all
Mean 0.948 0.950 0.933 0.933
Std. Dev. 0.051 0.048 0.065 0.064
Min 0.471 0.500 0.333 0.333
Max 0.996 0.996 0.998 0.995
Obs 1,871 1,871 1,871 1,871
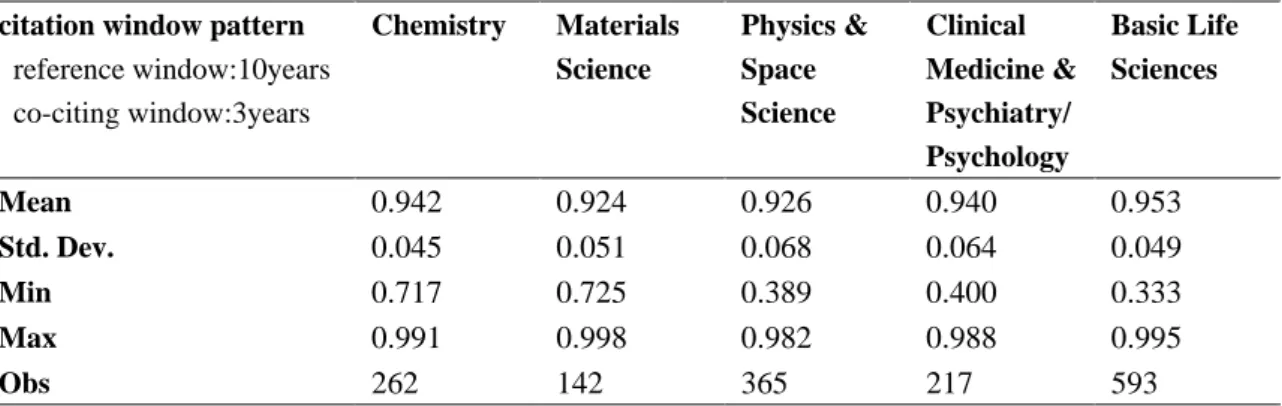
Table 2.2 shows the summary statistics of the novelty scores of each field for each the ten-year reference window and three-year co-citation window. According to results, focal papers in basic life science received higher score (the mean of basic life science: 0.953), materials science and physics & space science received lower scores (the mean of materials science: 0.924, the mean of physics & space science: 0.926). This tendency was also confirmed in other citation windows. The descriptive statistics of novelty scores of each field in other citation windows are listed in the appendix 1.
Table 2.2 Descriptive statistics of novelty in individual fields citation window pattern
reference window:10years co-citing window:3years
Chemistry Materials Science
Physics &
Space Science
Clinical Medicine &
Psychiatry/
Psychology
Basic Life Sciences
Mean 0.942 0.924 0.926 0.940 0.953
Std. Dev. 0.045 0.051 0.068 0.064 0.049
Min 0.717 0.725 0.389 0.400 0.333
Max 0.991 0.998 0.982 0.988 0.995
Obs 262 142 365 217 593
9
5.1.2. Relevant degrees of research types by researchers' self-assessments
Table 3.1 presents the summary statistics of the degree of relevance for each research type. According to results, respondents gave higher scores to “under_phenom” (3.718) and “new_theory” (3.502), and lower scores to “imprv_mat” (2.370), and “new_mat” (2.795).
Table 3.1 Descriptive statistics of the relevant degrees of research types across all fields Research
Type
new_
theory
valid_
theory
new_
phenom
under_
phenom
new_
meth
imprv_
meth
new_
mat
imprv_
mat Mean 3.502 3.303 3.095 3.718 3.097 2.904 2.795 2.370 Std. Dev. 1.279 1.259 1.451 1.198 1.338 1.247 1.518 1.272 Notes. The minimum and maximum measures and the number of observations are the same for all research types. The minimum relevance is 1, while the maximum is 5. Results are based on a total of 1,871 observations.
As Table 3.2 shows, results reveal similarities and differences between fields in respect to the degree of relevance of each research type. Regarding similarities by field, the research type of “under_phenom”
received higher scores while the research type of “imprv_mat" received lower scores. Differences by field are revealed in the two research types: “new_mat” and “new_theory”. In the fields of Chemistry and Materials science, respondents gave higher scores to “new_mat”. In the three fields of Physics & Space Science, Clinical Medicine & Psychiatry/Psychology, and Basic Life Sciences, respondents gave higher scores to “new_theory”.
In addition, we describe box plots of the novelty indicators in a 10 year-reference window and a 3 year co-citation window for each researcher’s self-assessments of research type in Appendix 2.
Table 3.2 Descriptive statistics of the relevant degrees of research types in each field
Field new_
theory
valid_
theory
new_
phenom
under_
phenom
new_
meth
imprv_
meth
new_
mat
imprv_
mat Mean Chemistry 3.294 3.015 3.485 3.599 3.553 3.084 3.557 2.729
Materials Science 3.183 3.070 3.254 3.732 3.338 2.859 3.676 3.148 Physics & Space Science 3.479 3.622 3.121 3.814 3.381 3.088 2.677 2.362 Clinical Medicine &
Psychiatry/Psychology 3.516 3.290 2.700 3.525 2.585 2.594 2.410 2.230 Basic Life Sciences 3.678 3.325 3.298 3.840 2.777 2.757 2.828 2.298 Std. Dev. Chemistry 1.257 1.184 1.333 1.186 1.230 1.254 1.426 1.259 Materials Science 1.330 1.270 1.376 1.123 1.388 1.164 1.308 1.232 Physics & Space Science 1.315 1.264 1.423 1.188 1.275 1.206 1.443 1.278 Clinical Medicine &
Psychiatry/Psychology 1.251 1.160 1.449 1.167 1.289 1.274 1.531 1.259 Basic Life Sciences 1.224 1.247 1.429 1.148 1.297 1.228 1.444 1.178 Notes. The minimum and maximum are the same for all research types and fields. The minimum degree of relevance is 1, while the maximum is 5. The following number of observations were recorded for each field: Chemistry, 262; Materials Science,142; Physics and Space Science, 365; Clinical Medicine and Psychiatry/Psychology, 217; and Basic Life Sciences, 593.
10
5.2. Regression results
5.2.1. Results of All fields
Firstly, the results of the ordered logit regression models for the four citation windows are presented in Table 4.1. We use an ordered logit regression model with robust standard errors, one independent variable and two dummy variables. The dependent variable is the degree of relevance of each research output type (e.g., “new_theory” or “valid_theory”) as rated on a five-point scale ranging from 1: “Not relevant” to 5:
“Highly relevant,” while the independent variable is the novelty score. Additionally, we controlled for publication year and field with dummy variables.
Table 4.1 Ordered logit regression results of convergent validity between researchers’ self-assessment of research types and novelty indicators in the four citation window patterns across all fields
Independent Variables=Novelty
Window Pattern 1 Window Pattern 2 Window Pattern 3 Window Pattern 4
reference window all all 10years 10years
co-citing window 3years all 3years all
Dependent Variables
(Research Type)
new_theory 0.078 0.096 * 0.107 ** 0.118 **
(1.70) (2.00) (2.67) (2.87)
valid_theory 0.097 * 0.085 0.106 ** 0.083 *
(2.29) (1.89) (2.58) (2.02)
new_phenom 0.097 ** 0.11 ** 0.12 *** 0.139 ***
(2.91) (3.14) (3.73) (4.22)
under_phenom 0.063 0.083 0.091 * 0.102 *
(1.43) (1.95) (2.06) (2.30)
new_meth 0.028 0.047 0.071 * 0.085 *
(0.79) (1.31) (2.02) (2.39)
imprv_meth -0.053 -0.044 -0.037 -0.035
(-1.39) (-1.12) (-0.93) (-0.84)
new_mat 0.065 0.07 0.1 ** 0.104 **
(1.74) (1.75) (2.99) (2.95)
imprv_mat -0.037 -0.035 -0.031 -0.034
(-0.98) (-0.90) (-0.87) (-0.92)
Notes:
1) *** p < 0.001, ** p < 0.01, * p < 0.05. All coefficients are standardized.
2) Robust statistics are shown in parentheses.
3) The models are controlled for publication year and field with dummy variables.
4) A total of 1,871 observations were collected for all the research types and window patterns.
11
Secondly, Table 4.2 shows the results of the OLS regression models with robust standard errors for the four citation windows. All coefficients in the table are standardized beta coefficients. The same dependent and independent variables as in the ordered logit regression models were used for the OLS regression models.
Table 4.2 OLS regression results of convergent validity between researchers’ self-assessment of research types and novelty indicators in the four citation window patterns across all fields
Independent Variables=Novelty
Window Pattern 1 Window Pattern 2 Window Pattern 3 Window Pattern 4
reference window all all 10years 10years
co-citing window 3years all 3years all
Dependent Variables
(Research Type)
new_theory 0.058 * 0.071 * 0.079 ** 0.085 **
(1.99) (2.33) (2.89) (3.09)
valid_theory 0.064 * 0.055 0.069 ** 0.054 *
(2.31) (1.95) (2.60) (2.02)
new_phenom 0.076 ** 0.084 *** 0.093 *** 0.108 ***
(3.24) (3.52) (4.01) (4.72)
under_phenom 0.04 0.052 0.061 * 0.066 *
(1.42) (1.86) (2.11) (2.34)
new_meth 0.023 0.036 0.053 * 0.062 *
(0.93) (1.42) (2.19) (2.51)
imprv_meth -0.035 -0.03 -0.026 -0.023
(-1.41) (-1.14) (-0.98) (-0.86)
new_mat 0.045 0.047 0.075 ** 0.077 **
(1.68) (1.67) (3.23) (3.17)
imprv_mat -0.027 -0.026 -0.024 -0.026
(-1.10) (-1.05) (-1.01) (-1.08)
Notes:
1) *** p < 0.001, ** p < 0.01, * p < 0.05. All coefficients are standardized beta coefficients.
2) Robust statistics are shown in parentheses.
3) The models are controlled for publication year and field with dummy variables.
4) A total of 1,871 observations were collected for all the research types and window patterns.