Linkages Between Dynamic Phytoplankton C:N:P and the Ocean Carbon Cycle Under Climate Change
By Katsumi Matsumoto, Tatsuro Tanioka, and Rosalind Rickaby
INTRODUCTION
The world ocean holds vastly more car- bon than the atmosphere (~60 times more during preindustrial times). Therefore, a relatively small change in the oceanic car- bon inventory can lead to a large change in atmospheric pCO2 and thus in global cli- mate. Also, the large capacity of the ocean to store carbon means that perturbations to atmospheric pCO2 can be damped by the ocean through air-sea CO2 exchange.
The timescale of change for the ocean spans decades to centuries, much longer than those for the atmosphere or the land
biosphere. Thus, the ocean has long been considered key to understanding global carbon cycle changes that occurred over glacial-interglacial timescales and that are likely to occur on decadal to centen- nial timescales in the future.
One of the important drivers of the ocean carbon cycle is the biological pump, the vertical transport of carbon from the surface to the deep ocean by sinking particulate organic matter (POM). This carbon export process can sequester car- bon in the ocean interior for centuries until overturning circulation returns it to
the surface. As Broecker (1982) first pro- posed, changes in the strength of the bio- logical pump can alter the amount of car- bon sequestered in the ocean and has the potential to drive large variations in atmo- spheric pCO2. For example, strength- ening of the pump can reduce pCO2 and often requires increasing the oce- anic inventories or surface supply rates of limiting nutrients such as phosphorus (Broecker, 1982), nitrogen (Falkowski, 1997), and iron (Martin, 1990). Here, we aim to examine a new twist to the biolog- ical pump under climate change, namely, how flexible elemental stoichiometry of phytoplankton modifies carbon export as the marine environment changes. This idea was originally suggested by Peter Weyl to Broecker (1982) in the context of glacial pCO2 and subsequently men- tioned infrequently in the literature. Our goal in this work is to introduce how this twist might manifest under glacial con- ditions (Matsumoto et al., 2020) as well as under future warming conditions (recent work of authors Matsumoto and Tanioka), for which environmental driv- ers are arguably more easily understood.
REDFIELD RATIO AND FLEXIBLE C:N:P
The possibility that phytoplankton stoi- chiometry of carbon, nitrogen, and phos- phorus (C:N:P) could be flexible on an ocean basin scale has not been consid- ered seriously until recently. The stabil- ABSTRACT. Modelers of global ocean biogeochemistry are beginning to represent a
phenomenon that biologists have long observed in laboratory and field settings: that the elemental stoichiometry of phytoplankton is quite flexible. Today, it is well recog- nized that the C:N:P ratio in phytoplankton and particulate organic matter can vary substantially on ocean basin scales. Recent data show that, compared to the traditional Redfield ratio C:N:P = 106:16:1, the ratio is much higher in the oligotrophic subtropical gyres (~195:28:1) and much lower in eutrophic polar waters (~78:13:1). This pattern of variability, informed by results from phytoplankton incubation experiments, indicates that environmental factors such as nutrient availability and temperature are import- ant drivers. Our model simulations of the global ocean carbon cycle under global warming and glacial conditions suggest that phytoplankton physiology and commu- nity composition control global C:N:P export. Model results also indicate the import- ant role that Southern Ocean sea ice plays in determining the global export stoichi- ometry by altering the proportional contribution of Southern Ocean phytoplankton to global production. Sea ice retreat under warming and expansion under glaciation, while opposite in sign, can both elevate the global export C:N:P ratio by altering phyto- plankton physiology and community composition in contrasting ways between each scenario. The global mean export C:N:P ratio increases from 113:16:1 in the control run to 119:17:1 by the year 2100 in the future run and to 140:16:1 in the glacial run.
The impact of higher export C:N:P ratios is to strongly buffer carbon export against change for both scenarios.
SPECIAL ISSUE ON PALEOCEANOGRAPHY: LESSONS FOR A CHANGING WORLD
ity of the C:N:P ratio has been a central tenet of chemical oceanography since the seminal work by Redfield (1934). He dis- covered that the stoichiometry in plank- ton and seawater was very similar. The so-called Redfield ratio of marine organic matter is C:N:P = 106:16:1 (Redfield et al., 1963). Later, L.A. Anderson (1995) extended it to oxygen, –O2:P = –150:1.
The Redfield ratio is very useful in studies of ocean carbon budgeting, and chemical oceanographers have long assumed the Redfield ratio or some variations of it to be fixed. For example, just a decade ago the international modeling community used a fixed ratio in the Ocean Carbon Cycle Model Intercomparison Project (Najjar et al., 2007). However, biologists have long known plankton stoichiome- try to be quite variable in individual cells.
Indeed, Redfield himself noted stoichio- metric flexibility. Furthermore, a strict C:N:P ratio does not seem to be sup- ported by any obvious physiological or biochemical underpinning (Geider and La Roche, 2002).
In recent years, evidence has been mounting of substantial variability in the stoichiometry of phytoplankton and par- ticulate organic matter (POM), even at the ocean basin scale. For example, Martiny et al. (2013) find a clear global pattern that shows an elevated C:N:P ratio of 195:28:1 in the subtropical gyres, 137:18:1 in the warm upwelling zones, and 78:13:1 in the nutrient-rich polar regions (Table 1). An inverse model of ocean biogeochemis- try also inferred a similar spatial pattern of global C:N:P ratio (Teng et al., 2014;
Wang et al., 2019). This variability is not fully understood, but nutrient availabil- ity, especially that of phosphate, is clearly recognized as a driver. Also, stoichiomet- ric measurements on different taxa reveal that eukaryotes have relatively low C:N:P, more consistent with the Redfield ratio, which is perhaps not surprising given that Redfield’s original measurements were made on eukaryotes. Modern measure- ments on much smaller cyanobacteria, not yet discovered in Redfield’s day, show distinctly higher ratios, with C:P as high
as 350 and N:P as high as 50.
Today, the global ocean modeling community is transitioning from fixed to dynamic stoichiometry for phyto- plankton. For example, the stoichiomet- ric flexibility represented by the state of the art CMIP5/6 models range from none at all (i.e., fixed C:N:P) to partial flexi- bility (e.g., flexible C:P but fixed C:N) to full flexibility (Bopp et al., 2013; Arora et al., 2019). This flexibility has import- ant implications not only for the gla- cial carbon cycle but also for future uptake of anthropogenic carbon by the ocean. For example, the traditional view of the future biological carbon pump is that it will become weaker as warming enhances ocean stratification and reduces the vertical supply of nutrients from the subsurface to the sunlit surface layer.
However, the concept of flexible stoichi- ometry allows for the possibility that the biological carbon pump may remain rela- tively unperturbed in the face of reduced nutrient supply because the reduction should lead to higher phytoplankton C:P.
In other words, changes in phytoplank- ton stoichiometry could buffer carbon export against change. Previous mod- eling studies indicate that the ocean’s capacity to uptake anthropogenic carbon in the future due to variable C:P alone is quantitatively modest (Tanioka and Matsumoto, 2017).
A major challenge in transitioning to a more fully flexible phytoplankton C:N:P ratio in ocean biogeochemical models is the deficiency in understanding which environmental factors drive the flexi- bility. A cursory survey of the literature does not give a clear picture (e.g., Moreno and Martiny, 2018). There are numerous reports of laboratory incubation experi- ments that indicate phytoplankton stoi- chiometry dependence with a conflicting sense of change (e.g., how temperature affects C:N:P ratio). Also, different stud- ies target different strains of algae, often under dissimilar conditions.
In order to overcome this challenge, we conducted an exhaustive meta- analysis of laboratory studies of marine
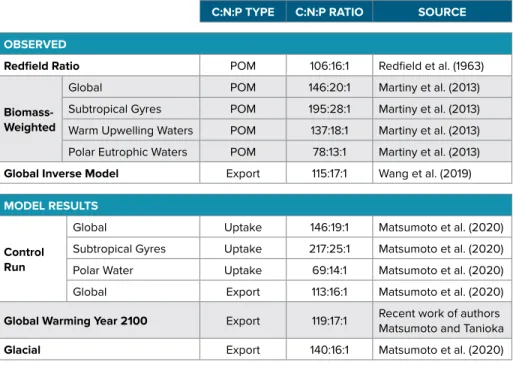
TABLE 1. Observed and modeled C:N:P stoichiometry.
C:N:P TYPE C:N:P RATIO SOURCE OBSERVED
Redfield Ratio POM 106:16:1 Redfield et al. (1963)
Biomass- Weighted
Global POM 146:20:1 Martiny et al. (2013)
Subtropical Gyres POM 195:28:1 Martiny et al. (2013) Warm Upwelling Waters POM 137:18:1 Martiny et al. (2013) Polar Eutrophic Waters POM 78:13:1 Martiny et al. (2013) Global Inverse Model Export 115:17:1 Wang et al. (2019) MODEL RESULTS
Control Run
Global Uptake 146:19:1 Matsumoto et al. (2020)
Subtropical Gyres Uptake 217:25:1 Matsumoto et al. (2020)
Polar Water Uptake 69:14:1 Matsumoto et al. (2020)
Global Export 113:16:1 Matsumoto et al. (2020)
Global Warming Year 2100 Export 119:17:1 Recent work of authors Matsumoto and Tanioka
Glacial Export 140:16:1 Matsumoto et al. (2020)
POM = Particulate organic matter/phytoplankton. Wang et al. (2019) provide a data-constrained, global N:P export ratio of 17.3:1 and assume a fixed C:N = 106:16 to calculate the C:P ratio. In the model, the uptake C:N:P ratio is the net primary production (NPP)-weighted, spatially averaged, community phytoplankton uptake ratio over the top 100 m. The export C:N:P ratio in the model is the NPP-weighted, spatially averaged export ratio calculated at 100 m water depth. For data/model comparison, ratios measured for POM should be compared to model uptake ratios.
phytoplankton stoichiometry (Tanioka and Matsumoto, 2020). Meta-analysis is a powerful statistical framework for syn- thesizing independent studies and identi- fying trends, and it follows rigorous for- mal protocols to ensure reproducibility and reduce bias. We analyzed 241 exper- imental units of P:C and 366 experimen- tal units of N:C from 104 journal articles encompassing seven taxonomic phyla.
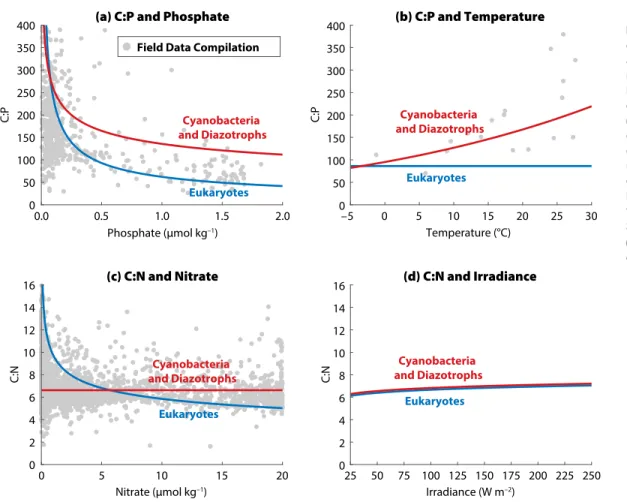
Figure 1 illustrates the main findings of the meta-analysis regarding the sensitiv- ities of C:P and C:N uptake as functions of phosphate, nitrate, light, and tempera- ture. Sensitivity to iron was included in the meta-analysis but is excluded here due to a significant but very small signal that was seen in only one class of phyto- plankton. Our meta-analysis confirmed that C:P increases as P becomes more limiting (Figure 1a) and also as tem- perature rises (Figure 1b). Additionally, C:N increases as N becomes more lim- iting (Figure 1c) and as light increases (Figure 1d). The meta-analysis shows
that the stoichiometric sensitivities differ in terms of their statistical significance, magnitude, and universality across differ- ent taxonomic groups. For example, the effect of phosphate on C:P is much larger for eukaryotes than for other phytoplank- ton types examined, and the effect of temperature is not statistically significant in eukaryotes. The interested reader is referred to the meta-analysis in Tanioka and Matsumoto (2020) for a discussion of the underlying biochemical reasons.
With global warming, water tempera- tures will rise, and the water column will likely stratify more strongly, providing more light to phytoplankton in a thin- ner mixed layer and resulting in reduced vertical supply of phosphate and nitrate to the surface. According to the sensitiv- ities of the C:P and C:N ratios (Figure 1), these environmental changes will elevate C:P or C:N so that phytoplankton should become more carbon rich. In this simple thought experiment then, higher carbon content in phytoplankton should lead to
greater carbon export, but coupled with lower overall productivity, global carbon export will be buffered into the future.
FLEXIBLE C:N:P IN THE CONTROL MODEL RUN
Whether and how much this stoichio- metric buffering occurs in a more realistic setting can be explored by implementing the C:P and C:N sensitivities shown in Figure 1 in a global model of ocean bio- geochemistry. We have employed a coarse resolution three- dimensional Earth sys- tem model called MESMO (Minnesota Earth System Model for Ocean biogeo- chemistry; Matsumoto et al., 2013) for this purpose. Details of the implemen- tation are available in Matsumoto et al.
(2020). Here, we note briefly that three phytoplankton functional types (PFTs) are represented in the flexible C:N:P- enabled MESMO: eukaryotes, cyanobac- teria, and diazotrophs. Eukaryotes, which include diatoms, are fast and opportu- nistic growers, especially under nutrient
(a) C:P and Phosphate
Cyanobacteria and Diazotrophs
Eukaryotes
0.0 0.5 1.0 1.5 2.0
Phosphate (µmol kg–1) 0
50 100 150 200 250 300 350 400
C:P
Field Data Compilation
(b) C:P and Temperature
Eukaryotes
–5 0 5 10 15 20 25 30
Temperature (°C) 0
50 100 150 200 250 300 350 400
C:P
(c) C:N and Nitrate
Eukaryotes
0 5 10 15 20
Nitrate (µmol kg–1) 0
2 4 6 8 10 12 14 16
C:N
(d) C:N and Irradiance
Eukaryotes
25 50 75 100 125 150 175 200 225 250 Irradiance (W m–2)
0 2 4 6 8 10 12 14 16
C:N
Cyanobacteria and Diazotrophs
Cyanobacteria and Diazotrophs Cyanobacteria
and Diazotrophs
FIGURE 1. C:P and C:N ratios of three phytoplankton groups as functions of four environ- mental drivers with sensitiv- ities from the meta-analysis of Tanioka and Matsumoto (2020). In each panel, only one driver is changed while others are kept constant at reference values. The gray dots are C:P and C:N data of bulk particulate organic mat- ter from the field. (a) and (c) from Galbraith and Martiny (2015) and (b) from Yvon- Durocher et al. (2015)
replete conditions. Cyanobacteria such as Prochlorococcus and Synechococcus are smaller cells that do well in oligo- trophic waters. Diazotrophs are nitro- gen fixers that exhibit slow growth rates but are not limited by nitrate. The growth patterns of these PFTs are limited by tem- perature, light, and different combina- tions of nutrients (P, N, Fe, and Si). Base model states for the three PFTs, including nutrient limitation maps, are presented in Matsumoto et al. (2020). In the model, the base C:N:P ratio is set lower for eukary- otes and higher for the other two PFTs as observed, and the three PFTs are given different C:N:P sensitivities, according to the meta-analysis findings. For example, all PFTs have C:P dependence on phos- phate, but eukaryotes are the most sensi- tive compared to the others.
The MESMO control run, prescribed with preindustrial boundary condi- tions and described by Matsumoto et al.
(2020), shows a number of features that indicate good starting points for explor-
ing the effect of flexible stoichiometry on the ocean carbon cycle (Figure 2).
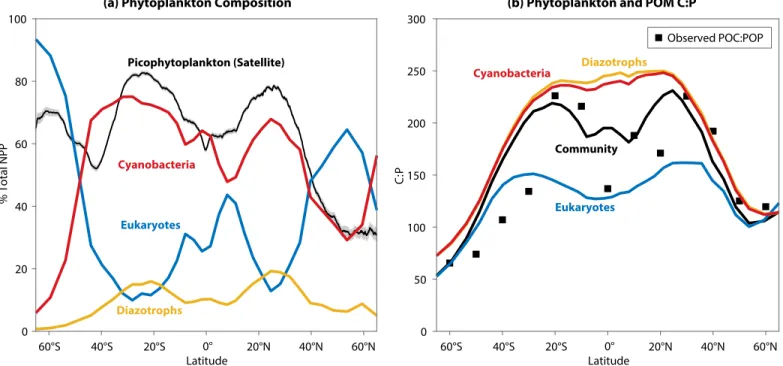
For example, in the oligotrophic sub- tropical gyres of the model, where car- bon export production is low, cyanobac- teria are dominant (Figure 2a) and C:P is high (Figure 2b). The phytoplankton community C:P is high in the subtropi- cal gyres, because low phosphate concen- trations elevate the C:P ratio for all PFTs and because cyanobacteria make the largest contribution to the community.
In contrast, the community C:P is low in eutrophic and polar waters because the nutrient replete conditions reduce C:P in all PFTs and eukaryotes are dom- inant. Community C:P in our model is largely consistent with the observed C:P ratio of particulate organic matter on the global scale (compare black line and squares in Figure 2b).
Globally, the control model predicts C:N:P uptake of 102:14:1 for eukary- otes and much higher uptake ratios for cyanobacteria and diazotrophs
(C:N:P = 198–213:23–32:1) within the production layer. The global mean phyto- plankton community C:N:P uptake ratio is 146:19:1 (Table 1). The model predicts the highest C:N:P uptake ratio in the top- most level within the production layer, because the surface is where nutrients are most depleted and light levels and temperatures are the highest. The C:N:P uptake ratio becomes lower with depth in the production layer. Export C:N:P ratio at any site reflects the uptake ratios car- ried by POM formed at different levels within the production layer. The model currently includes no preferential rem- ineralization of different elements. The global mean export C:N:P in the control model is 113:16:1, which is close to the Redfield ratio (Table 1). The difference between the phytoplankton uptake ratio and the export ratio is thus a consequence of having an environment-driven, flexible stoichiometry. Such a difference does not manifest in the model where phytoplank- ton C:N:P uptake ratio is fixed.
(a) Phytoplankton Composition
Eukaryotes Cyanobacteria
Diazotrophs
Picophytoplankton (Satellite)
60°S 40°S 20°S 0° 20°N 40°N 60°N
Latitude 60°S 40°S 20°S 0° 20°N 40°N 60°N
Latitude 0
20 40 60 80 100
% Total NPP
(b) Phytoplankton and POM C:P
Eukaryotes Cyanobacteria Diazotrophs
Community
0 50 100 150 200 250 300
C:P
Observed POC:POP
FIGURE 2. Annual mean properties in the control model for the top 100 m of the water column. (a) Zonally averaged, net primary production (NPP)- weighted phytoplankton community composition. The three phytoplankton functional types (PFTs) represented in the model are eukaryotes (blue), cya- nobacteria (red), and diazotrophs (yellow). The black line is the remotely sensed contribution of picophytoplankton (0.5–2 µm) to total carbon-based biomass (Kostadinov et al., 2016). (b) Zonally averaged C:P uptake ratios for each PFT (colored lines) and the NPP-weighted community C:P (black line).
The community C:P would be reflected in the C:P ratio of organic particles. Black squares are based on data from C:P from Martiny et al. (2013).
FLEXIBLE C:N:P UNDER GLOBAL WARMING
All future MESMO simulations are car- ried out under a new “middle-of-the road” scenario for future warming called the Shared Socioeconomic Pathway 2 (Riahi et al., 2017). The summary pre- sented here is based on multiple sensitivity model experiments carried out recently by authors Matsumoto and Tanioka. The model simulates typical climate warm- ing features that include warming of sur- face air and sea surface, slowdown of the Atlantic meridional overturning circula- tion, and shallower mixed layer and sea ice retreat in polar waters. Radiative forc- ing stabilizes at ~4.5 Wm–2 with pCO2 at around 600 µatm by the year 2100. We
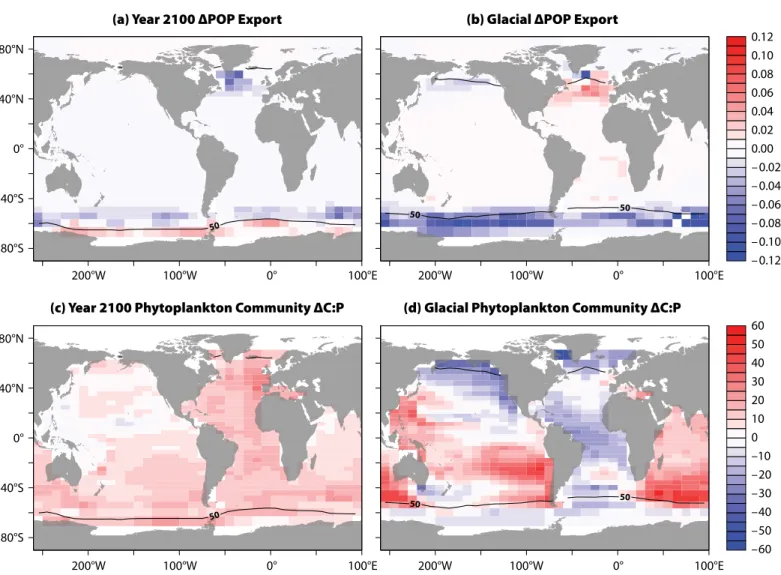
show results from our global warming simulation for the year 2100. There are two important drivers of global export C:N:P changes in our model simula- tion. First, global sea ice coverage retreats from approximately 10% to 6.5%, leading to enhanced biological production in the previously ice-covered Southern Ocean (Figure 3a). This has the effect of deplet- ing surface nutrients there, thus elevat- ing the C:N:P of all Antarctic PFTs and increasing the Southern Ocean’s con- tribution to global production. Second, higher temperatures increase the C:P ratio for cyanobacteria and diazotrophs.
This temperature effect has a significant impact on community C:P outside the Southern Ocean (Figure 3c).
In the warming simulation, the global mean export C:N:P increases for two main reasons. First, physiologically, the global mean C:N:P for eukaryotes increases because of the large reduction in nutrient availability in the Southern Ocean. The same effect is simulated for cyanobacteria and diazotrophs but is smaller due to their lower C:P sensitiv- ities to phosphate limitation. Outside the Southern Ocean, where the nutri- ents were already much lower or even close to being completely depleted, the temperature effect on cyanobacteria and diazotroph C:P becomes large. The sec- ond reason that the global export C:N:P rises is the change in regional production.
While biological production declines
(a) Year 2100 ΔPOP Export (b) Glacial ΔPOP Export
(c) Year 2100 Phytoplankton Community ΔC:P (d) Glacial Phytoplankton Community ΔC:P 80°N
40°N
0°
40°S
80°S
0.12 0.10 0.08 0.06 0.04 0.02 0.00 –0.02 –0.04 –0.06 –0.08 –0.10 –0.12
60 50 40 30 20 10 0 –10 –20 –30 –40 –50 –60 80°N
40°N
0°
40°S
80°S
200°W 100°W 0° 100°E 200°W 100°W 0° 100°E
200°W 100°W 0° 100°E 200°W 100°W 0° 100°E
50
50 50
50
50 50
FIGURE 3. Experiment-minus-control changes under global warming and glacial conditions. The change in particulate organic phosphorus (ΔPOP) export (mole-P m–2 yr–1) for (a) year 2100, and (b) glacial. Phytoplankton community ΔC:P (molar ratio) for (c) year 2100 and (d) glacial. The black line indi- cates mean annual sea ice coverage of 50% (e.g., 100% coverage for half a year) predicted by the model under prevailing climate conditions.
globally (due generally to increased strat- ification), the Southern Ocean is anom- alous in showing an increase in produc- tion as sea ice retreats. As noted above, the strong, nutrient-driven physiolog- ical response of Antarctic phytoplank- ton stoichiometry, especially by eukary- otes, makes a larger contribution to the global mean. In other words, the stoichi- ometry of the PFTs from the more pro- ductive waters would make a larger con- tribution to the global mean than the stoichiometry of the PFTs from less pro- ductive waters. Interestingly, the shift in community composition under global warming is modest and has little effect on global C:N:P. As expected, a shift in favor of the smaller cyanobacteria occurs at the expense of the larger eukaryotes in the model, as nutrients generally become more depleted. However, the shift is only
~3% globally. In an earlier modeling study with a very different formulation of flexible stoichiometry, Kwiatkowski et al. (2018) also found a similar taxo- nomic shift by ~2% by the year 2100 and attributed 95% of the global change in C:N:P to physiology.
Under the warming scenario adopted here, MESMO predicts that the global export C:N:P ratio increases from 113:16:1 in the preindustrial state to 119:17:1 by the year 2100 (Table 1).
During this period, the global P export by particles (POP) declines by 14%. In a separate model run where phytoplank- ton C:N:P was fixed, the global carbon export declined by the same proportion as P export, as expected. However, the simulated carbon export decline is only 10% with flexible stoichiometry export.
The stoichiometric buffering effect (BE) of carbon export can be quantified as
BE = (1 – 1 – fPOC1 – fPOP )× 100,
where fPOC and fPOP are the frac- tional changes in particulate organic car- bon (POC) and POP since preindustrial times. In this case, 1 – fPOC = 0.10 and 1 – fPOP = 0.14. BE is thus 30%. As export C:N:P increases under warming, it facili-
tates a larger uptake of anthropogenic carbon under the prescribed atmospheric pCO2. However, the net transport of air- sea CO2 flux is driven overwhelmingly by the prescribed pCO2 itself (i.e., large air-sea pCO2 gradient), so that the effect of flexible C:N:P on anthropogenic car- bon is quantitatively insignificant. In our study, the extra anthropogenic car- bon uptake due to a higher export C:N:P ratio is just ~1% by the year 2100, sim- ilar to the estimate of 0.5%–3.5% by Kwiatkowski et al. (2018).
FLEXIBLE C:N:P UNDER GLACIAL CONDITIONS
We find that the lessons gleaned for the global warming case are generally appli- cable to the glacial model simulation.
In the glacial simulation, the same flex- ible C:N:P-enabled ocean model was sub- ject to five conditions that are often used in glacial model studies: larger land ice (albedo), reduced radiative forcing from greenhouse gases, insolation changes due to Earth’s orbital parameters, increased dust deposition, and weaker Southern Hemisphere westerly winds. A whole suite of glacial model runs with vari- ous sensitivities indicated are described in detail in Matsumoto et al., 2020 and are used to draw the general conclusions summarized here.
In the glacial simulation, the applica- tion of ice albedo and radiative forcing substantially cools the planetary surface (>5°C in global mean surface air tem- perature) and has the important effect of expanding the polar sea ice by 64%.
In stark contrast to the global warming simulation, the increase in sea ice under glacial conditions has the effect of dra- matically reducing biological produc- tion in the Southern Ocean (Figure 3b).
This reduced contribution in turn leads to an increase in the global export C:N:P, because the Southern Ocean with high nutrients (which drives C:N:P lower) and eukaryote-dominated PFTs (which, again, drives C:N:P lower) now has a reduced influence on the global mean.
A comparison of sensitivity runs with
and without glacial dust flux demon- strates that the increased dust deposition in the glacial model run also has import- ant consequences for global export C:N:P through a chain of events. Iron from dust has a direct fertilization effect on PFTs in places where Fe is limiting. More critically for this study, the iron input impacts the physiology of diatoms as previously sug- gested in the silicic acid leakage hypoth- esis (Matsumoto et al., 2002), which pre- dicts that increased iron availability will reduce the Si:N uptake ratio of diatoms, leaving silicic acid underutilized in much of the world’s surface ocean. As theorized, this relieves the severe silicic acid limita- tions that diatoms exhibit in the control model run. As a result, production by the eukaryote PFT is enhanced outside areas of expanded sea ice. Global eukary- ote carbon export thus increases substan- tially from 3.6 Pg-C yr–1 to 6.3 Pg-C yr–1. This eukaryote growth comes at the expense of cyanobacteria growth and depletes surface nutrients because eukaryotes have high growth rates. As a consequence, global mean surface phos- phate concentration decreases from 0.31 µmol-P kg–1 to 0.26 µmol-P kg–1 in the model, although phosphate in polar waters increases because the expanded sea ice suppresses biological produc- tion. Interestingly, in our model, nitrate becomes decoupled from phosphate in the Southern Ocean surface waters by showing a decline. In the model, the nitrate decline reflects a reduction in the global nitrate inventory, a consequence of weaker southern westerlies reducing deep ocean ventilation, enhancing deox- ygenation, and finally promoting a faster rate of denitrification.
The chain of events triggered by the glacial iron input has two important impacts on global C:N:P. First, the deple- tion of nutrients elevates the C:N:P uptake ratio according to the sensitivities of C:P and C:N illustrated in Figure 1. This phys- iological response is strongest in eukary- ote C:P, which increases everywhere out- side the polar waters. The global mean C:N:P for eukaryotes thus increases from
102:14:1 to 152:16:1. Cyanobacteria and diazotrophs exhibit similar, but weaker, stoichiometric responses to nutrients.
Also, their C:P becomes lower with cool- ing. Their overall change in C:N:P is thus mixed, with nutrients raising the ratio and cooling lowering it. Community C:N:P represents a balance of these physiologi- cal changes and a general shift in commu- nity composition in favor of eukaryotes.
A first glance at the map of experiment- minus- control changes under glacial con- ditions in Figure 3d gives the impression that the C:P increase in the Indian and much of the Pacific Oceans is balanced by C:P reduction in the Atlantic and North Pacific. However, the global mean C:N:P is given by the production- weighted aver- age. As already noted, the global mean C:N:P is proportionately influenced by the ratios of the more productive waters, and very little influenced by the low ratios of the largely ice- covered Southern Ocean under glacial conditions. The global mean export C:N:P ratio is there- fore decidedly higher under glacial con- ditions, 140:16:1, compared to the con- trol run, 113:16:1 (Table 1). There is thus a 24% increase in the carbon content in the sinking POM per unit P.
In terms of the buffer equation presented above, fPOP = 0.77 and fPOC = 0.95 for the glacial simulation.
That is, while P export decreased by 23%, carbon export only declined by 5%, which indicates BE = 79%, a very strong buffering of carbon export.
The elevated export C:N:P ratio under glacial conditions could help to explain the glacial levels of atmospheric pCO2. As first demonstrated in the 1980s with Antarctic ice core records, pCO2 was lower during peak glacial times by 80–100 µatm than during interglacial periods (e.g., Petit et al., 1999). A com- parison of the glacial- minus- control runs with and without flexible C:N:P sug- gests that having flexible stoichiometry reduces pCO2 by approximately 20 µatm.
This quantification is not without dif- ficulty, but it is on par with the changes in pCO2 achieved by other mechanisms
such as solubility.
Are the glacial model predictions rea- sonable? Our model prediction of deep deoxygenation is consistent with recent paleo-proxy studies concluding that many parts of the glacial ocean, includ- ing the deep Atlantic and the equato- rial Pacific, had substantially lower [O2] during the last glacial period than today (e.g., Lu et al., 2016; R.F. Anderson et al., 2019). In the Southern Ocean, the liter- ature supports the predictions of sea ice expansion and diminished Antarctic pro- ductivity during the last glacial period. A reconstruction of Antarctic sea ice based on fossil diatoms recovered from sedi- ment cores indicates that the maximum limit of Antarctic winter sea ice extended northward by 5°–10° latitude in all sec- tors of the Southern Ocean (Crosta et al., 1998). It is likely that as sea ice expands, biological production under sea ice will be diminished and surface nutrients will be underutilized and accumulate, as our results indicate. Indeed, a summary of biological production during the glacial period indicates reduced production in Antarctic waters (Kohfeld, 2005). Also, different nutrient proxies in Antarctic waters indicate increases in surface nutri- ent concentrations, for example, foramin- iferal Cd/Ca (Elderfield and Rickaby, 2000), diatom δ30Si (De La Rocha et al., 1998), and δ13C of organic matter bound to diatoms (Shemesh et al., 1993).
However, these surface nutrient prox- ies have long been at odds with sedi- mentary and diatom-bound δ15N data, which indicate greater nitrate consump- tion (François et al., 1997). Interestingly and as noted above, our model shows that nitrate is decoupled from phosphate in Southern Ocean surface waters. While phosphate concentration increases due to underutilization, nitrate concentration decreases, reflecting a globally higher denitrification rate and a declining global ocean inventory of fixed nitrogen. The nutrient decoupling may in fact suggest a possible reconciliation of the apparently contradictory proxy results regarding gla- cial Southern Ocean nutrient utilization.
TAKE-HOME MESSAGES
There are a few take-home messages.
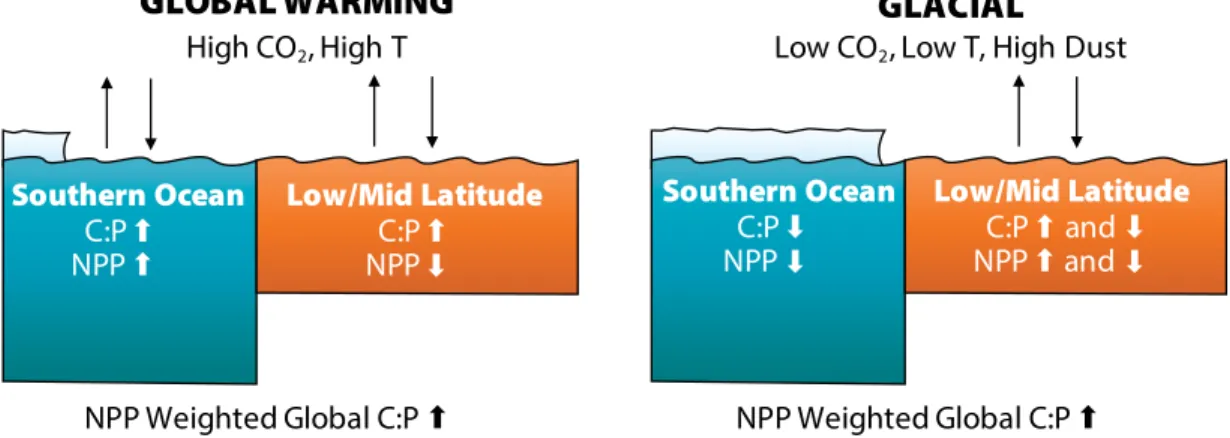
First, there are three important con- trols on global export C:N:P, namely, the physiological response to environmental changes, a shift in community composi- tion, and the balance in regional produc- tion (Figure 4). Under global warming, the physiological response for all PFTs was production of more carbon-rich organic matter. Under glacial condi- tions, the physiological response was more mixed, with nutrient depletion rais- ing the C:P uptake ratio for all PFTs, but cooling lowering the C:P ratio in two of three PFTs. The community composition under warming very modestly shifted in favor of cyanobacteria. The shift under glacial conditions favored eukaryotes.
The balance in regional production under both climate conditions was driven sub- stantially by sea ice. It shrunk under warming but expanded under glaciation.
Surprisingly, both changes had the effect of raising the global mean export C:N:P ratio. Under warming, the increase in production and the depletion of nutri- ents in previously ice-covered waters increased the contribution of the elevated C:N:P ratio of the Southern Ocean to the global mean. Under glacial conditions, the contribution of the low Southern Ocean C:N:P ratio diminished, raising the global mean.
It is interesting to ponder whether this means the present state is at the low- est C:N:P ratio point in recent Earth his- tory, so that going forward (warming) or backward (glaciation) would lead inev- itably to a higher ratio, or whether this is an artifact of the model we used. We do not believe our results show a model artifact, because in different modeling studies, albeit limited in number, the C:P ratio also increased going forward (Kwiatkowski et al., 2018) and backward (Ödalen et al., 2020). Also, the changes in the C:N:P ratio simulated by our model can be understood reasonably in terms of predicted changes in phytoplank- ton physiology, taxonomy, and regional production. Furthermore, the elevation
of the phytoplankton community C:P uptake ratio under glacial conditions (Figure 3d) is quite nuanced in space. It reflects, for example, a mixture of phos- phorus depletion affecting eukaryotes by increasing their C:P uptake ratio and cooling affecting cyanobacteria by lower- ing their C:P uptake ratio (Figure 4). It seems possible that the balance of such tendencies can result in an overall lower global C:N:P ratio under some set of conditions. If so, it is not obvious that the present state is at the lowest C:N:P ratio point. It may be worth considering what conditions might actually lead to a lower C:N:P ratio compared to the pres- ent state. Based on the insights gained in this study, such conditions would include a nutrient replete surface ocean, cool- ing, lower light levels, and Antarctic sea ice retreat. At least one combination, global cooling plus sea ice retreat, does not seem probable. However, the bipolar seesaw observed between the two hemi- spheres suggests at least that Northern Hemisphere cooling could be accom- panied by Southern Hemisphere warm- ing (Crowley, 1992; Markle et al., 2016) and possibly sea ice retreat. On the other hand, if surface winds were to become substantially stronger, they would deepen the mixed layer and reduce the average light level for phytoplankton there. The same winds would also mix cool and
nutrient-rich subsurface waters upward to the surface. These conditions if preva- lent in large areas of the world ocean may lead to a lower global mean C:N:P ratio.
Perhaps the question of whether the pres- ent state is at the lowest C:N:P ratio point or not can be recast in terms of how real- istic such conditions are.
The second take-home message is that, given these results, it is important to have (at least) these three controls properly represented in global models with flex- ible stoichiometry. Thus, having mul- tiple PFTs is essential to allow for shifts in phytoplankton community composi- tion. Also, formulations of flexible phyto- plankton C:N:P uptake ratio that account for a full set of environmental drivers like nutrients and temperature are import- ant. Finally, models that cannot simu- late dynamic shifts in regional produc- tion would be challenged in predicting the global export C:N:P ratio.
Third, the search for a more com- plete description of organic matter export C:N:P is an important ongoing goal in ocean biogeochemistry. For example, our model is still missing heterotrophic con- trol on the stoichiometry of sinking POM, an idea that originally prompted Weyl to consider the effect of variable C:P on gla- cial atmospheric CO2. Preferential rem- ineralization of N and P by heterotrophy acts not only on POM but on dissolved
organic matter as well.
The final message is to point out that as yet there is no paleo proxy for phyto- plankton stoichiometry, although cou- pling of multiple water column nutrient proxies, together with export proxies, may allow resolution of the resultant change in the water column ratio. Our results suggest that flexible C:N:P is important.
It can possibly account for 20 µatm of atmospheric pCO2 change during a gla- cial period. Also, it strongly buffers car- bon export against change under both warming and cooling. We could therefore hypothesize, perhaps provocatively, that the variability in the export C:N:P ratio under climate change will always act as a buffer against change in carbon export. If a new proxy for phytoplankton stoichi- ometry were developed, it could be used to test the hypothesis and open a new subfield of paleo research probing eco- logical change and driving mechanisms for atmospheric CO2.
REFERENCES
Anderson, L.A. 1995. On the hydrogen and oxy- gen content of marine phytoplankton. Deep Sea Research Part I 42(9):1,675–1,680, https://doi.org/
10.1016/0967-0637(95)00072-E.
Anderson, R.F., J.P. Sachs, M.Q. Fleisher, K.A. Allen, J. Yu, A. Koutavas, and S.L. Jaccard. 2019. Deep- sea oxygen depletion and ocean carbon sequestra- tion during the last ice age. Global Biogeochemical Cycles 33(3):301–317, https://doi.org/ 10.1029/
2018GB006049.
FIGURE 4. A schematic diagram illustrating the differences in two model conditions. In the global warming scenario (left), both C:P and net primary production (NPP) increase in the Southern Ocean as sea ice retreats and nutrient uti- lization increases. In the low/mid latitudes, C:P rises as nutrient availability decreases and temperatures rise. In the glacial scenario (right), both NPP and C:P in the Southern Ocean decrease as sea ice expands and nutrient utilization decreases. In the low/mid latitudes, the responses of C:P and NPP vary regionally.
Southern Ocean Low/Mid Latitude C:P
GLOBAL WARMING GLACIAL
C:P
Low CO2, Low T, High Dust
NPP C:P C:P and
High CO2, High T
Southern Ocean Low/Mid Latitude
NPP Weighted Global C:P
NPP NPP NPP and
NPP Weighted Global C:P Southern Ocean Low/Mid Latitude
C:P
GLOBAL WARMING GLACIAL
C:P
Low CO2, Low T, High Dust
NPP C:P C:P and
High CO2, High T
Southern Ocean Low/Mid Latitude
NPP Weighted Global C:P
NPP NPP NPP and
NPP Weighted Global C:P
Arora, V., A. Katavouta, R. Williams, C. Jones, V. Brovkin, P. Friedlingstein, J. Schwinger, L. Bopp, O. Boucher, P. Cadule, and others. 2019.
Carbon-concentration and carbon-climate feed- backs in CMIP6 models, and their comparison to CMIP5 models. Biogeosciences Discussions, https://doi.org/ 10.5194/bg-2019-473.
Bopp, L., L. Resplandy, J.C. Orr, S.C. Doney, J.P. Dunne, M. Gehlen, P. Halloran, C. Heinze, T. Ilyina, R. Séférian, and others. 2013.
Multiple stressors of ocean ecosystems in the 21st century: Projections with CMIP5 mod- els. Biogeosciences 10(10):6,225–6,245, https://doi.org/10.5194/bg-10-6225-2013.
Broecker, W.S. 1982. Ocean chemistry during glacial time. Geochimica et Cosmochimica Acta 46(10):1,689–1,705, https://doi.org/
10.1016/0016-7037(82)90110-7.
Crosta, X., J.J. Pichon, and L.H. Burckle. 1998.
Reappraisal of Antarctic seasonal sea-ice at the Last Glacial Maximum. Geophysical Research Letters 25(14):2,703–2,706, https://doi.org/
10.1029/98GL02012.
Crowley, T.J. 1992. North Atlantic Deep Water cools the southern hemisphere.
Paleoceanography 7(4):489–497, https://doi.org/ 10.1029/92PA01058.
De La Rocha, C.L., M.A. Brzezinski, M.J. DeNiro, and A. Shemesh. 1998. Silicon-isotope composition of diatoms as an indicator of past oceanic change.
Nature 395(6703):680–683, https://doi.org/
10.1038/27174.
Elderfield, H., and R.E.M. Rickaby. 2000. Oceanic Cd/P ratio and nutrient utilization in the glacial Southern Ocean. Nature 405(6784):305–310, https://doi.org/10.1038/35012507.
Falkowski, P.G. 1997. Evolution of the nitrogen cycle and its influence on the biological sequestration of CO2 in the ocean. Nature 387(6630):272–275, https://doi.org/10.1038/387272a0.
François, R., M.A. Altabet, E.-F. Yu, D.M. Sigman, M.P. Bacon, M. Frank. G. Bohrmann, G. Bareille, and L.D. Labeyrie. 1997. Contribution of Southern Ocean surface-water stratification to low atmo- spheric CO2 concentrations during the last glacial period. Nature 389(6654):929–935, https://doi.org/
10.1038/40073.
Galbraith, E.D., and A.C. Martiny. 2015. A simple nutrient- dependence mechanism for predicting the stoichiometry of marine ecosystems. Proceedings of the National Academy of Sciences of the United States of America 112(27):8,199–8,204, https://doi.org/ 10.1073/pnas.1423917112.
Geider, R.J., and J. La Roche. 2002. Redfield revisited: Variability of C:N:P in marine microalgae and its biochemical basis. European Journal of Phycology 37(1):1–17, https://doi.org/10.1017/
S0967026201003456.
Kohfeld, K.E. 2005. Role of marine biology in glacial- interglacial CO2 cycles. Science 308(5718):74–78, https://doi.org/10.1126/science.1105375.
Kostadinov, T.S., S. Milutinovi, I. Marinov, A. Cabré, S. Milutinović, I. Marinov, and A. Cabré. 2016.
Carbon-based phytoplankton size classes retrieved via ocean color estimates of the parti- cle size distribution. Ocean Science 12(2):561–575, https://doi.org/ 10.5194/os-12-561-2016.
Kwiatkowski, L., O. Aumont, L Bopp, and P. Ciais.
2018. The impact of variable phytoplankton stoichi- ometry on projections of primary production, food quality, and carbon uptake in the global ocean.
Global Biogeochemical Cycles 32(4):516–528, https://doi.org/10.1002/2017GB005799.
Lu, Z., B.A.A. Hoogakker, C.-D. Hillenbrand, X. Zhou, E. Thomas, K.M. Gutchess, W. Lu, L. Jones, and R.E.M. Rickaby. 2016. Oxygen depletion recorded in upper waters of the glacial Southern Ocean.
Nature Communications 7(7):11146, https://doi.org/
10.1038/ncomms11146.
Markle, B.R., E.J. Steig, C. Buizert, S.W. Schoenemann, C.M. Bitz, T.J. Fudge, J.B. Pedro, Q. Ding, T.R. Jones, J.W.C. White, and T. Sowers.
2016. Global atmospheric teleconnections during Dansgaard–Oeschger events. Nature Geoscience 10(1):36–40, https://doi.org/10.1038/
ngeo2848.
Martin, J.H. 1990. Glacial-interglacial CO2 change:
The Iron Hypothesis. Paleoceanography 5(1):1–13, https://doi.org/10.1029/PA005i001p00001.
Martiny, A.C., C.T.A. Pham, F.W. Primeau, J.A. Vrugt, J.K. Moore, S.A. Levin, and M.W. Lomas. 2013.
Strong latitudinal patterns in the elemental ratios of marine plankton and organic matter. Nature Geoscience 6(4):279–283, https://doi.org/10.1038/
ngeo1757.
Matsumoto, K., J.L. Sarmiento, and M.A. Brzezinski.
2002. Silicic acid leakage from the Southern Ocean: A possible explanation for glacial atmospheric pCO2. Global Biogeochemical Cycles 16(3):5-1–5-23, https://doi.org/ 10.1029/
2001GB001442.
Matsumoto, K., K. Tokos, A. Huston, and H. Joy-Warren. 2013. MESMO 2: A mechanis- tic marine silica cycle and coupling to a sim- ple terrestrial scheme. Geoscientific Model Development 6(2):477–494, https://doi.org/10.5194/
gmd-6-477-2013.
Matsumoto, K., R. Rickaby, and T. Tanioka. 2020.
Carbon export buffering and CO2 drawdown by flexible phytoplankton C:N:P under glacial condi- tions. Paleoceanography and Paleoclimatology, https://doi.org/10.1029/2019PA003823.
Moreno, A.R., and A.C. Martiny. 2018. Ecological stoi- chiometry of ocean plankton. Annual Review of Marine Science 10(1):43–69, https://doi.org/10.1146/
annurev-marine-121916-063126.
Najjar, R.G., X. Jin, F. Louanchi, O. Aumont, K. Caldeira, S.C. Doney, J.-C. Dutay, M. Follows, N. Gruber, F. Joos, and others. 2007. Impact of cir- culation on export production, dissolved organic matter, and dissolved oxygen in the ocean:
Results from Phase II of the Ocean Carbon-cycle Model Intercomparison Project (OCMIP-2). Global Biogeochemical Cycles 21(3), https://doi.org/
10.1029/2006GB002857.
Ödalen, M., J. Nycander, A. Ridgwell, K.I.C. Oliver, C.D. Peterson, and J. Nilsson. 2020. Variable C/P composition of organic production and its effect on ocean carbon storage in glacial-like model simulations. Biogeosciences 17(8):2,219–2,244, https://doi.org/ 10.5194/bg-17-2219-2020.
Petit, J.R., J. Jouzel, D. Raynaud, N.I. Barkov, J.-M. Barnola, I. Basile, M. Bender, J. Chappellaz, M. Davis, G. Delaygue, and others. 1999.
Climate and atmospheric history of the past 420,000 years from the Vostok ice core, Antarctica.
Nature 399:429–413, https://doi.org/10.1038/20859.
Redfield, A.C. 1934. On the Proportions of Organic Derivatives in Sea Water and Their Relation to the Composition of Plankton. University Press of Liverpool, James Johnstone Memorial Volume.
Redfield, A.C., B.H. Ketchum, and F.A. Richards.
1963. The influence of organisms on the composi- tion of sea-water. Pp. 26–77 in The Sea. Volume 2:
The Composition of Sea-Water: Comparative and Descriptive Oceanography. M.N. Hill, ed., Interscience Publishers, New York.
Riahi, K., D.P. van Vuuren, E. Kriegler, J. Edmonds, B.C. O’Neill, S. Fujimori, N. Bauer, K. Calvin, R. Dellink, O. Fricko, and others. 2017. The Shared Socioeconomic Pathways and their energy, land use, and greenhouse gas emissions impli- cations: An overview. Global Environmental Change 42:153–168, https://doi.org/10.1016/
j.gloenvcha.2016.05.009.
Shemesh, A., S.A. Macko, C.D. Charles, and G.H. Rau. 1993. Isotopic evidence for reduced productivity in the glacial Southern Ocean.
Science 262(5132):407–410, https://doi.org/
10.1126/science.262.5132.407.
Tanioka, T., and K. Matsumoto. 2017. Buffering of ocean export production by flexible elemen- tal stoichiometry of particulate organic matter.
Global Biogeochemical Cycles 31(10):1,528–1,542, https://doi.org/ 10.1002/2017GB005670.
Tanioka, T., and K. Matsumoto. 2020. A meta- analysis on environmental drivers of marine phytoplank- ton C:N:P. Biogeosciences, https://doi.org/ 10.5194/
bg-2019-440.
Teng, Y.-C., F.W. Primeau, J.K. Moore, M.W. Lomas, and A.C. Martiny. 2014. Global-scale variations of the ratios of carbon to phosphorus in exported marine organic matter. Nature Geoscience 7(12):895–898, https://doi.org/10.1038/NGEO2303.
Wang, W.-L., J.K. Moore, A.C. Martiny, and F.W. Primeau. 2019. Convergent esti- mates of marine nitrogen fixation.
Nature 566(7743):205–211, https://doi.org/
10.1038/s41586-019-0911-2.
Yvon-Durocher, G., M. Dossena, M. Trimmer, G. Woodward, and A.P. Allen. 2015. Temperature and the biogeography of algal stoichiometry.
Global Ecology and Biogeography 24(5):562–570, https://doi.org/10.1111/geb.12280.
ACKNOWLEDGMENTS
This work was funded by the US National Science Foundation (OCE-1827948). KM was supported by the Leverhulme Trust Visiting Professorship at the University of Oxford. RR acknowledges support from ERC Consolidator Grant APPELS: ERC-2015- COG-681746 and a Wolfson Research Merit Award.
Numerical modeling and analysis were carried out using resources at the University of Minnesota Supercomputing Institute. Guest editor P. Delaney asked probing questions that motivated us to think deeper about the lowest C:N:P point. All model results presented here are archived at the Biological
& Chemical Oceanography Data Management Office and freely accessible (https://doi.org/10.26008/1912/
bco-dmo.810368.1 for the global warming results and https://doi.org/10.26008/1912/bco-dmo.784634.1 for the glacial results).
AUTHORS
Katsumi Matsumoto([email protected]) is Professor, and Tatsuro Tanioka is Postdoctoral Researcher, both in the Department of Earth & Environmental Sciences, University of Minnesota, Minneapolis, MN, USA.
Rosalind Rickaby is Professor, Department of Earth Sciences, University of Oxford, Oxford, UK.
ARTICLE CITATION
Matsumoto, K., T. Tanioka, and R. Rickaby. 2020.
Linkages between dynamic phytoplankton C:N:P and the ocean carbon cycle under climate change.
Oceanography 33(2):44–52, https://doi.org/10.5670/
oceanog.2020.203.
COPYRIGHT & USAGE
This is an open access article made available under the terms of the Creative Commons Attribution 4.0 International License (https://creativecommons.org/
licenses/by/4.0/), which permits use, sharing, adap- tation, distribution, and reproduction in any medium or format as long as users cite the materials appro- priately, provide a link to the Creative Commons license, and indicate the changes that were made to the original content.