the sites where swallowing sounds are produced are unknown. In this study, we investigated the relationship between swallowing sounds and videoendoscopy (VE)
images in healthy adults to identify the timing of swallowing sounds. Fifteen healthy young adults participated in the study. Each participant was seated in an upright position while a stethoscope probe with an inserted microphone was placed at the center of his or her lower neck to detect swallowing sounds during the VE. The detected sounds were recorded simultaneously with the VE images while the subjects swallowed 4 g of liquid or jelly. Swallowing duration, swallowing sound duration, and VE findings at the beginning and end of swallowing sounds were analyzed. One hundred and thirty-four sound samples produced by a single swallowed bolus were obtained and analyzed. The mean swallowing duration for each material ranged from 1.25 to 2.39 s. Swallowing duration was significantly longer for jelly compared with liquids (p < 0.01) . Swallowing sound duration was approximately 0.5 s in all samples, and there were no significant differences between materials. Most swallowing sounds started during velopharyngeal closure (109/134, 81.3%) , and most swallowing sounds ended during velopharyngeal closure (98/134, 73.1%) . For all materials, swallowing sounds did not start when the materials flowed into the pyriform sinuses, and very few sounds corresponded with epiglottic movements. These results show that many movements associated with physiologic events ―including hyoid bone and laryngeal excursion, and opening of the upper esophageal sphincter ―may be involved in the production of swallowing sounds.
Key words : videoendoscopy, swallowing sounds, acoustic analysis, deglutition, cervical auscultation
Introduction
Cervical auscultation (CA) is a non-invasive clinical tool that is frequently used for assessing dysphagia
1,2). Borr et al reported that CA had 70% specificity and 94% sensitivity in detecting dysphagia
3). Takahashi et al reported that the percentage agreement when diagnosing dysphagia using acoustic analysis and videofluorography (VF) was 77.3%
4). Thus, swallowing sounds are an
1)
Department of Special Needs Dentistry, Division of Oral Rehabilitation Medicine, Showa University School of Dentistry, 2-1-1 Kitasenzoku, Ohta-ku, Tokyo 145-0062, Japan.
2)
Truesdail Center for Communicative Disorders, University of Redlands.
*
To whom corresponding should be addressed.
important clue in detecting dysphagia. However, the anatomic sites where swallowing sounds are produced are unknown.
Research aimed at identifying the sites where swallowing sounds are produced has involved comparison of images from VF of swallowing to swallowing sounds detected by CA. However, visualization with VF is limited when the contrast agent is too thin or too small, and it is dif- ficult to detect slight spillage of materials into the pharynx that might generate sound. Video- endoscopy (VE) of swallowing provides a direct view of the pharynx and larynx and can detect slight spillage. In addition to observing the movement of soft tissue, VE enables researchers to directly observe residue of saliva and secretion products, movement of the base of the tongue and velopharyngeal closure, contraction of the pharyngeal side wall, shapes of the pyriform sinus and epiglottis, and movement of arytenoid cartilage. When VF is used, contraction of the pha- ryngeal side wall cannot be observed by the lateral view, and contraction of pharyngeal side wall is difficult to observe by the frontal view because the maxilla bone overlaps the pharyngeal side wall.
During velopharyngeal closure, bolus movements and swallow-related organs cannot be observed by VE. However, VE can detect slight spillage of materials into the pharynx, pharyn- geal residue in great detail, slight penetration of materials or saliva into the larynx, aspiration before and after swallowing, and the cough reflex
5-7). In addition, VE enables examinations with usual diets, flavors, and properties because the procedure does not use barium. Without the use of barium, severely dysphagic patients can be examined more safely by VE than by VF
5). Moreover, VE equipment is compact and portable, so evaluation location is not restricted.
The purpose of this study was to investigate the relationship between swallowing sounds and VE images in healthy adults, and differences in swallowing sounds for various materials. From these data, insight into the source and timing of swallowing sounds can be obtained.
Materials and methods Participants
Fifteen healthy young adults (eight men, seven women; mean age: 26.5 3.0 years) were recruited to participate in the study. The procedure was explained to them, and they all pro- vided written informed consent.
Ethics approval
The study was approved by the Ethics Committee of Showa University School of Dentistry
(acceptance number: 2011-010) .
VE examination of swallowing
Before the VE experiments, three dentists who had more than 4 years of experience in
managing dysphagia assessed participantsʼ laryngopharyngeal structures to confirm that they were
normal. In addition, they checked whether participants experienced any discomfort and whether
they could swallow as usual with transnasal insertion of a fiberscope. Participants were seated
in a dental chair in a comfortable, upright position. A flexible fiberoptic endoscope (ENF-P4, Olympus, Tokyo, Japan) was introduced transnasally directly below the inferior turbinate, and the tip of the endoscope was positioned at the level just below the uvula during the swallow sequence. On the lateral view, the angles between the vertical line and Camperʼs plane and between the vertical line and the backrest of the dental chair were measured (Fig. 1) . To perform the examination while the participants were in a relaxed position, participantsʼ head and body were unfixed; however, participants were instructed to keep their head and body as still as possible during the examination.
Black and white colored liquids were used for contrasting pharyngeal mucosa to detect slight spillage of materials into the pharynx (coffee [Roots Aroma Impact, JT Co., Tokyo, Japan]
and milk [Hokkaido Gyuunyuu 3.7% , Eight Cooperative Buying Co., Tokyo, Japan] ; 4 g each) . Each liquid was injected onto the floor of the oral cavity using a syringe.
Two kinds of jelly (4 g each) were used: Jelly A, low adhesion (V CRESC Jelly, Nutri Co., Mie, Japan) and Jelly B, high adhesion (Okunosu Nutrition Support Dessert Azuki, Horika Foods, Niigata, Japan) . Each jelly was placed on the dorsum of the tongue using a spoon. The properties of the jellies were measured by the method described by Kayashita et al
8).
Three sets of each material were prepared for each participant and kept in a refrigerator (at 5-6 C) until just before the experiment. Liquid and jelly were then given to participants at the same temperature. The participants were asked to swallow three samples each of coffee, milk, Jelly A and Jelly B, resulting in a total of 180 swallowing samples for the 15 participants. To analyze volitional swallows, the participants were instructed to swallow the materials whenever they were ready.
Fig. 1. Detection and recording of swallowing sounds during videoendoscopy (VE)
The system for detecting and recording swallowing sounds during VE is shown on the left. The detected swallowing sound signals were amplified and recorded simultaneously with the VE images using a digital high- definition video cassette recorder. On the lateral view, the angles between the vertical line and Camperʼs plane
(A) , and the vertical line and the backrest of the dental chair (B) were measured, as shown on the right.
The number of masticatory cycles, number of swallows, and the timing of swallows varied across the participantsʼ volitional swallows. We selected single swallows to exclude any influence that might be caused by multiple swallows. Multiple swallows could indicate segmentation of the 4 g of material into small quantities ―that is, a change in the bolus amount. In multiple swallows, total swallow duration and swallowing sound duration might be extended, and acoustic analysis of swallowing sound might be changed. We therefore excluded 46 multiple swallow samples, and 134 single swallow samples were analyzed (coffee, 39; milk, 39; Jelly A, 28; Jelly B, 28) .
To detect swallowing sounds, a microphone (Lavalier Microphone COS-11DBPC, Sanken Microphone, Tokyo, Japan) was inserted into a stethoscope probe (double-faced stethoscope, No. 160, Yamasu, Kentsumedico, Saitama, Japan) . The probe was placed with double-sided tape
(Naisutakku, NW-K25, Nichiban, Tokyo, Japan) at the center of the lower neck just above the sternum. This location was designated as Site 6, located on the midline of the neck, imme- diately superior to the jugular notch. It was considered to be the most appropriate site by Takahashi et al
9)for recording a volume of swallowing sound similar to that at Site 11, which is over the lateral border of the trachea immediately inferior to the cricoid cartilage. Takahashi et al recorded swallowing sounds at 24 sites on the neck and found that Site 11 was the optimal site for detecting swallowing sounds because this site showed the greatest signal-to-noise ratio with the smallest variance
9).
The detected swallowing sound signals were amplified (AT-MA2 microphone amplifier, Audio Technica, Tokyo, Japan) and recorded simultaneously with the VE images using a digital high- definition video cassette recorder (GV-HD700, Sony, Tokyo, Japan) .
Measurement of total swallow duration and swallowing sound duration
Recorded VE images and swallowing sounds were fed to a computer (PC-VJ25AAU5HJR9, NEC, Tokyo, Japan) at a frame rate of 30 frames per second and a sampling rate of 48 kHz.
The total swallowing duration and the duration of each sound generated were analyzed by a
system for synchronous analysis of swallowing sounds and video images (Dimagic, Tokyo, Japan) .
Total swallow duration taken from the VE images started on the frame where the bolus
entered the oropharynx or whenever velopharyngeal closure began (i.e. “whiteout”; the tip of
the endoscope was placed just above the uvula, so we referred to “whiteout” as velopharyngeal
closure) , and ended with a frame where the epiglottis returned to its resting position. Total
swallow duration was divided into three parts: (i) from when the bolus entered the oropharynx
to the beginning of velopharyngeal closure (Fig. 2 A, B) ; (ii) velopharyngeal closure duration,
from the beginning to the end of velopharyngeal closure (Fig. 2 B-D) ; and (iii) from the end
of velopharyngeal closure to the return of the epiglottis to its resting position (Fig. 2 D-F) .
Swallowing sound duration was measured on the screen for monitoring the time waveform. The
criteria for beginning and end of swallowing sounds were determined by three dentists who had
4 years of experience managing dysphagia.
Relationship between beginning and end of swallowing sounds and VE findings
To clarify the relationship between the beginning and end of swallowing sounds and VE findings, VE images representing the beginning and end of swallowing sounds were analyzed for each material. VE findings at the beginning of swallowing sounds were classified into three image categories: (i) before velopharyngeal closure, (ii) beginning of velopharyngeal closure, and
(iii) during velopharyngeal closure. VE findings at the end of swallowing sounds were classified into four image categories: (i) during velopharyngeal closure, (ii) end of velopharyngeal closure,
(iii) epiglottis rotation, and (iv) epiglottis returning to its resting position. VE findings at the beginning and end of swallowing sounds were evaluated using a six-point VE score: 1, before velopharyngeal closure; 2, beginning of velopharyngeal closure; 3, during velopharyngeal closure; 4, end of velopharyngeal closure; 5, epiglottis rotation; 6, epiglottis returning to its resting position.
Statistical analysis of total swallow duration and swallowing sound duration
To assess the differences between the materials for total swallow duration, swallowing sound duration, and the beginning and end of swallowing sounds, we used the Kruskal–Wallis one-way analysis of variance by ranks. In cases where statistically significant differences between materials were detected, we used Games–Howell multiple comparison tests to assess differences between specific pairs of materials. Analyses were conducted using SPSS Version 15.0. Data are presented as mean SD.
Analysis of frequency characteristics of swallowing sounds
For the entire swallowing sound duration, sound samples were extracted using a 1,024-point Hamming window with a 512-point overlap, and a time-averaged frequency waveform was
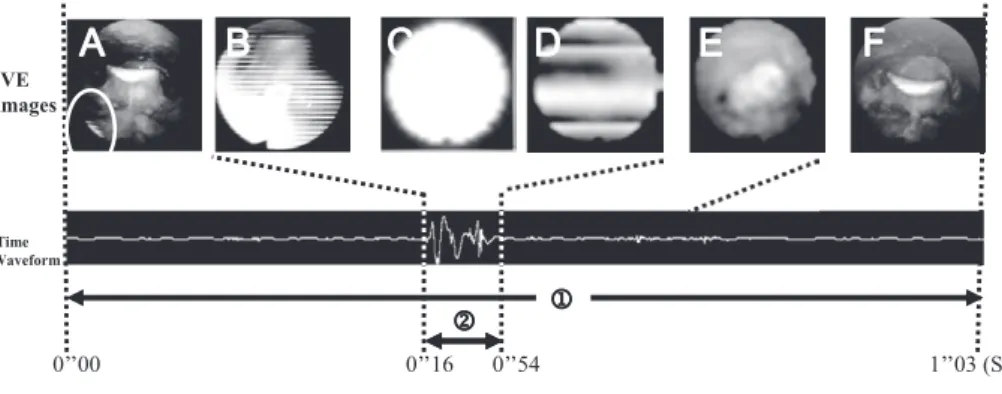
Fig. 2. Examples of total swallow duration and swallowing sound duration
Series of VE images taken during swallowing of milk: (A) bolus, indicated by the oval, entering the oropharynx;
(B) beginning of velopharyngeal closure; (C) during velopharyngeal closure; (D) end of velopharyngeal closure;
(E) epiglottis rotation; (F) epiglottis returning to its resting position. Total swallow duration ① is taken from
the VE images starting on the frame where the bolus entered the oropharynx or whenever velopharyngeal
closure began, and ending with a frame where the epiglottis returned to its resting position. Swallowing sound
duration ② was measured on the time waveform showing the beginning and end of the swallowing sound.
obtained with fast Fourier transform analysis. We set the low-frequency band under 1 kHz and the high-frequency band from 1 kHz to 5 kHz, and analyzed the peak frequency of each material
(Fig. 3) . Results
Posture of participants
The mean angle between the vertical line and Camperʼs plane (A) was 83.6 8.7 , and the mean angle between the vertical line and the backrest of the dental chair (B) was 16.6 5.2
(Fig. 1) . This confirmed that the participants remained close to an upright posture during the VE examination.
Total swallow duration
For the 134 single swallow samples included in the analysis, the mean total swallow duration for each material was 1.25 0.33 s for coffee, 1.25 0.41 s for milk, 2.39 1.34 s for Jelly A, and 2.35 1.25 s for Jelly B (Fig. 4a) . There was no significant difference between coffee and milk, or between Jelly A and Jelly B. Compared to liquids, jellies showed significantly longer total swallow duration (p < 0.01) . The results for each section of the total swallow duration are shown in Fig. 4.
The mean duration of bolus entry to velopharyngeal closure beginning was 0.08 0.15 s for coffee, 0.15 0.32 s for milk, 1.25 1.26 s for Jelly A, and 1.19 1.18 s for Jelly B. For liquids, there was almost no time-lag between bolus entry into the oropharynx and the beginning of velopharyngeal closure. For jellies, however, there was a mean time-lag of 1.22 s. The difference between liquids and jellies was statistically significant (p < 0.01) (Fig. 4b) .
The mean duration of velopharyngeal closure was 0.64 0.13 s for coffee, 0.68 0.15 s for milk, 0.65 0.09 s for Jelly A, and 0.67 0.10 s for Jelly B. There was no significant difference between
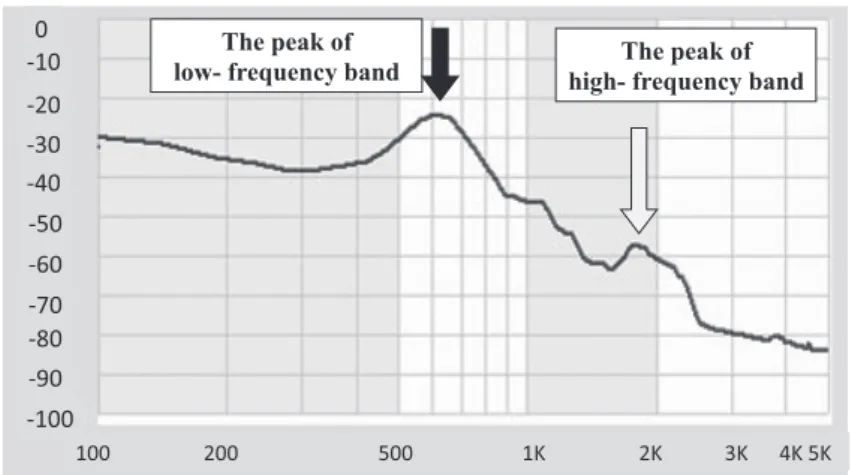
Fig. 3. Frequency characteristics of swallowing sounds
We set the low-frequency band under 1 kHz and the high-frequency
band from 1 kHz to 5 kHz, and analyzed the peak frequency of
each material.
the materials (Fig. 4c) .
The mean duration from the end of velopharyngeal closure to the return of the epiglottis to its resting position was 0.52 0.23 s for coffee, 0.42 0.17 s for milk, 0.48 0.20 s for Jelly A, and 0.49 0.14 s for Jelly B. There was no significant difference between the materials (Fig. 4d) .
Swallowing sound duration
The mean swallowing sound duration was 0.55 0.10 s for coffee, 0.54 0.11 s for milk, 0.50 0.11 s for Jelly A, and 0.50 0.11 s for Jelly B. There was no significant difference between the materials.
Relationship between beginning and end of swallowing sounds and VE findings
For all the materials, swallowing sounds began most frequently during velopharyngeal closure
Fig. 4. Total swallow duration
*(a) There were significant differences in mean swallow duration between materials (p < 0.05; Kruskal–Wallis one- way analysis of variance by ranks) . The mean swallow duration for jellies was significantly longer than that for liquids (coffee v Jelly A: p = 0.001; coffee v Jelly B: p = 0.001; milk v Jelly A: p = 0.001; milk v Jelly B:
p = 0.001; Games–Howell multiple comparison test) .
(b) There were significant differences in duration from bolus entering the oropharynx to beginning of velopharyngeal closure between materials (p < 0.05; Kruskal–Wallis one-way analysis of variance by ranks) . The mean swallow duration for jellies was significantly longer than for liquids (coffee v Jelly A: p < 0.001;
coffee v Jelly B: p < 0.001; milk v Jelly A: p = 0.001; milk v Jelly B: p < 0.001; Games–Howell multiple comparison test) .
(c) There were no significant differences in velopharyngeal closure duration (from the beginning to end of velopharyngeal closure) between materials (p = 0.827; Kruskal–Wallis one-way analysis of variance by ranks) .
(d) There were no significant differences in duration from the end of velopharyngeal closure to the epiglottis returning to its resting position between materials (p = 0.130; Kruskal–Wallis one-way analysis of variance by ranks) .
*
Error bars indicate SD. n.s:not significant.
(74.4%-87.2%) , and swallowing sounds began during velopharyngeal closure for 81.3% of all samples (Table 1) . For all the materials, the end of swallowing sounds finished most frequently during velopharyngeal closure. For 73.1% of all samples, end of swallowing sounds were dur- ing velopharyngeal closure (Table 1) . The VE scores at the beginning and end of swallowing sounds are shown in Table 2. There was no significant difference between the materials in the beginning and end VE scores (beginning: p = 0.41, end: p = 0.88; Kruskal–Wallis one-way analy- sis of variance by ranks) .
Acoustic analysis of swallowing sounds
Most swallowing sounds exhibited two peaks on the frequency waveform analysis (120/134 samples, 89.6%) (Fig. 5) . One peak was at a low-frequency band and the other peak was at
Table 1. Videoendoscopy findings at the beginning and end of swallowing sounds
*Beginning of swallowing sound End of swallowing sound before
VC
beginning of VC
during VC
during VC
end of VC
epiglottis rotation
epiglottis returning
Coffee 5/39 5/39 29/39 27/39 2/39 4/39 6/39
(12.8) (12.8) (74.4) (69.2) (5.1) (10.3) (15.4)
milk 1/39 4/39 34/39 28/39 2/39 2/39 7/39
(2.5) (10.3) (97.4) (71.8) (5.1) (5.1) (17.9)
jelly A 5/28 0/28 23/28 21/28 2/28 1/28 4/28
(17.9) (0.0) (82.1) (75.0) (7.1) (3.6) (17.8)
jelly B 3/28 2/28 23/28 22/28 1/28 1/28 4/28
(10.7) (7.2) (82.1) (78.5) (3.6) (3.6) (14.3)
Total 14/134 11/134 109/134 98/134 7/134 8/134 21/134
(10.4) (8.2) (81.3) (73.1) (5.2) (6.0) (15.7)
*
Data are numerator/denominator (percentage) . VC:velopharyngeal closure.
Table 2. Videoendoscopy scores at beginning and end of swallowing sounds
*material n
VE scores at beginning of swallowing sounds
VE scores at end of swallowing sounds
Mean SD Mean SD
Coffee 39 2.5 0.8 3.7 1.2
Milk 39 2.9 0.4 3.6 1.2
Jelly A 28 2.6 0.8 3.6 1.1
Jelly B 28 2.7 0.7 3.5 1.1
total 134 2.7 0.7 3.6 1.1
*