告報 究研 所究 研地 草産 畜
号六 十第
月三 年八 十二 成平
人法 発開 究研 立国
構機 究研 合総 術技 業産 品食
・業 農
所究 研地 草産 畜
Bulletin of NARO Institute of Livestock and Grassland Science
ISSN:1347-0825 CODEN:CSKKCS
Bull NARO Inst Livest Grassl Sci
畜 草 研 研 報
畜産草地研究所
国立研究開発法人 農業・食品産業技術総合研究機構
Bulletin of NARO Institute of Livestock and Grassland Science
NARO Institute of Livestock and Grassland Science
(NILGS)
Ibaraki, Japan
第 16 号 〈 No.16 〉 平成 28 年 3 月 -March2016-
所 長
Director-General草地研究監
Director, Grassland Research
編集委員長
Editor-in-Chief
副編集委員長
Deputy Editor編集委員
Associate Editor土 肥 宏 志
Hiroshi DOHI大 同 久 明
Hisaaki DAIDO阿 部 啓 之
Hiroyuki ABE下 田 勝 久
Katsuhisa SHIMODA秋 山 典 昭
Fumiaki AKIYAMA間 野 吉 郎
Yoshiro MANO菅 野 勉
Tsutomu KANNO手 島 茂 樹
Shigeki TEJIMA住 田 憲 俊
Noritoshi SUMIDA小 林 栄 治
Eiji KOBAYASHI森 岡 理 紀
Riki MORIOKA野 村 将
Masaru NOMURA畜産草地研究所編集委員会
Editorial Board
(目的)
第 1 条 畜産草地研究所研究報告及び畜産草地研究所研究資料への投稿については,刊行物著作権取扱規程(14規程第56号)に定める もののほかこの要領の定めるところによる。
(投稿者の資格)
第 2 条 投稿者は原則として,畜産草地研究所職員(以下 「職員」 という。)及び流動研究員,依頼研究員,日本学術振興会特別研究 員,日本学術振興会外国人特別研究員等(以下 「他の職員」 という。)とする。
一 職員が投稿する内容は,主として畜産草地研究所(以下 「研究所」 という。)で行った研究とする。
二 他の職員が投稿する内容は,研究所で行った研究とする。
(投稿原稿の内容)
第 3 条 投稿原稿の内容は次のとおりとする。
1 畜産草地研究所研究報告(Bulletin of NARO Institute of Livestock and Grassland Science / 略誌名:Bull NARO Inst Livest Grassl Sci ) 一 原著論文:研究所において行った試験研究及び研究所以外の者に委託して行った試験研究の成果に関わる論文とする。
二 短 報:一以外の研究の予報,速報などの短報とする。
三 技術論文:新しい技術や技術の組立,実証などを主体とする報告。
四 総 説:畜産草地研究に関わるものとする。総説は投稿のほか,編集委員会が依頼したものを含む。
五 学位取得論文:研究所において主として行った試験研究による学位取得論文とする。
2 畜産草地研究所研究資料(Memoirs of NARO Institute of Livestock and Grassland Science / 略誌名:Mem NARO Inst Livest Grassl Sci ) 調査資料・技術資料・研究資料:研究所において行った試験研究及び研究所が研究所以外のものに委託して行った試験研究のうち,
学術的・産業的に有用な未発表の資料とする。
(原稿の執筆)
第 4 条 原稿の執筆にあたっては,別に定める畜産草地研究所研究報告及び畜産草地研究所研究資料執筆要領(13畜草 B 第44号)に 基づくものとする。使用する言語は日本語又は英語とする。
(原稿の提出)
第 5 条 次の手続きにより原稿及び原稿提出票を事務局に提出する。
一 職員は原稿提出票に必要事項を記載し,所属研究領域長等の校閲を受ける。
二 他の職員は原稿提出票に必要事項を記載し,所属研究領域長等の校閲を受ける。
(受付)
第 6 条 原稿及び原稿提出票を事務局が受け取った日を受付日とする。受理日は編集委員会の審査の結果,掲載が妥当と認められた日 とする。
(審査)
第 7 条 編集委員会は次の手続きにより論文を審査する。ただし,学位取得論文については審査を省略することができる。
一 編集委員会は論文の内容により審査員正副をそれぞれ 1 名決定し,論文審査を依頼する。審査員は研究所内及び研究所外の研究 者等とし,その氏名は公表しない。
二 審査員は論文審査票により審査を行う。また必要に応じて指摘事項を書き出し提出する。
三 事務局は審査員と著者の間のやり取りの対応にあたる。
四 編集委員会は審査員の審査結果を参考にして掲載の可否を判断する。
審査の内容によっては著者に原稿の訂正を求めることができる。
五 著者は審査結果を受領後,編集委員会が指定する期日までに修正原稿を事務局に提出する。
(校正)
第 8 条 著者による校正は原則として初校のみとする。校正は誤植の訂正程度にとどめる。やむを得ず大きな変更等を行う場合には編 集委員会の承認を得なければならない。
(別刷り)
第 9 条 別刷りは次のとおりとする。
一 100部とし,筆頭著者が代表で受け取る。
二 別刷りの追加を希望する場合は研究費負担で印刷する。
附 則
この規定は,平成14年 4 月 1 日から施行する。
附 則
この規定は,平成15年10月 1 日から施行する。
附 則
この規定は,平成18年 4 月 1 日から施行する。
附 則
この要領は,平成20年 4 月 1 日から施行する。
附 則
この要領は,平成23年 4 月 1 日から施行する。
附 則
この要領は,平成23年 8 月 8 日から施行する。
附 則
この要領は,平成27年4月1日から施行する。
Editorial Board
第 16 号(平成 28 年3月)
− 目 次 −
− 原著論文 −
日本の公的機関でのトウモロコシ(Zea mays L.)育種のためのゲノムワイドセレクションの 予備研究として行われた
RAD-Seq法により発見された親自殖系統群内のゲノム全体にわたる 分子多型(英文)
……… 玉置宏之・三ツ橋昇平・工藤洋・永野惇・八杉公基…… 1
ビタミン
A給与制限下の黒毛和種去勢牛における血漿中グレリン濃度の推移(英文)
……… 林征幸・木戸恭子・甫立京子……11
− 学位論文 − 自給粗飼料の生産履歴・計量法と放牧牛体型測定法の開発
……… 喜田環樹……21
NARO INSTITUTE OF
LIVESTOCK AND GRASSLAND SCIENCE
No.16 (March2016)
CONTENTS
Research Papers
Hiroyuki TAMAKI, Shohei MITSUHASHI, Hiroshi KUDOH, Atsushi J. NAGANO and Masaki YASUGI : Genomewide Molecular Polymorphisms among Maize (Zea mays L.) Inbred Lines Found from Restriction-Associated DNA Tag Sequencing (RAD-Seq) Analysis as a Preliminary Study on
‘Genomewide Selection’ for Breeding by Japanese Public Sectors ……… 1
Masayuki HAYASHI, Kyoko KIDO and Kyoko HODATE :
Changes in Plasma Ghrelin Concentrations in Vitamin A–restricted Japanese Black Steers ………11
Doctoral Dissertation
Tamaki KIDA :
Development of an Information Management System for the Distribution of Round Bales and a
Technique for the Growth of Grazing Cattle by Using a 3D Digital Camera ……… 21
Introduction
There are concerns in Japan over the difficulties in ensuring long-term food supply, for which the Japanese government has adopted a policy to increase food self- sufficiency. A primary plan for this goal is to raise domestic feed crop production from 4.00 ×10⁶ metric tons on the
total digestible nutrition (TDN) basis (in 2012) to 5.27×
106 in 20208). The maize (Zea mays L.) breeding teams of Japanese public sectors, including NARO Institute of Livestock and Grassland Science, are now expected to support this policy by releasing high-yield varieties for whole-crop silage use highly adapted to Japanese climates.
As the cost of molecular genotyping has rapidly Abstract
For accelerating yield improvement in the maize breeding programs operated by the Japanese public sectors, the authors have been interested in introducing genomewide selection (GwS), which requires the arrangement of at least 90 molecular markers in a pair of inbred lines (inbreds) having an identical genetic background. The purpose of this study was to evaluate the potential of ‘restriction-associated DNA sequencing’ analysis (RAD-Seq) as a genotyping tool in the maize GwS. RAD-Seq is a molecular technique with restriction enzymes and a high-speed sequencing system, whose advantages have been reported on the high reproductivity as well as on the low genotyping cost. Molecular polymorphisms among 34 inbreds from three genetic background groups were surveyed with RAD-Seq, from which 14384 polymorphic loci were found distributed genomewide. The dendrogram drawn based on the polymorphisms well accords not only with those drawn in the previous studies but also with the pedigrees. The results have also shown that 373 to 1106 polymorphic loci exist in each of most pairs of inbreds in an identical genetic background. Therefore the authors have concluded that RAD- Seq can be a powerful genotyping tool in the future maize GwS.
Key words: genomewide selection, inbred line, maize breeding, molecular polymorphism, RAD-Seq
Received 2015.8.31, accepted 2015.11.19
a Present address: Ryukoku University, Otsu, 520-2194 Japan
b Present address: National Institute for Basic Biology, Okazaki, 444-8787 Japan
Hiroyuki TAMAKI, Shohei MITSUHASHI, Hiroshi KUDOH1, Atsushi J. NAGANO1,2,a and Masaki YASUGI1,b
Genomewide Molecular Polymorphisms among Maize (Zea mays L.) Inbred Lines Found from Restriction-Associated DNA Tag Sequencing (RAD-Seq) Analysis as a Preliminary Study on ‘Genomewide Selection’ for Breeding by
Japanese Public Sectors
Forage Crop Research Division,
NARO Institute of Livestock and Grassland Science, Nasushiobara, 329-2793 Japan
1 Kyoto University, Otsu, 520-2113 Japan
2 Japan Science and Technology Agency (JST) PRESTO, Kawaguchi, 332-0012 Japan
declined in recent years (Yan et al.14)), it has become feasible especially for the maize breeding teams in Japanese public sectors to adopt molecular breeding techniques where markers should be arranged over the whole genome12).
‘Genomewide selection (GwS)’ is one of such techniques;
its details and concept are explained in Bernardo and Yu3) and Meuwissen et al.9). The focus of GwS is on accumulating favorable genes in many minor quantitative trait loci (QTLs) whereby the yield is deemed controlled15). In addition, GwS can be started from a biparental population, i.e. with molecular-marker information on a small number of inbred lines (hereinafter referred to as inbreds). Therefore, introducing GwS to Japanese maize breeding programs is quite valuable to accelerate yield improvement.
The purpose of this study was to evaluate the potential of ‘restriction- associated DNA sequencing’
analysis (hereafter referred to as RAD-Seq) as the genotyping tool of the maize GwS. The details of RAD- Seq are described in Baird et al.1). Briefly, it is a molecular technique with restriction enzymes and such a sequencing system as HiSeq™ of Illumina™, providing sequence information near the restriction sites of multiple samples with high reproductivity10). As numerous restriction sites are thought distributed over the whole maize genome, RAD-Seq is expected to detect a remarkable number of genomewide molecular polymorphisms among hundreds of the tested samples at once. Our previous computer- simulation study12) has revealed that molecular markers should be placed at the intervals of 20cM or shorter for the success of GwS. Based on the reports in the website (http://www.maizegdb.org/complete_map?id=1203637) that the entire linkage-map length is about 1808cM, it means that at least 90 (=1808/20) molecular markers should be arranged for this purpose. The numbers of polymorphic molecular loci should greatly exceed 90 in most cases because the locations of such loci are thought biased over the genome. Therefore the point at which the authors were most interested has been how many reliable molecular polymorphisms were detected from RAD-Seq between a potential pair of inbreds in an identical genetic group whose F2 progeny would be genotyped. In addition, the advantages of RAD-Seq have also been discussed from its economic aspects; Nagano10) have reported that it costs only JPY350000 for a RAD-Seq operation for 200 samples, as small as JPY1750 per sample. Therefore the authors have
regarded it as a highly feasible genotyping tool candidate in the maize GwS to boost breeding programs. A number of reports have been made on the genotyping results with RAD-Seq on major crops including maize (e.g. Beissinger et al.2), Davey et al.6)). None of them, however, have provided convincing information on its potential as the genotyping tool for GwS, especially on the following three points, (1) how many polymorphic molecular loci would be detected between a pair of inbreds in an identical genetic group (not among miscellaneous materials), (2) how many of them can be judged potential as the molecular markers for the GwS (our preliminary analyses have revealed that a remarkable number of polymorphisms seem to have come from repeated sequences within an inbred and that they cannot be adopted as markers for GwS), and (3) whether the potential polymorphic loci are distributed genomewide or not. Therefore the authors especially focus the discussion on these three points.
Materials and Methods
Plant materials and DNA preparation
Table 1 shows the list of the genotyped parental inbreds. All but three, ‘Mi108’, ‘Ki44’ and ‘Na106’, were also genotyped in our previous study13) where single nucleotide polymorphisms (SNPs) were detected with
“maizeSNP50 beadchip”, a product of Illumina Inc. (San Diego, CA, U.S.) (http://www.illumina.com/products/
maizesnp50_dna_analysis_kit.html). All of the inbreds were developed in the Japanese public sectors; National Agriculture and Food Research Organization (NARO) Hokkaido Agricultural Research Center (NARO/HARC), Nagano Animal Industry Experiment Station (NAIES), NARO Kyushu Okinawa Agricultural Research Center (NARO/KARC) and NARO Institute of Livestock and Grassland Science (NARO- ILGS) developed inbreds whose names start with “Ho”, “Ki”, “Mi” and “Na”, respectively. The inbreds are classified into three groups in terms of their genetic backgrounds (they are hereafter called genetic groups); dent mainly derived from U.S. corn- belt dent (MD), semi-dent mainly developed from hybrids for summer seeding (RD) and flint mainly derived from Japanese landraces (JF). Their seeds were provided from the stocks in NARO-ILGS for breeding experiments. Only one individual per inbred was sampled for DNA preparation,
because our previous study on SNP polymorphisms13) has revealed that more than 96% of the SNPs are identical
between two individuals within an inbred.
The DNA preparation was made in the following two stages. The first, from cutting young leaves from the seedlings to obtaining the boiled stocks, was completely equivalent to our previous genotyping study13). In short, after the leaf of each material was frozen and milled, ‘PrepMan™ Ultra Reagent’ of Life Technologies Corporation (Carlsbad, CA, U.S.) was added to the milled leaf, and then the mixture in a plastic tube was kept in boiling water for extraction. After cooled down, the tube was centrifuged to obtain the supernatant containing the purified genomic DNA. The second stage, the authors adopted for the first time for DNA purification, followed the protocol of ‘DNeasy Plant Mini Kit™’ of Qiagen (Valencia, CA, U.S.) where the 100 μl of the supernatant having been collected in the former stage was subjected as the wet starting material. After the preparation, The DNA concentration was measured with ‘Qubit™ 2.0 Fluorometer (with dsDNA HS assay kit)’ of Life Technologies, to adjust to 10 ng μl-1 for the subsequent sequencing.
Sequencing and genotyping
In the procedures for sequencing with ‘HiSeq 2000’, a product of Illumina, the authors followed the protocol of Peterson et al.11) with the following several modifications. (1) Genomic DNA of 175 maize materials including the 34 inbreds shown in Table 1 was digested with two restriction endonucleases, NdeI and BglII. (2) Two kinds of Y-shaped adopters (whose sequences are shown in Supplements as TruSeq_NdeI_adaptors 1 and 2, and TruSeq_BglII_adaptors 1 and 2, respectively) were ligated with T4 DNA ligase to the digested ends. Each adopter was arranged to ligate only to the sticky end of each restriction enzyme. (3) Primers (whose sequences are shown in Supplements as TruSeq_Univ_primer 2 and TruSeq_IP001_xxxxxx) were added for the subsequent polymerase chain reaction (PCR). The 5'-end primers also carry index sequences for material identification. (4) PCR was performed with KOD-Plus-Neo (TOYOBO) (94
°C for 2min, 20 cycles of 98°C for 10 sec, 65°C for 30 sec, 68°C for 30 sec), whereby selectively amplified were only the fragments that have both digested ends of the two restriction enzymes. (5) Approximately 270 – 300 base pair (bp) fragments were selected with E-Gel™ size select (Life Technologies) after all of the amplified DNA from each Group Inbreds Numbers of catalogs (loci)1)
All Trustable Potential
MD2) Ho102 * 136173 25630 4466
Ho104 * 113135 21938 3886
Ho110 * 143188 28062 4724
Ki66 * 143399 25894 4472
Ki70 * 140445 28366 4838
Ki74 * 108734 21455 3775
Mi29 * 159289 27726 4808
Mi88 * 114736 24366 4206
Mi108 142579 29702 5052
Na65 * 111016 21953 3771
Na71 * 105777 20369 3425
Na99 * 176689 30274 5156
Na102 * 146238 31603 5262
RD2) Mi62 * 106205 23268 4108
Mi71 * 138225 26417 4280
Mi91 * 103435 20116 3412
Mi93 * 138247 24798 4327
Mi106 * 148407 25724 4158
JF2) Ho95 * 149352 26553 4535
Ki44 234521 32703 5190
Ki68 * 161854 28548 4778
Ki75 * 151273 27149 4653
Mi47 * 165855 29852 5047
Mi103 * 169001 31770 5367
Mi111 * 177260 35336 5592
Na50 * 152414 26786 4365
Na91 * 163036 26255 4136
Na96 * 199997 30208 4953
Na101 * 186192 26541 4622
Na103 * 199997 37129 5707
Na104 * 271242 37787 5866
Na105 *3) 169838 30514 5130
Na106 131065 29676 4949
N09-07 * 133226 26261 4300
"Average over
the 34 inbreds" 152707 27669 4627 Total (duplicates
excluded) 1280484 152658 14384
* The inbreds also genotyped in the previous SNP study by the authors13).
1) All loci: provided in the genotyping process by Stacks.
Trustable loci: depth are seven or more, no plural alleles and identified cordinates. Potential loci: polymorphic trustable loci. (See Materials and Methods for more details).
2) MD, RD and JF are the dent genetic group from U.S.
corn-belt, the semi-dent genetic group from hybrids for summer seeding, and the flint genetic group from Japanese landraces, respectively (See Mateirlas and Methods for more details).
3) Genotyped as 'N10-03' in our previous SNP study13). Table 1. The list of 34 inbreds genotyped in this study with
RAD-Seq, and the numbers of the catalogs (loci) provided from the genotyping
material was mixed into a stock. And (6) 50 bp sequences of the BglII-digested side in the DNA fragments were read by HiSeq2000 (Illumina).
To remove reads containing low-quality bases and adapter sequences, raw sequence reads were preprocessed with ‘Trimmomatic’ ver. 0.32 (Bolger et al.5)), where the followings were the adopted conditions; ILLUMINACLIP:
TruSeq3- SE.fa:2:30:10, LEADING: 19, TRAILING: 19, LIDINGWINDOW: 30:20, AVGQUAL: 20, MINLEN: 51.
Sequence reads were then processed with Stacks ver. 1.20 (http://creskolab.uoregon.edu/stacks/), with the reference to the entire genomic sequence information of ‘B73’, which is a maize inbred recognized worldwide as the most standard, shown in the website (http://www.ebi.ac.uk/ena/data/view/
GCA_000005005.5). The default setting options were adopted in this process, namely, ‘m’ and ‘n’ values were set to 1 and 0, respectively, in running the program ‘ref_
map.pl’. The data having been provided from Stacks were at first sorted in terms of ‘catalogs’ each of which carries information of its standard 50 bp sequence in addition to its coordinate (location in the genome with referring the entire genomic sequence information), i.e. the information of each catalog was connected with that of each inbred on depth (the number of read copies) and allele(s) (hereafter a
‘catalog’ will be called a locus because, in the maize GwS and other molecular breeding, a catalog will be regarded and handled as a molecular locus). Subsequently, loci of each inbred were filtered out if their depths were less than seven (because such small numbers of repetitions were not thought trustable enough in determining the relevant genotypes) or if plural alleles were judged to exist within the inbred (because such plural alleles within an inbred might be the reflection of repeated sequences from plural genome regions). The loci not filtered out were defined in this study as ‘trustable loci’. Then each trustable locus was surveyed on polymorphisms (any kinds of different sequence information including insertion or deletion) over the 34 inbreds, and those having any polymorphism(s) were defined as ‘potential loci’. The following analyses and discussion were made based only on the potential loci.
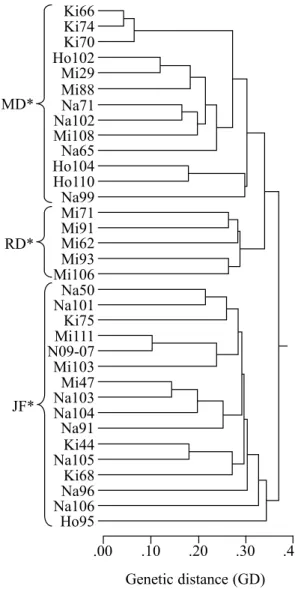
Dendrogram drawing
Based on the polymorphisms on the potential loci, the authors drew a dendrogram of the 34 inbreds for the verification of the reliability of the obtained data by comparing with those drawn in the previous studies on simple sequence repeat (SSR) (Enoki et al.7)) and on SNP genotyping13), and with the pedigree of each inbred. The
Chromosome numbers
Total
1 2 3 4 5 6 7 8 9 10
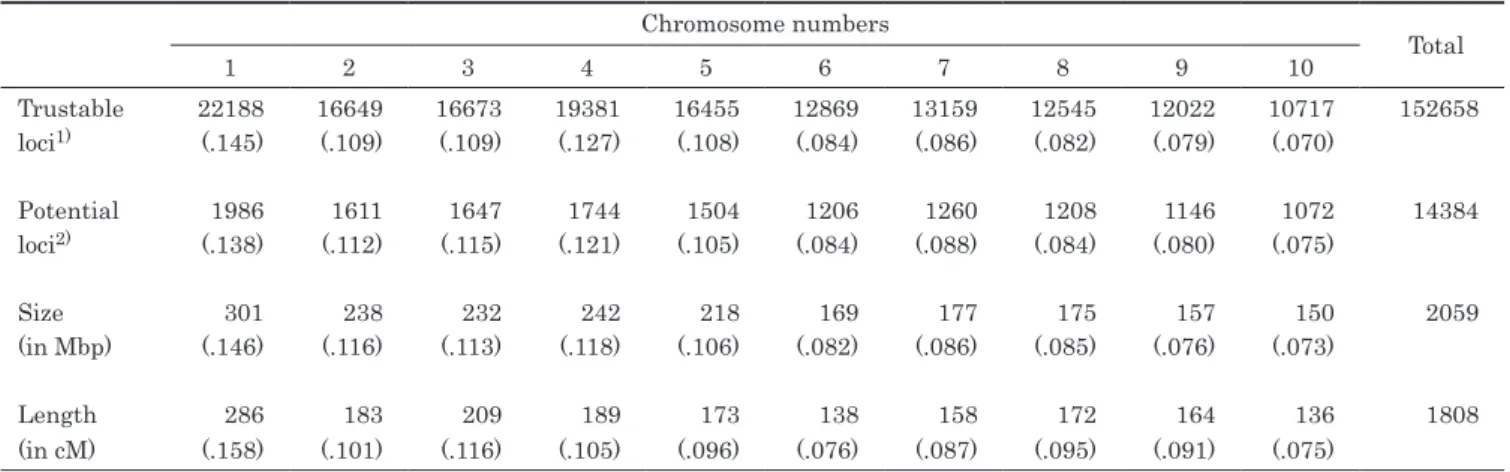
Trustable 22188 16649 16673 19381 16455 12869 13159 12545 12022 10717 152658
loci1) (.145) (.109) (.109) (.127) (.108) (.084) (.086) (.082) (.079) (.070)
Potential 1986 1611 1647 1744 1504 1206 1260 1208 1146 1072 14384
loci2) (.138) (.112) (.115) (.121) (.105) (.084) (.088) (.084) (.080) (.075)
Size 301 238 232 242 218 169 177 175 157 150 2059
(in Mbp) (.146) (.116) (.113) (.118) (.106) (.082) (.086) (.085) (.076) (.073)
Length 286 183 209 189 173 138 158 172 164 136 1808
(in cM) (.158) (.101) (.116) (.105) (.096) (.076) (.087) (.095) (.091) (.075)
* The value in each parenthesis indicates the ratio of the relevant chromosome toward the total.
The size and length of each chromosome are quoted from the websites
http://www.ebi.ac.uk/ena/data/view/GCA_000005005.5 and http://www.maizegdb.org/complete_map?id=1203637, respectively.
1) A molecular locus is judged trustable if it fulfill the following three conditions in at least one of the 34 inbred lines shown in Table 1, i.e.,
(1) its depth is seven or more,
(2) no plural alleles exist within the relevant inbred lines, and (3) its cordinates have been identified.
2) A trustable locus is judged potential if polymorphisms have been found among the inbred lines.
See Materials and Methods for more details of trustable and potential loci.
Table 2. The numbers of trustable and potential loci (found among the 34 inbreds), and the sizes and lengths of each chromosome
rules for the drawing were mostly equivalent to those in our previous SNP genotyping study13), where the calculation of genetic distance (GD) of each pair have been made on the ratio of polymorphic potential loci toward all shared ones, and where the drawing was made in the unweighted pair group method with arithmetic mean (UPGMA). The exceptional difference in the drawing rules between this study and the previous one was that the polymorphism judgement was made only on whether the sequences of the two relevant inbreds were equivalent or not, i.e. the number of polymorphic nucleotide(s) per locus was disregarded.
Results and Discussion
As shown in Table 1, 1.28×10⁶ catalogs (substantially equivalent to loci) were provided in the genotyping process by Stacks on the 34 inbreds. About 12% of them, 1.53 × 10⁵, were judged trustable in at least one inbred, and 14384 trustable loci were judged potential, namely had any kinds of polymorphisms among the inbreds.
These trustable and potential loci were found distributed genomewide without unevenness (Table 2). Figure 1 is a dendrogram drawn based on the calculated GDs. The GD between two inbreds ranged from 0.049 (=135/2747, between ‘Ki66’ and ‘Ki74’) to 0.435 (=1317/3026, between
‘Na99’ and ‘Na103’) with the average of 0.344. The dendrogram well accords with the previous studies and the pedigrees. For example, (1) it shows that molecular polymorphisms clearly divide the three genetic groups MD, RD and JF, as reported in Enoki et al.7). (2) It accords with the pedigrees that ‘Ho102’ has been developed from a three-way cross of (‘Na7’בMi29’)בMi29’, and that
‘Mi111’ and ‘N09-07’ have been developed from the same F2 line. And, (3) this dendrogram shows what have been found in our previous SNP study13), i.e., that ‘Ki66’, ‘Ki70’
and ‘Ki74’ have extremely close genetic backgrounds to each other, that ‘Ho95’ is quite distant from any other inbreds belonging to the same JF group, and that the GDs between ‘Na50’ and ‘Na101’ and between ‘Mi47’
and ‘Na103’ are relatively close though they have been developed independently. (Hereafter the five pairs, ‘Ho102’
and ‘Mi29’, ‘Mi111’ and ‘N09-07’, ‘Ki66’ and ‘Ki70’,
‘Ki66’ and ‘Ki74’, and ‘Ki70’ and ‘Ki74’, are excluded from the subsequent discussion on the potential of RAD- Seq for GwS, because GwS for such a pair of inbreds
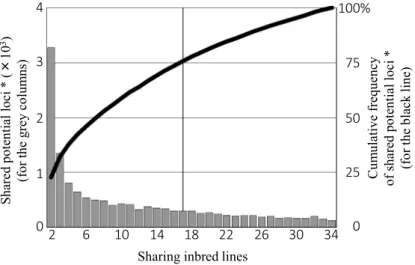
having extremely close genetic backgrounds to each other is thought impractical.) Table 3 shows the numbers of polymorphic potential loci found from pairs in identical genetic groups. The numbers ranged from 373 (between
‘Mi88’ and ‘Na71’) to 1106 (between ‘Na103’ and ‘Na106’) unless the pairs have extremely close genetic backgrounds to each other. Figure 2 is a mixed graph to describe how many potential loci are shared by how many inbred lines. It shows the tendency that each of most loci are shared only by a small number of inbreds; more than 75% (10871) of the
Ki66Ki74 Ki70
Mi111 N09-07 Ho102 Mi29
Na103Mi47 Na102Na71
Ho104 Ho110
Na105Ki44 Na104 Mi88 Mi108
Na101Na50 Na65 Mi71Mi91
Mi103 Mi106Mi93
Na91 Ki75 Mi62
Na96Ki68 Na99
Na106 Ho95 RD*
JF*
.00 .10 .20 .30 .40 Genetic distance (GD) MD*
Fig. 1. The unweighted pair group method with arithmetic mean (UPGMA) dendrogram of genetic relationships among 34 inbred lines calculated on the basis of genetic distances of the 4627 trustable polymorphic loci obtained.
* MD, RD and JF are the dent genetic group from U.S. corn- belt, the semi-dent genetic group from hybrids for summer seeding, and the flint genetic group derived from Japanese landraces, respectively (See Materials and Methods for more details).
14384 potential loci are shared by less than a half (17) of the all 34 inbreds. Table 1 also suggests this tendency, showing that each inbred holds only 3412 to 5866 potential loci.
The authors have concluded from these results that RAD-Seq can be a powerful genotyping tool in the future maize GwS for the following two reasons. One is that the dendrogram of this study well accords to those of the previous ones (Figure 1), meaning that the genotyping
information is trustable enough as a whole. The other is that the RAD-Seq operation of this study provided sufficient numbers not only of trustable molecular loci on each material (3412 to 5866) distributed genomewide (Tables 1 and 2), but also of polymorphic potential loci found in each of most pairs of inbreds in identical genetic groups (more than 373 unless the pair of inbreds have extremely close genetic backgrounds to each other, Table 3). Considering the Table 3. The number of polymorphic potential loci found in each pair of inbreds belonging to the same genetic groups.
(A) MD*
Na102 Na99 Na71 Na65 Mi108 Mi88 Mi29 Ki74 Ki70 Ki66 Ho110 Ho104
Ho102 738 763 463 597 754 404 3892) 641 697 706 808 652 Ho104 772 758 536 540 834 642 764 630 749 699 469 Ho110 962 841 631 695 1004 761 915 732 907 838 Ki66 765 886 576 656 855 672 770 1351) 2311)
Ki70 742 878 530 669 868 694 779 1961) (B) RD*
Ki74 666 755 500 568 749 602 717 Mi106 Mi93 Mi91 Mi71
Mi29 674 794 509 525 646 602 Mi62 601 709 556 640
Mi88 658 757 3733) 577 662 Mi71 625 668 508
Mi108 654 920 460 530 Mi91 551 644
Na65 603 732 460 Mi93 636
Na71 408 617 Na99 894
(C) JF*
N09-07 Na106 Na105 Na104 Na103 Na101 Na96 Na91 Na50 Mi111 Mi103 Mi47 Ki75 Ki68 Ki44 Ho95 799 940 956 1040 1051 992 935 829 865 978 982 1008 867 903 919 Ki44 766 862 590 933 966 847 968 758 758 919 1001 782 787 737 Ki68 795 901 832 858 828 840 786 707 690 983 930 781 764 Ki75 668 888 878 870 779 806 840 714 608 759 920 700 Mi47 687 1024 953 751 539 990 864 597 842 937 973 Mi103 697 1038 1025 919 978 960 920 757 768 833 Mi111 3412) 1031 998 992 1006 942 981 814 630 Na50 622 810 787 778 803 587 663 665 Na91 663 788 715 752 625 719 756 Na96 790 968 971 962 932 950 Na101 856 746 746 970 1050 Na103 771 11063) 1061 751 Na104 763 1052 1074 Na105 894 785 Na106 861
* MD, RD and JF are the dent genetic group from U.S. corn-belt, the semi-dent genetic group from hybrids for summer seeding, and the flint genetic group from Japanese landraces, respectively (see Materials and Methods for more details).
1) Because 'Ki66', 'Ki70' and 'Ki74' are judged genetically extremely close to each other, the relevant three pairs (shown in the italic font with underlines) have been excluded from discussion on the potential of GwS (see Materials and Methods for more details).
2) The pairs of 'Ho102' and 'Mi29' and 'Mi111' and 'N09-07' (shown in the italic font with underlines) have been excluded from discussion on the potential of GwS because of their extremely close pedigrees (see Materials and Methods for more details).
3) The pairs of 'Na103' and 'Na106' and 'Mi88' and 'Na71' (shown in the bold font with underlines) have been found to have the most and least potential loci among all pairs shown above but the five mentioned above.
findings from our previous computer-simulation study12) that the GwS requires at least 90 molecular markers arranged genomewide, RAD-Seq can be judged to provide sufficient numbers of polymorphic potential loci, and to be a highly potential genotyping tool for the maize GwS. The previous studies on RAD-Seq handling miscellaneous materials (e.g.
Chattopadhyay et al.4)) have also reported the tendency shown in Figure 2 that each of most loci are shared only by a small number of entries. It will be an annoying problem in genotyping materials having been derived from a wide genetic background, but not in the maize GwS the authors consider to adopt, because the genotyping will be made in this GwS not on such miscellaneous materials but on an F2
population derived from a pair of inbreds. Therefore RAD- Seq can be regarded as a feasible genotyping tool for the GwS also in terms of this point.
References
1) Baird, N.A., Etter, P.D., Atwood, T.S., Currey, M.C., Shiver, A.L., Lewis, Z.A., Selker, E.U., Cresko, W.A.
and Johnson, E.A. (2008). Rapid SNP discovery and genetic mapping using sequenced RAD markers, PLoS ONE, 3(10), e3376.
2) Beissinger, T.M., Hirsch, C.N., Sekhon, R.S., Foerster, J.M., Johnson, J.M., Muttoni, G., Vaillancourt, B, Buell, C.R., Kaeppler, S.M. and de Leon, N. (2013). Marker density and read-depth for genotyping populations using genotyping-by- sequencing, Genetics, 193, 1073–
1081.
3) Bernardo, R. and Yu, J. (2007). Prospects for genomewide selection for quantitative traits in maize, Crop Sci., 47, 1082–1090.
4) Chattopadhyay, B., Garg, K.M. and Ramakrishnan, U.
(2014). Effect of diversity and missing data on genetic assignment with RAD-Seq markers, BMC Res. Notes, 7, 841.
5) Bolger, A.M., Lohse, M. and Usadel, B. (2014).
Trimmomatic: A flexible trimmer for Illumina Sequence Data, Bioinformatics, btu170.
6) Davey, J.W., Hohenlohe, P.A., Etter, P.D., Boone, J.Q., Catchen, J.M. and Blaxter, M.L. (2011). Genome-wide genetic marker discovery and genotyping using next- generation sequencing, Nat. Rev. Genet., 12, 499–510.
7) Enoki, H., Sato, H., and Koinuma, K. (2002). SSR analysis of genetic diversity among maize inbred lines adapted to cold regions of Japan, Theor. Appl. Genet., 104, 1270–1277.
Fig. 2. A mixed graph to describe how many potential loci* are shared by how many inbred lines (by the grey columns with the left scale), and the cumulative frequency toward the total 14384 potential loci (by the black line with the right scale).
* A molecular locus is defined potential if it fulfills the following three conditions in at least two of the 34 inbred lines shown in Table 1,
(1) its depth (the number of copies) is seven or more,
(2) plural alleles do not exist within the relevant inbred line, and (3) polymorphism exists between/among the inbred lines.
See Materials and Methods for more details.
Shared potential loci * (×103) (for the grey columns)
Sharing inbred lines 1
2 3
0 4
2 6 10 14 18 22 26 30 34 0 25 50 75 100%
Cumulative frequency of shared potential loci * (for the black line)
8) MAFF (2014). Fiscal Year 2013 Annual Report on Food, Agriculture and Rural Areas in Japan -Summary, 1-36, Ministry of Agriculture, Forestry and Fisheries of Japan.
9) Meuwissen, T.H.E., Hayes, B.J. and Goddard, M.E.
(2001). Prediction of total genetic value using genome- wide dense marker maps, Genetics, 157, 1819–1829.
10) Nagano, A.J. (2013). Genomewide SNP analyses with the cost starting from JPY3000 per sample, Center for ecological research news Kyoto University, 119, 5 (in Japanese).
11) Peterson, B.K., Weber, J.N., Kay, E.H., Fisher, H.S.
and Hoekstra, H.E. (2012). Double digest RADseq: an inexpensive method for de novo SNP discovery and genotyping in model and non-model species, PLoS ONE 7(5), e37135.
12) Tamaki, H., Sato, H., Kikawada, T. and Mitsuhashi, S.
(2012) Preliminary study on ‘genomewide selection’
for maize (Zea mays L.) breeding in Japanese public sectors: Estimated selection response in the first selfing cycle of single-cross progeny, Grassl. Sci., 58, 20–27.
13) Tamaki, H., Matsumoto, T., Mitsuhashi, S., Okumura, N., Kikawada, T. and Sato, H. (2014). A study on
‘genomewide selection’ for maize (Zea mays L.) breeding in Japanese public sectors: single nucleotide polymorphisms observed among parental inbred lines, Bull. NARO Inst. Livest. Grassl. Sci., 14, 1–11.
14) Yan, J., Yang, X., Shah, T., Sa´nchez-Villeda, H., Li, J.,
Warburton, M., Zhou, Y., Crouch, J.H. and Xu, Y. (2010).
High-throughput SNP genotyping with the GoldenGate assay in maize, Mol. Breed. 25, 445–451.
15) Yu, J. and Buckler, E.S. (2006). Genetic association mapping and genome organization of maize, Curr. Opin.
Biotech., 17, 155–160.
Supplements
Oligo-nucleotide sequences TruSeq_NdeI_adaptor 1
/5Phos/T*A*GAGATCGGAAGAGCACACGTCTGAACTC CAGTC*A*C
TruSeq_NdeI_adaptor 2
G*T*CAAGTTTCACAGCTCTTCCGATC*T*C TruSeq_BglII_adaptor 1
A*A*TGATACGGCGACCACCGAGATCTACACTCTTTC CCTACACGACGCTCTT*C*C
TruSeq_BglII_adaptor 2
G*A*TCGGAAGAGCTGTGCAGA*C*T TruSeq_Univ_primer 2
AATGATACGGCGACCACCGAGATCTACACTCTTTCCC TACACGA
TruSeq_IP001_xxxxxx
CAAGCAGAAGACGGCATACGAGATXXXXXXGTGACTG GAGTTCAGACGTGT
“ * ” = phosphorothioate bond XXXXXX = 6 mer index sequence
摘 要
著者らは,日本の公的機関が行っているサイレージ用トウモロコシ育種における収量性改良の効率化のためにゲ ノムワイドセレクション(GwS)の導入を検討しているが,GwSでは同一の遺伝背景を持つ一対の親自殖系統間にお いてゲノム全体にわたり 90 個以上の分子マーカーを配置する必要がある。本研究の目的は,GwSにおけるジェノタ イピング手法としてのRAD-Seq法の有用性を評価することであった。制限酵素と次世代シークエンサーを用いてゲ ノム全体のジェノタイピングを行うRAD-Seq法の長所は高い再現性と少ない解析費用である。日本の公的機関が育 成した3群の遺伝背景に由来する 34 親自殖系統の分子多型をRAD-Seq法により調査した結果,ゲノム全体にわたる 14384 の多型が発見された。これらの多型を基に描かれた樹形図は,既往の研究および各親自殖系統の育成記録とよ く一致した。また同一の遺伝背景を持つ一対の親自殖系統の間に発見された多型の数は,両者が極端に近縁でない限 り 373 個から 1106 個であった。以上のことから著者らは,RAD-Seq法が将来のGwSにおけるジェノタイピング手 法として高い潜在性を持っていると結論した。
キーワード:ゲノムワイドセレクション,自殖系統,トウモロコシ育種,分子多型,RAD-Seq法 玉置宏之・三ツ橋昇平・工藤洋1・永野惇1,2,a・八杉公基1,b
農研機構畜産草地研究所 草地管理研究領域,那須塩原市,329-2793
1 京都大学,大津市,520-2113
2 科学技術振興機構さきがけ研究員,川口市,332-0012
日本の公的機関でのトウモロコシ(Zea mays L.)育種のためのゲノムワイド セレクションの予備研究として行われた RAD-Seq 法により発見された
親自殖系統群内のゲノム全体にわたる分子多型
a 現 龍谷大学,大津市,520-2194
b 現 基礎生物学研究所,岡崎市,444-8787
Introduction
In Japan, the market value of a beef carcass greatly depends on the marbling score, which is determined by the degree of marbling of intramuscular fat in the longissimus thoracis muscle 11), and meat with a high score is expensive 20). Several factors, including the breed 13,25), length of the fattening period 21), type of grain 33), and
amount of feed 25), can affect marbling or the intramuscular fat content. Vitamin A (VA) restriction contributes to high- quality beef production by increasing both the amount of marbling 6,7,19,24) and the level of monounsaturated fatty acid in meat 24). However, VA is an essential factor for several biological processes in mammalian species 3). During the fattening of Japanese Black steers, which is known as breed with excellent marbling, VA restriction throughout Abstract
The objective of this study was to establish the effect of vitamin A (VA) feeding status on the plasma concentrations of acylated ghrelin, insulin, glucose, and leptin in Japanese Black steers. Eight 14-month-old Japanese Black steers were fattened for 58 weeks. The experimental period was divided into stages 1 (weeks 1–28), 2 (weeks 29–44), and 3 (weeks 45–58). The steers were divided into 3 groups: S (n = 2, VA supplemented), R (n = 3, VA restricted), and RS (n = 3, VA restricted in stages 1 and 2 and supplemented in stage 3). In stage 2, groups R and RS showed lower plasma VA and ghrelin concentrations than those in group S. In stage 3, group R showed lower values for the above concentrations than those in groups S and RS. Group RS showed lower values for the above concentrations and metabolizable energy (ME) intakes in the VA-restricted stage 2 than in the VA-supplemented stage 3. However, VA restriction did not affect the plasma concentrations of insulin, glucose, or leptin. In conclusion, long-term VA restriction decreased the plasma concentrations of VA and acylated ghrelin as well as ME intake in Japanese Black steers. Decreased ghrelin levels may be associated with the decreased feed intake in the VA-restricted cattle.
Key words: fattening, ghrelin, Japanese Black steers, vitamin A restriction
Masayuki HAYASHI, Kyoko KIDO1 and Kyoko HODATE2a
Received 2015.1.30, accepted 2015.11.9
a Retired
Changes in Plasma Ghrelin Concentrations in Vitamin A–restricted Japanese Black Steers
Animal Physiology and Nutrition Research Division,
NARO Institute of Livestock and Grassland Science, Tsukuba, 305-0901 Japan
1 Grassland Management Research Division,
NARO Institute of Livestock and Grassland Science, Miyota, 389-0201 Japan
2 Livestock Research Support Center,
NARO Institute of Livestock and Grassland Science, Tsukuba, 305-0901 Japan
the fattening period reduces feed intake and causes intermuscular edema 10). Reduced feed intake is a well- known effect of VA restriction in other breeds of cattle 8,32). However, there have been few studies related to appetite- regulating factors in VA-restricted cattle. There have been previous studies regarding leptin 10,29) and insulin 29) in VA- restricted steers as well as glucose and insulin-like growth factor I in vitamin A-, D3-, and E-restricted steers 14). In those studies, VA restriction did not influence these appetite-regulating factors. However, other factors may influence feed intake in VA-restricted cattle.
Here, we focused on an another peptide hormone, ghrelin. Ghrelin, which was discovered in the stomachs of rats 12), is believed to stimulate appetite 15). Furthermore, in cattle, ghrelin-positive cells are present in the abomasum 9), and ghrelin administration increases the time spent eating and dry matter intake in beef cattle 31). However, there have been no reports regarding ghrelin in VA-restricted cattle. We hypothesized that VA restriction affects ghrelin concentrations in cattle. The objective of this study was to evaluate the effect of VA restriction on circulating levels of hormones, including ghrelin, and glucose in fattening Japanese Black steers.
Materials and Methods
Animals, management, and treatments
All animals received humane care as outlined in the Guide for the Care and Use of Experimental Animals (Animal Care Committee, NARO Institute of Livestock and Grassland Science).
The experiment included eight half-sibling Japanese Black steers, aged 14 months. Those steers were bought at a livestock market and the experiment was started after the quarantine period and the animals were housed in a pen and mangers with door feeders (Orion Machinery, Suzaka, Japan) equipped with automatic locks that respond to a magnetic device attached to the cattle’s collar. This enables the feed intake measurement for each animal in the group housing. Their mean body weight (BW) ± standard error (SE) was 338.2 ± 13.8 kg. The experiment duration was 58 weeks. The periods from weeks 1–28, weeks 29–44, and weeks 45–58 were defined as stages 1, 2, and 3, respectively. The steers were randomly assigned to three groups for VA treatment.
Group S (n = 2) received weekly oral supplementation of 296.8 IU VA/kg BW (42.4 IU/kg BW/day) throughout the experimental period. Group R (n = 3) was subjected to restricted VA administration, whereby once supplemental VA per 4 weeks was administered only when the plasma VA concentration was near or below 30 IU/dL to prevent deficiency, according to the feeding standard 1). Group RS (n = 3) was subjected to restricted VA administration, as described for group R during stages 1 and 2, but received oral VA supplementation as described for group S during stage 3. The supplement was VA palmitate (2000 IU/g as VA; BASF Vitamins Co., Ltd., Tokyo, Japan). No steers exhibited serious symptoms of VA deficiency as a result of the VA treatment in this experiment.
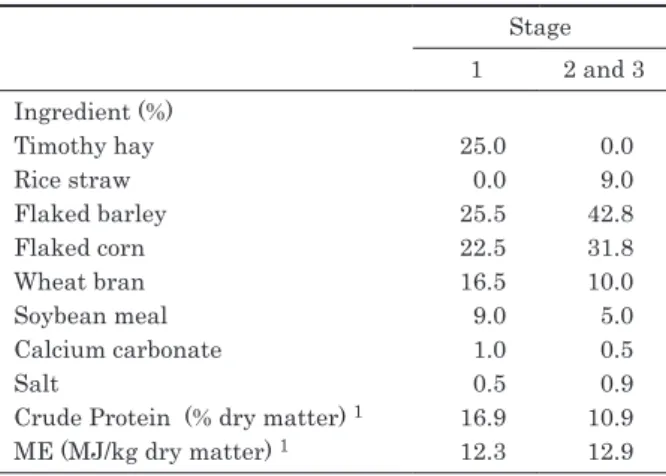
The feeding conditions were designed according to the Japanese Feeding Standard for Beef Cattle 1) and were typical for beef cattle in Japan. Compositions of the experimental diets are shown in Table 1. The designed concentrate to roughage ratios were 75:25 for stage 1 and 91:9 for stages 2 and 3. Timothy hay was used as roughage in stage 1, and rice straw, which generally contains low levels of the VA precursor β-carotene, was used in stages 2 and 3. The steers were offered enough feed to obtain daily gain (DG) of 1.0 kg in stages 1 and 2 and 0.7 kg in stage 3. The steers were housed in a pen equipped with an individual discriminating door feeder and were fed once daily at 09:00 h. Fresh water was always available.
BW and metabolizable energy (ME) intake
BW was measured before feeding at the beginning
Stage
1 2 and 3
Ingredient (%)
Timothy hay 25.0 0.0
Rice straw 0.0 9.0
Flaked barley 25.5 42.8
Flaked corn 22.5 31.8
Wheat bran 16.5 10.0
Soybean meal 9.0 5.0
Calcium carbonate 1.0 0.5
Salt 0.5 0.9
Crude Protein (% dry matter) 1 16.9 10.9
ME (MJ/kg dry matter) 1 12.3 12.9
1 Values calculated from Standard Tables of Feed Composition in Japan 16)
Table 1. Composition of experimental diets
of the experiment (week 0) and every 2 weeks. ME intake was calculated from the daily recording of dry matter intakes and Standard Tables of Feed Composition in Japan 16). The DG and ME intake values were summarized as means for each stage.
Measurement of plasma VA, hormone, and glucose concentrations
Blood samples were collected from the jugular vein of the cattle every 4 weeks before feeding. Blood samples for hormone and glucose measurements were collected into vacuum blood collection tubes containing EDTA·2Na (Venoject II; Terumo, Tokyo, Japan); 5000 Kallikrein Inhibitor Units of aprotinin solution (Trasylol;
Bayer, Leverkusen, Germany) were added to 10 mL of blood, and the sample was then placed on ice. Blood samples were then centrifuged at 4 °C for 20 min at 1000 g.
Plasma samples for the ghrelin assay were acidified using a 1:10-volume of 1 N HCl to preserve the integrity of acylated ghrelin. Plasma samples for VA concentration measurement were collected into tubes containing heparin (Venoject II), placed on ice, and centrifuged at 4 °C for 20 min at 1000 g.
All samples were stored at -80 °C until analysis. Plasma VA concentrations were measured through high performance liquid chromatography 5). Acylated ghrelin concentrations were measured using a ghrelin (active) radioimmunoassay (RIA) kit (Linco Research Inc., St. Charles, MO, USA).
Insulin concentrations were measured with an insulin Eiken RIA kit (Eiken Chemical Co. Ltd., Tokyo, Japan). Leptin concentrations were measured using a multi-species leptin RIA kit (Linco Research Inc.). The intra- and inter-assay coefficients of variation (CV) for the ghrelin RIA were 3%
and 1%, respectively. The insulin was assayed in a single RIA with the intra-assay CV of 3%. The intra- and inter- assay CVs for the leptin RIA were 3% and 4%, respectively.
Plasma glucose concentrations were measured using the Glucose CII Test Wako kit (Wako Pure Chemical Industries, Osaka, Japan).
Statistical analyses
All values are expressed as means and SE unless otherwise stated. The DG and ME intake values and plasma VA, hormone, and glucose concentrations were analyzed using the MIXED procedures (SAS Institute Inc., Cary, NC, USA). The VA treatment, stage, and their interaction
were treated as fixed effects, and each steer was treated as a random effect. For the analysis of the DG and ME intake,
“variance components” were specified as the covariance structure in the REPEATED statement; for all other factors, “first-order autoregressive” was specified. If a treatment, stage or interaction was significant at P < 0.05, the significance was evaluated via multiple comparisons at an alpha level of 0.05 using the LSMEANS statement and specifying TUKEY for the adjust option.
Results
Changes in BW, DG, and ME intake
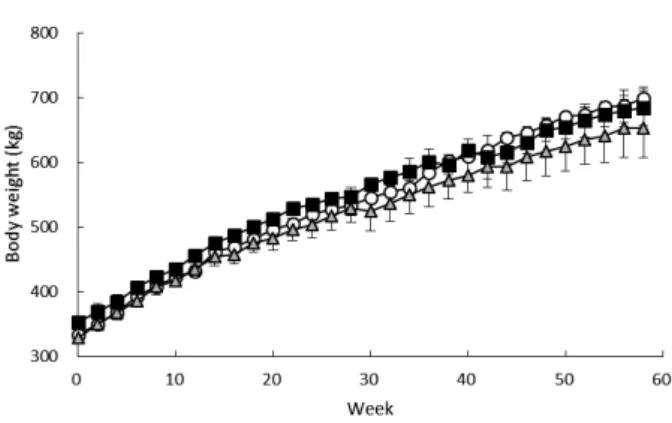
Figure 1 shows BW changes throughout the experimental period. The mean BW increased during the 58 weeks from 332.3 kg to 698.8 kg in group S, from 352.4 kg to 684.1 kg in group R, and from 328.0 kg to 653.2 kg in group RS. Stage and interaction had significant effects on the least-squares mean for DG (Table 2). Figure 2 shows the changes in DG during the experimental period. As planned, Group S gained approximately 1 kg/day in stages 1 and 2 and approximately 0.7 kg/day in stage 3. Groups R and RS, however, had lower DG values in stages 2 and 3 than in stage 1. Group S exhibited a significant difference in DG between stages 1 and 3, and between stages 2 and 3. Groups R and RS exhibited a significant difference in DG between stages 1 and 2 and between stages 1 and 3. In stage 2, groups R and RS had significantly lower DG values than group S; however, all groups had similar DG values in stage 3.
Stage and interaction had significant effects on
Fig. 1. Changes in mean BW during experiment in VA- supplemented and -restricted steers.
Open circles: group S. Closed squares: group R. Gray triangles: group RS.
ME intake (Table 2). Figure 3 shows changes in the mean ME intake. Group S had similar ME intakes in all stages.
Group R had lower intakes in stages 2 and 3 than in stage 1, and ME intake was significantly different between all stages. Group RS had a significantly lower ME intake in stage 2 than in stages 1 and 3, and the ME intake in stage 3 was similar to that in stage 1. In stage 2, groups R and RS had lower ME intakes than group S, but the differences between the VA treatment groups were not significant.
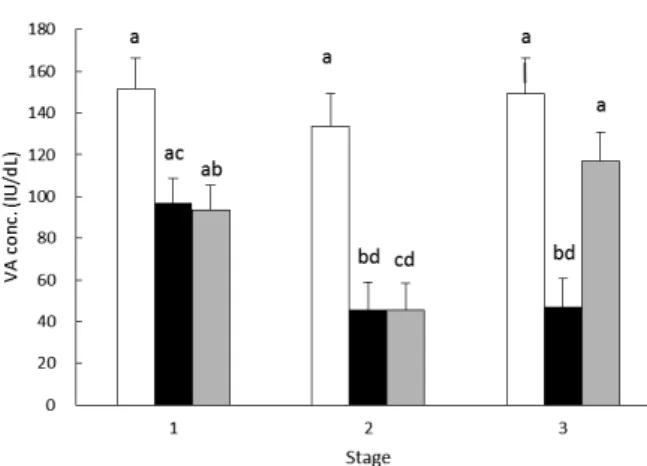
Plasma VA concentration
The VA treatment, stage, and interaction significantly affected the VA concentrations of each fattening
stage (Table 2). Figure 4 shows changes in the mean plasma VA concentrations. Group S had concentrations exceeding 80 IU/dL in all stages. Group R had significantly lower concentrations in stages 2 and 3 than in stage 1. Group RS had significantly lower concentrations in stage 2 than in stages 1 and 3. In stage 2, groups R and RS had significantly lower concentrations than those in group S. In stage 3, group R had significantly lower concentrations than those in groups S and RS.
Plasma ghrelin concentrations
The VA treatment and interaction had significant effects on plasma ghrelin concentrations, whereas there
Treatment 1 Stage 2 P-value
Item Group S Group R Group RS 1 2 3 Treatment Stage Interaction
DG (kg/day) 0.88±0.08 0.69±0.07 0.75±0.07 1.01±0.05a 0.71±0.05b 0.61±0.05b 0.31 <.001 0.008 ME intake (MJ/day) 102.6±2.8 96.5±2.3 96.6±2.3 104.7±1.6a 92.3±1.6c 98.7±1.6b 0.26 <.001 0.015 Vitamin A (IU/dL) 144.8±13.7a 63.3±11.2b 85.4±11.2b 114.1±7.4a 74.9±8.1b 104.5±8.6a 0.013 <.001 <.001 Ghrelin (pg/mL) 106.5±7.1a 63.3±5.9b 70.6±5.8b 78.7±4.6 71.0±6.4 90.7±7.2 <.001 0.12 0.003 Insulin (μU/mL) 27.0±5.2 22.0±4.2 24.3±4.2 17.0±2.8b 29.4±3.3a 26.9±3.6a 0.77 <.001 0.64 Glucose (mg/dL) 58.0±1.3 55.5±1.1 57.5±1.1 60.0±0.8a 55.1±1.0b 56.0±1.1b 0.34 <.001 0.16 Leptin (ng/mL HE) 8.6±1.3 8.1±1.1 7.3±1.1 6.5±0.7b 8.5±0.7a 8.9±0.8a 0.75 <.001 0.41
a-c Means with different superscripts differ between treatments or stages (P < 0.05).
1 Treatments: R group = Vitamin A feeding restricted; S group = Vitamin A supplemented; RS group = Vitamin A feeding restricted during stages 1 and 2 and supplemented during stage 3
2 Stage: 1 = from week 1 to 28; 2 = from week 29 to 44; 3 = from week 45 to 58 DG: Daily gain
ME: Metabolizable energy HE: Human equivalent
Table 2. Least squares means with standard errors and P values in the model for DG, ME intake, plasma vitamin A, glucose and hormone concentrations in VA-supplemented and –restricted steers.
Fig. 2. DG values of each stages in VA-supplemented and -restricted steers (least-squares mean ± SE).
Open columns: group S. Closed columns: group R.
Gray columns: group RS. a-e Means with different letters differ significantly (P < 0.05).
Fig. 3. ME intake of each stages in VA-supplemented and -restricted steers (least-squares mean ± SE).
Open columns: group S. Closed columns: group R.
Gray columns: group RS. a-f Means with different letters differ significantly (P < 0.05).
was no significant effect of stage (Table 2). Figure 5 shows changes in the mean ghrelin concentrations. Group R had lower concentrations in stages 2 and 3 than in stage 1, but these differences were not significant. Group RS had a lower concentration in stage 2 than in stages 1 and 3, and ghrelin concentrations were significantly different between stages 2 and 3. In stage 2, groups R and RS had significantly lower concentrations than those in group S. In stage 3, group R had lower concentrations than those in groups S and RS, and groups R and S showed difference trend (P = 0.053).
Plasma insulin, glucose, and leptin concentrations Stage had significant effects on the plasma insulin, glucose, and leptin concentrations, but there were no significant effects of the VA treatment or interaction (Table 2). The insulin and leptin concentrations were significantly higher in stages 2 and 3 than in stage 1. The glucose concentrations were significantly higher in stage 1 than in stages 2 and 3.
Discussion
In this study, the increases in BW reflected the normal growth of steers. The VA treatments affected both the plasma VA and ghrelin concentrations. The changes in these concentrations were similar in three respects.
First, in group RS, the concentrations of both factors were lower in stage 2 than in stages 1 and 3. In this group, the higher concentrations in stage 3 than in stage 2 suggested that, for these factors, the effect of VA feeding status was greater than the effect of feed composition. Second, in stage 2, the plasma VA and ghrelin concentrations were both lower in groups R and RS than in group S. Finally, in stage 3, the concentrations of both factors were lower in group R than in groups S and RS. Whereas, intravenous short chain fatty acid injection decrease blood ghrelin concentration in wethers 4). In our study, VA restriction affected the value of ME intakes (Figure 3). It suggests that VA restriction caused the difference in the feed intake, altered the rumen fermentation and short chain fatty acid production, and consequently, decreased the blood ghrelin concentration. However, rumen total short chain fatty acid concentration did not differ between the high concentration and high roughage diet in Holstein steers 18). In our study, differences in feed intake between the high concentration and high roughage diet were not extreme. It suggests that difference in rumen fermentation was not large between the experimental groups before feeding. Blood short chain fatty acids are considered as transited from rumen. Thus we presume that VA restriction does not largely alter the blood short chain fatty acid concentration before feeding, and that the blood short chain fatty acid did not largely affect the blood ghrelin concentrations. We therefore conclude that in this experiment, VA restriction decreased the ghrelin concentrations in steers and that VA supplementation to VA-restricted steers increased the ghrelin concentrations.
Fig. 4. Changes in VA concentrations in VA-supplemented and -restricted steers during experiment (least-squares mean ± SE).
Open columns: group S. Closed columns: group R.
Gray columns: group RS. a-d Means with different letters differ significantly (P < 0.05).
Fig. 5. Changes in plasma ghrelin concentrations in VA- supplemented and -restricted steers during experiment (least-squares mean ± SE).
Open columns: group S. Closed columns: group R.
Gray columns: group RS. a-e Means with different letters differ significantly (P < 0.05).
This is the first report to show a decrease in plasma ghrelin concentrations in VA-restricted animals. Our results demonstrate a possible relationship between VA restriction and plasma ghrelin concentrations in cattle. Several factors affect the plasma ghrelin concentrations in cattle, including feed restriction 2), negative energy balance 30), and intravenous glucose administration 22). However, those factors cannot explain our observed changes in ghrelin concentration following VA restriction. Therefore, other factors, which have not been considered to be related with ghrelin, might be involved. One possible mechanism is the involvement of the nuclear ligand function of VA. VA restriction might reduce ghrelin mRNA expression because VA acts as a nuclear ligand 23) and can regulate mRNA expression of several genes. However, ghrelin is not known as target of nuclear receptors involved in VA. Further studies are required to understand the mechanism that underlies this VA restriction-mediated effect on ghrelin.
In contrast, VA restriction did not affect plasma concentrations of leptin, insulin, or glucose. This result agrees with those from the previous studies 10,14,28,29), indicating that VA restriction, the degree of which did not cause VA deficiency, probably did not reduce the plasma concentrations of these factors in steers. VA restriction was also found to influence ME intake. Groups R and RS exhibited lower ME intakes during VA-restricted stages.
A decrease in feed intake is considered as a sign of VA deficiency in cattle 1,17). VA supplementation increased the dry matter intake in a dose-dependent manner in bulls that were fed a low-β-carotene diet 32). Moreover, Japanese Black steers exhibited greatly reduced feed intake at serum retinol, which is the main circulating type of VA, concentrations below 20 IU/dL 10). Our results are consistent with these findings. However, the underlying mechanisms remain unknown. In the present study, similar changes were observed in ghrelin concentrations and ME intakes. In particular, group RS had both lower ghrelin concentrations and lower ME intakes during the VA- restricted stage 2 than during the VA-supplemented stage 3. This similarity suggests an association between plasma ghrelin concentrations and feed intake in VA-restricted steers. Ghrelin is considered to be an appetite stimulator in rodents and humans. In cattle, ghrelin administration stimulates eating behavior 31). Sheep, which are fed multiple times a day, exhibit a peak serum ghrelin concentration
before feeding, which quickly decreases after feeding 26,27). Moreover, feed-restricted cattle have higher ghrelin concentrations 30). These results also suggest an association between eating behaviors and ghrelin concentrations in ruminants. However, VA-restricted cattle exhibit various symptoms 17), suggesting that VA restriction induces several physiological responses. Further studies are required to determine the mechanistic relationship between the feed intake and VA restriction status.
In conclusion, the present study showed that long-term VA-restricted feeding decreased the plasma VA and acylated ghrelin concentrations as well as ME intake in Japanese Black steers. Providing VA supplementation to VA-restricted steers increased the concentrations of both plasma VA and acylated ghrelin as well as ME intake. However, VA restriction did not affect the plasma concentrations of insulin, glucose, or leptin. Decreased plasma ghrelin concentration may reduce the feed intake in VA-restricted cattle.
Acknowledgments
This study was supported in part by research grants for meat and meat products from the Ito Foundation.
We are grateful for expert technical support during the animal experiments from the Technical Support Section 1 (NARO Institute of Livestock and Grassland Science).
References
1) Agriculture, Forestry and Fisheries Research Council Secretariat (2000). Japanese feeding standards for beef cattle, Japan Livestock Industry Association, Tokyo, Japan.
2) Bradford, B. J. and Allen, M. S. (2008). Negative energy balance increases periprandial ghrelin and growth hormone concentrations in lactating dairy cows, Domestic Animal Endocrinology, 34, 196–203.
3) Chaney, S. G. (2002). Principles of Nutrition II:
Micronutrients, in Textbook of Biochemistry With Clinical Correlations, 1137–1168, Wiley-Liss, New York, USA
4) Fukumori, R., Sugino, T., Hasegawa, Y., Kojima, M., Kangawa, K., Obitsu, T., and Taniguchi, T. (2011).
Plasma ghrelin concentration is decreased by short
chain fatty acids in wethers, Domestic Animal Endocrinology, 41, 50–55.
5) Furr, H. C., Cooper, D. A. and Olson, J. A. (1986).
Separation of retinyl esters by nonaqueous reversed- phase high-performance liquid-chromatography, Journal of Chromatography, 378, 45–53.
6) Gorocica-Buenfil, M. A., Fluharty, F. L., Bohn, T., Schwartz, S. J. and Loerch, S. C. (2007). Effect of low vitamin A diets with high-moisture or dry corn on marbling and adipose tissue fatty acid composition of beef steers, Journal of Animal Science, 85, 3355–3366.
7) Gorocica-Buenfil, M. A., Fluharty, F. L., Reynolds, C.
K. and Loerch, S. C. (2007). Effect of dietary vitamin A concentration and roasted soybean inclusion on marbling, adipose cellularity, and fatty acid composition of beef, Journal of Animal Science, 85, 2230–2242.
8) Guilbert, H. R. and Hart, G. H. (1934). Storage of vitamin A in cattle, Journal of Nutrition, 8, 25–44.
9) Hayashida, T., Murakami, K., Mogi, K., Nishihara, M., Nakazato, M., Mondal, M. S., Horii, Y., Kojima, M., Kangawa, K. and Murakami, N. (2001). Ghrelin in domestic animals: distribution in stomach and its possible role, Domestic Animal Endocrinology, 21, 17–24.
10) Hodate, K., Miyashige, T., Higashiyama, Y., Taniguchi, T., Miyazaki, S. and Miyamoto, T. (2004). Relationship between Intermuscular Edema and Hypoalbuminemia in Vitamin-A-deficient Steers, Journal of the Japan Veterinary Medical Association, 57, 371–376.
11) Japan Meat Grading Association (1988). New Beef Carcass Grading Standards, Tokyo, Japan.
12) Kojima, M., Hosoda, H., Date, Y., Nakazato, M., Matsuo, H. and Kangawa, K. (1999). Ghrelin is a growth-hormone-releasing acylated peptide from stomach, Nature, 402, 656–660.
13) Malau-Aduli, A. E. O., Edriss, B. D., Siebert, B. D., Bottema, C. D. K. and Pitchford, W. S. (1999). Breed differences and genetic parameters for melting point, marbling score and fatty acid composition of lot- fed cattle, Journal of Animal Physiology and Animal Nutrition, 83, 95–105.
14) Matsuzaki, M., Hara, S., Ogawa, M., Shiba, N. and Tsuneisi, E. (1998). Effects of vitamins A, D3 and E on growth performance and carcass characteristics, and on lipolytic responsiveness and insulin secretion in
Japanese Black steers, Animal Science and Technology, 69, 741–753.
15) Nakazato, M., Murakami, N., Date, Y., Kojima, M., Matsuo, H., Kangawa, K. and Matsukura, S. (2001).
A role for ghrelin in the central regulation of feeding, Nature, 409, 194–198.
16) National Agricultural Research Organization (2001).
Standard Tables of Feed Composition in Japan, Japan Livestock Industry Association, Tokyo, Japan.
17) National Research Council (1996). Vitamins and Water, in Nutrient requirement of beef cattle, 75–84, National Academy Press, Washington, D.C.
18) Obara, Y., Kakino, J. and Motoi, Y. (1994). Changes in Acid-base Status of Holstein Steers Fed High Raughage or High Concentration Diet, Animal Science and Technology (Japan), 65, 347–354.
19) Oka, A., Maruo, Y., Miki, T., Yamasaki, T. and Saito, T.
(1998). Influence of vitamin A on the quality of beef from the Tajima strain of Japanese Black cattle, Meat Science, 48, 159–167.
20) Okamoto, K., Kuchida, K., Kato, T., Suzuki, M. and Miyoshi, S. (2003). Influence of Image Analysis and Carcass Traits on Beef Carcass Price, Nihon Chikusan Gakkaiho, 74, 475–482.
21) Okumura, T., Saito, K., Sakuma, H., Nade, T., Nakayama, S., Fujita, K. and Kawamura, T. (2007).
Intramuscular fat deposition in principal muscles from twenty-four to thirty months of age using identical twins of Japanese Black steers, Journal of Animal Science, 85, 1902–1907.
22) Roche, J. R., Sheahan, A. J., Chagas, L. M. and Boston, R. C. (2008). Short communication: change in plasma ghrelin in dairy cows following an intravenous glucose challenge, Journal of Dairy Science, 91, 1005–1010.
23) Samarut, E. and Rochette-Egly, C. (2012). Nuclear retinoic acid receptors: conductors of the retinoic acid symphony during development, Molecular and Cellular Endocrinology, 348, 348–360.
24) Siebert, B. D., Kruk, Z. A., Davis, J., Pitchford, W. S., Harper, G. S. and Bottema, C. D. K. (2006). Effect of low vitamin A status on fat deposition and fatty acid desaturation in beef cattle, Lipids, 41, 365–370.
25) Steen, R. W. J. and Kilpatrick, D. J. (1995). Effects of plane of nutrition and slaughter weight on the carcass composition of serially slaughtered bulls, steers and