九州大学学術情報リポジトリ
Kyushu University Institutional Repository
大強度ミューオンビームラインのための超伝導磁石 の熱特性に対する放射線の影響に関する研究
楊, 叶
https://doi.org/10.15017/1931899
出版情報:Kyushu University, 2017, 博士(工学), 課程博士 バージョン:
権利関係:
Ye Yang January 2018
Department of Applied Quantum Physics and Nuclear Engineering, Graduate School of Engineering,
Kyushu University
by Ye Yang
A dissertation submitted in partial satisfaction of the requirements for the degree of
Doctor of Philosophy in
Engineering in the
Department of Applied Quantum Physics and Nuclear Engineering, Kyushu University
January 2018
: Assoc. Prof. K. Kajikawa Kyushu University Supervisor : Assoc. Prof. K. Maehata Kyushu University : Assistant Prof. N. Shigyo Kyushu University Co-supervisor : Assoc. Prof. M. Yoshida KEK
: Assoc. Prof. M. Iio KEK
: Prof. T. Ogitsu KEK
This research was carried out from April 2015 until March 2018 at:
Cryogenics Science Center, Applied Research Laboratory,
High Energy Accelerator Research Organization (KEK), Tsukuba, Japan.
Study of Radiation Influence on Thermal Characteristics of Superconducting Magnets for High Intense Muon Beam Line
Ye Yang PhD thesis
Department of Applied Quantum Physics and Nuclear Engineering, Graduate School of Engineering, Kyushu University
744 Motooka, Nishi-ku, Fukuoka, 819-0395, Japan Copyright c 2018 Ye Yang
Abstract
Recently, a superconducting magnet that can be operated under a high radiation environment is required for high intense beam lines and accelerators. A conduction-cooled superconducting magnet system, where the aluminum-stabilized NbTi superconducting coil is conductively cooled by using pure aluminum strips as a thermal path, is desirable to minimize tritium production in helium loop and energy deposition due to the radiation by reducing the cold mass of the magnet. A Pion Capture Solenoid (PCS) for the COherent Muon to Electron Transition (COMET) muon beam line, which will be the conduction- cooled superconducting magnet in high radiation environment is now under construction at J-PARC. The superconducting coil will be exposed by neutron flux of 1014 n/m2/sec with a peak dose of 1 MGy and a total energy deposition in magnets will be more than 200 W, which indicates that the temperature distribution in the conduction-cooled coil is determined not only by the thermal design using pure aluminum strips but also by the energy deposition distribution due to the radiation. In addition, it is well known that thermal and electrical conductivities of aluminum used as a stabilizer and a cooling path in the coil can be degraded by neutrons at low temperature below 10 K. For this reason, it is seriously concerned that the coil temperature will be increased as the beam operation and that the quench protection scheme will be compromised. In consequence, the magnet system would have to be warmed up to room temperature so that thermal and electrical conductivities of aluminum can be fully recovered by the anneal effect.
In this thesis, feasibility study on the stable operation of the conduction-cooled superconducting magnet for high intense muon beam line (COMET-PCS) regarding the coil temperature and the quench protection is performed by using a novel design method with a consideration of energy deposition in the magnet and degradation of the material properties due to the radiation.
i
This thesis is dedicated to the memory of grandfather, Honglin Yang.
Contents
Contents ii
List of Figures iv
List of Tables xii
List of Symbols xiv
1 Introduction 1
1.1 Issue for Pion Production System . . . 2
1.2 Irradiation Influence on Superconducting Magnet . . . 4
1.3 Overview of the COMET Superconducting Magnets . . . 6
1.4 Pion Capture Solenoid . . . 8
1.5 Cryogenic System . . . 11
1.6 Overview of Thesis . . . 12
2 Radiation Estimation for Pion Capture Solenoid 15 2.1 Simulation . . . 15
2.2 Result . . . 19
2.3 Discussion . . . 23
2.4 Summary . . . 26
3 Thermal Stability during the Beam Operation 27 3.1 Temperature Limitation for Superconducting Magnets . . . 27
3.2 Simulation . . . 28
3.3 Results . . . 51
3.4 Discussion . . . 58
3.5 Summary . . . 63
4 Measurement of Insulation Thermal Conductivity with Irradiation 64 4.1 Method . . . 64
4.2 Sample Fabrication . . . 65
4.3 Experiment . . . 67
4.4 Data Analysis . . . 71
4.5 Results . . . 77
4.6 Summary . . . 79
5 Quench Protection for Superconducting Magnets 80
5.1 Quench Protection Design . . . 80
5.2 Simulation . . . 82
5.3 Result . . . 89
5.4 Discussion . . . 101
5.5 Summary . . . 103
6 Prospect for Future Muon Beam Line 105 6.1 Conceptual Design . . . 105
6.2 Thermal Characteristics . . . 107
6.3 Discussion . . . 111
6.4 Summary . . . 112
7 Conclusion 113 Appendices 115 Appendices 115 A Numerical Treatments 116 A.1 Runge-Kutta Method . . . 116
A.2 Root Finding Method . . . 117
A.3 Multi-dimensional Interpolation . . . 118
B Critical Current of ReBCO coated HTS Tape 120 C Quench Simulation for ATLAS Central Solenoid 122 C.1 Simulation Model . . . 122
C.2 Result . . . 123
C.3 Conclusion . . . 125
D Studies on Mineral Insulated HTS Tape 127 D.1 Investigation of the Heat Treatment . . . 127
D.2 Electrical Characteristics of the Ceramic-coated HTS Tape . . . 129
D.3 Discussion . . . 132
D.4 Conclusion . . . 132
E Quench Detection Study for HTS Coil 133 E.1 Quench Detection . . . 133
Bibliography 137
List of Figures
1.1 Layout of the Muon Science Facility (MUSE) in the Material and Life Science Facility (MLF) experimental hall at J-PARC (copyright: ELSEVIER [9]). . . 2 1.2 The conduction-cooled superconducting magnet operated in a high radiation
environment. . . 3 1.3 Schematic layout of the muon beam line and detector in the COMET experi-
ment (Copyright: the COMET collaboration [16]). . . 7 1.4 Configuration of the pion capture solenoid magnet system (copyright: IEEE [30]). 8 1.5 Overview of the coil structure for pion capture solenoid. . . 10 1.6 Quench protection circuit for Pion Capture Solenoid magnet system. . . 11 1.7 Configuration of cryogenic system for the PCS and MTS (copyright: ELSE-
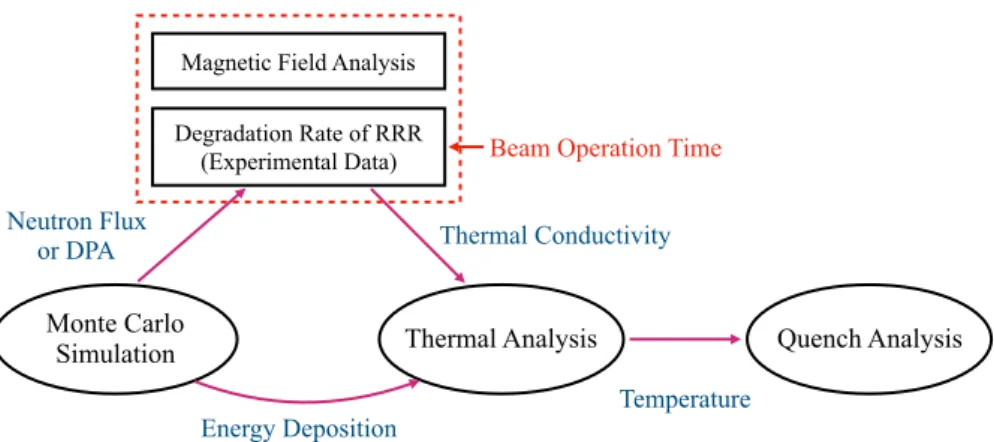
VIER [31]). . . 12 1.8 The schematic flow diagram of a novel method with the consideration of
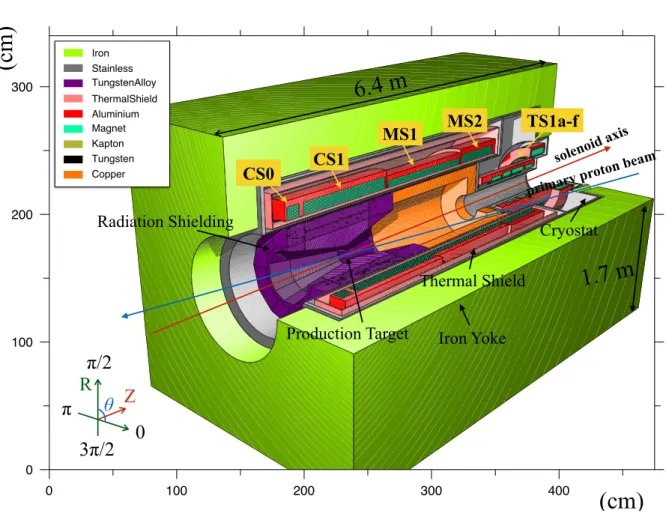
radiation influence. The conventional thermal design follows the black flows, and the red flows shows the novel method to take the radiation effects into account in this study. . . 13 2.1 The geometry of Pion Capture Solenoid System implemented in PHITS sim-
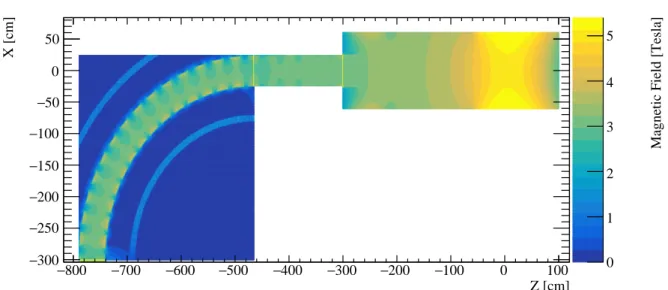
ulation. The production target is set in the center of the radiation shielding which has 10 degree with solenoid axis. Blue and Red arrow indicate the axis of the primary proton beam and solenoid (copyright: IEEE [37]). . . 17 2.2 Magnetic field map implemented to transport the secondary particles in PHITS
simulation. . . 18 2.3 The negative-pion (upper) and negative-muon (lower) transported in the
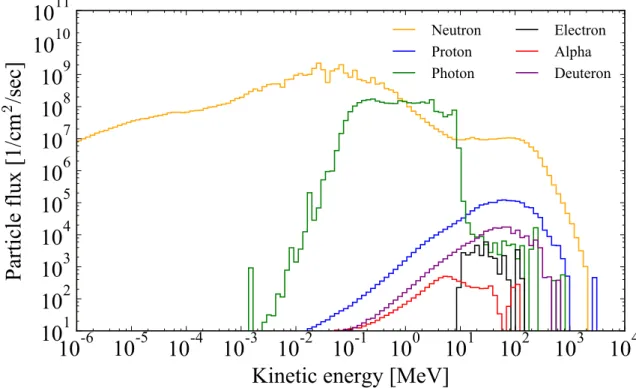
magnetic field in PHITS simulation. The magnetic field applied on target is 5 Tesla, and the magnetic field from TS1a to end of TS2 coils is about 3 Tesla as given in Fig. 2.2. . . 19 2.4 Predicted particle flux hit the innermost layer of CS1 coil. Orange (Green,
Blue, Black, Red and Purple) line indicates the flux of neutron (photon, proton, electron, alpha particle and deuteron). . . 20
2.5 The reaction process contributed to the energy deposition of the superconduct- ing coil (left), and the contributions of each particle contributed to the energy deposition from the ionization (right), where the recoil, ionization, photon and others are the energy deposition from the recoil nuclei (deuteron, tritium, 3He, alpha and residual nuclei), the energy loss of charged particles, photon and the remaining excitation energy, respectively. The energy deposition is scored at the innermost layer of CS1 coil. . . 21 2.6 The 3D distribution of the predicted neutron flux and energy deposition in
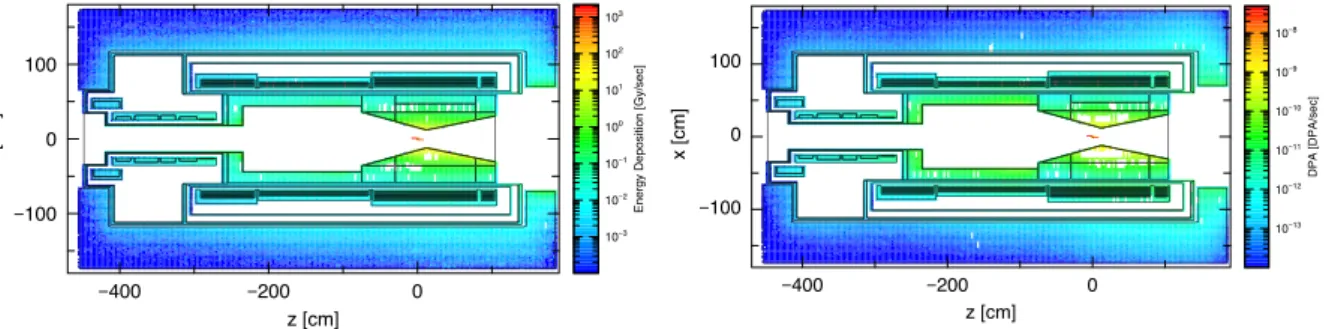
CS1 coil. The peak of radiation is located at the angle of 135◦ - 225◦ since the primary proton beam is injected in the magnet with the tilting angle of 10◦ with respect to the magnet axis. The center of target is located at Z = 0 cm, and the center of CS1 coil is at the position of Z = 10 cm. . . 22 2.7 Distribution of energy deposition (left) and DPA rate (right) in PCS from a
view ofz-x plane. . . 23 2.8 Comparison of the Monte Carlo calculation to the measurement data (right)
with a simulation model shown on left. Three points of energy deposition are measured by shifting the target along the z-axis with±80 mm. . . 25 3.1 Current sharing in the aluminum-stabilized conductor (Al:Cu:NbTi = 7.3:0.9:1)
calculated with the parameters: n = 40, Ec = 1µV/cm, Iop = 2700 A, and B
= 5.4 Tesla. Blue line is the critical current, and black (red, green) line is the current shared in NbTi (aluminum, copper). . . 28 3.2 Overview of the method to take the irradiation effects into account in thermal
analysis. . . 29 3.3 Cross sectional view of the CS1 coil in thermal simulation. Red, green and blue
domain indicate the aluminum strip, conductor and support shell, respectively (copyright: IEEE [37]). . . 31 3.4 RRR correlated with the neutron flux (left) and DPA (right) for aluminum,
where RRR0 is the initial RRR before the degradation. The degradation rate of 0.03 nΩ·m per 1020 n/m2 (En >0.1 MeV) measured by M. Yoshida et al.
and 6.8×10⁻⁴ Ω·cm measured by J. Horaket al. are used here. Red and green line indicate the aluminum with the initial RRRs of 400 and 2000 used as stabilizer and thermal path in PCS, respectively. . . 32 3.5 The meshed element of (i, j, k) at position of (z, θ,r) with the dimension of
dz × rdθ × dr (Left) and the connected thermal network from the view of θ axis (Right). . . 33 3.6 Extended each turn at kth layer. At the boundary ofθ axis, each element is
connected with the virtual element thermally. Exchanging the temperature at next turn with virtual element, the heat transfer along the winding direction has been implemented. . . 37 3.7 The alignment of the aluminum strips between the coil layer with a cross-
sectional view (left) and three-dimensional view (right). . . 37 3.8 The coil magnetic field for each coil (CS, MS and TS1a-f) in the PCS. The
upper and lower limits in the color bar indicate the maximum and minimum magnetic field in each coil. . . 39
reference data and fit function. The fit function is normalized with the critical current of 14.1 kA at 5 Tesla and 4.2 K. . . 41 3.10 Function of electrical resistivity for copper with applied magnetic field from 0
to 6 Tesla and RRR of 50 (left) and 100 (right). . . 42 3.11 Kohler plot for aluminum magnetoresistivity. The green, red and blue data
are referred from the Ref. [47], [63] and [52], respectively. The data is fitted with a fit function as given in equation (3.28). . . 43 3.12 Electrical resistivity at RRR = 172 (left) and 1530 (right) for aluminum. The
reference data is given in the magnetic field of 4 (t), 3 (s), 2 (n), 1 (l), 0.5 (o) and 0 Tesla (m). . . 44 3.13 Thermal conductivity of copper for RRR = 50 (left) and RRR = 100 (right) [53]. 46 3.14 Comparison of the thermal conductivity of aluminum to reference data for
RRR = 172 (left) and RRR = 1530 (right). . . 47 3.15 Thermal conductivity of aluminum A5083 (black), polyimide (green), NbTi
(golden), epoxy resin (red) and GFRP-G10 (blue). . . 48 3.16 Specific heat of NbTi in various of magnetic field around the critical temperature. 49 3.17 Specific heat curves of aluminum (black), copper (red), polyimide (orange),
GFRP-G10 (blue) and NbTi at 5.4 Tesla (green). . . 50 3.18 The temperature distribution for the CS and MS coils in aZ-R view at the 90
day beam operation, in which the temperature distribution at the angle from 135◦ to 225◦ corresponding to the peak of temperature along the azimuth is plotted here. . . 51 3.19 Maximum temperature for each coil after the varied beam operation time.
Black (blue, green and red) line indicates the maximum temperature rises as a function of beam operation duration for CS0 (CS1, MS1 and MS2) (copyright:
IEEE [37]). . . 52 3.20 The change of peak temperature against the beam operation time with the
assumed thermal conductivity of insulation (left) and the thickness of turn-to- turn insulation (right). . . 53 3.21 Temperature distribution in the CS1 coil simulated with different boundary
conditions by assuming a beam operation time is 90 days. Left: the boundary of element at edge of shell are fixed to 4.5 K. Right: an additional element at center of shell is fixed to 4.5 K. . . 54 3.22 Comparison of the peak temperature in CS1 coil estimated with a safety factor
multiplied on the term of damage rate (left) and heat generation (right). . . 55 3.23 The peak temperature in each coil when the coil layers are filled with the
aluminum strips. Black (blue, green and red) line is the peak temperature in CS0 (CS1, MS1 and MS2) coil. . . 56 3.24 The temperature distribution in CS1 at 90-day beam operation coil with four
configurations of extraction of aluminum strips, A (upper left), B (upper right), C (down left) and D (down right). The maximum temperature for each configuration is 7.1, 6.9, 6.9 and 6.1 K (A, B, C and D). . . 57
3.25 The temperature distribution in CS1 coil at 90-day beam operation for the cases with a 1 mm thick (left) and 3 mm (right) aluminum strip attached to the innermost layer of coil. . . 57 3.26 Effect of the thickness of innermost layer aluminum strip (left) and the alu-
minum strip filled along the azimuth. . . 58 3.27 The thermal diffusivity for aluminum, copper, NbTi and Kapton tape at
5.4 Tesla. RRR of aluminum and copper are 400 and 50, respectively. . . 59 3.28 The time structure of energy deposition in one bunch hit (left) and enthalpy of
Rutherford cable and aluminum-stabilized conductor (right). Left: red line is the integrated energy deposition and black line is the energy deposition with the time bin of 5 µsec. Right: blue line is the enthalpy of conductor averaged from aluminum, copper and NbTi with a ratio of 7.3:0.9:1, and green line is the enthalpy of Rutherford cable averaged from copper and NbTi with a ratio of 0.9:1. . . 61 3.29 Calculated the temperature distribution in thermal shield by assuming the
thermal radiation and nuclear heating are 3 W/m2 and 108 W/m3, respectively. 63 4.1 Configuration of insulation in each coil of the Pion Capture Solenoid system.
The BT-based insulation is employed as the turn-to-turn (between conductor and conductor) and ground insulation (between conductor and thermal path). 65 4.2 The procedure of the test sample fabrication. Firstly, the 4-layer stack of
insulation tapes are sandwiched with two aluminum bars, secondly the test sample is fixed with a dedicated sample jig to ensure the uniform compressing on insulation tapes. Then, the test sample with the sample jig is cured at 170◦C for 7 hours so that the insulation tapes can be adhered with the aluminum bars after the heat treatment. . . 66 4.3 Schematic drawings of the experimental setup for the thermal conductivity
measurement (left). The test sample are setup on the sample stage (right).
(copyright: ELSEVIER [81]) . . . 67 4.4 Development of measurement system with cryocooler. Left: The wires used
in measurement are fixed on the sample and 2nd stage with aluminum tape, and well-wound on the cylinder to avoid the heat inleak from the conduction through wires. Right: Both 4 K and 40 K are covered with the SI to reduce the thermal radiation. The bolt joints in the 40 K shield are filled with the cryogenic grease to enhance the thermal contact. . . 68 4.5 Sample setup for the irradiation. The test sample is set far from the irradiation
source and irradiated at vacuum. . . 70 4.6 Experimental setup for the reference measurement. An I-shaped SUS304
sample is bolted on the sample holder. The temperature difference between two temperature sensors is measured by adjusting the heater power. . . 71 4.7 Comparison of the measured thermal conductivity of SUS304 with database.
The green line and its yellow band indicate the data and its error provided from NIST material database [83]. The dot with error bar is the measured data with the estimated uncertainty. (copyright: ELSEVIER [81]) . . . 72
upper (lower) side of sample, and black curve shows the measured heater power. 73 4.9 Histograms of temperature difference (left) and heater power (right) distribu-
tions in a selected time range from 2680 sec until 3420 sec when the current of 4 mA is fed. (copyright: ELSEVIER [81]) . . . 73 4.10 The temperature difference data as a function of heater power. Each dot
indicates measured data with the error bars including both statistical and systematic uncertainties except for geometrical uncertainty of the sample. Red line is obtained by linear fit of the measured dataset, and the band represents the propagated error on the fitted line. (copyright: ELSEVIER [81]) . . . 74 4.11 Thermal conductivity of the aluminum in the test sample. Red dots with
error bars indicate the measured thermal conductivity with the estimated uncertainties including the systematics. Black solid line is obtained by fitting the data with Hust’s equations [61] and green band is its fitting error. (copyright:
ELSEVIER [81]) . . . 75 4.12 The possible Kapitza resistance (blue) and thermal resistance (green) of prepreg
tape separated with a fit method for each sample before and after the irradiation.
The red line is the total thermal resistance, the marker with error is the thermal resistance measured in this experiment, and the band is the error from the fit process. . . 76 4.13 The measured thermal conductance of the BT prepreg test samples. Red
(Green) dots indicate measured data of each sample before (after) irradiation.
The total dose in Sample A, B and C are 1 MGy, 5 MGy and 0.2 MGy, respectively. The geometrical uncertainties are not taken into account here to investigate the irradiation influence in each sample. (copyright: ELSEVIER [81]) 78 4.14 The ratio of the thermal conductivity data before and after the irradiation at
5.2±0.2 K. . . 78 5.1 The estimated maximum temperature from adiabatic model. MIITs calculated
from the temperature term is shown on Left with various magnetic field. With the consideration of degradation of RRR, the extracted maximum temperature is plotted on Right. . . 82 5.2 Overview of the program flow of quench simulation. The main flow of simulation
is shown on left, and the right one is the flow of calculation of joule heating. 83 5.3 The equivalent circuit at the superconducting transition state (left) and normal
conducting state (right). . . 84 5.4 Current diffusion in Al-stabilized conductor. The current diffusion region with
the width of dAl starts from the region of Rutherford cable lsc×wsc until fill of the entire stabilizer l×w. . . 87 5.5 Estimated total inductance in CS0 (upper left), CS1 (upper right), MS1 (lower
left) and MS2 (lower right). . . 89 5.6 The quench characteristics during the current discharge for the CS0 (blue),
CS1 (red), MS1 (green), MS2 (black) and TS1a (orange) coil in the PCS. . . 90
5.7 The evolution of discharge (upper left), hot spot temperature (lower left), coil resistance (upper right) and voltage (lower right) with various resistance of dump resistor. Blue line indicates the by-pass resistor is not employed, and red (green, black) line shows the quench characteristics when the coil is protected
with a 0.1 (0.2, 0.3) Ω dump resistor. . . 91 5.8 Maximum temperature after quench when the hot spot is set in the different
place at CS1 coil. The symbol of×and the temperature indicate the maximum temperature after quench when the hot spot position is changed. . . 92 5.9 The flowing current in aluminum stabilizer (upper left), superconductor (up-
per right) and copper matrix (lower left), and temperature (lower right) at beginning of quench. The current in copper matrix decays due to the current redistribution in aluminum-stabilizer. . . 93 5.10 Effect of support shell on maximum temperature after quench for a single
layer coil, TS1a (left). The evolution of temperature in hot spot (red line) and center of support shell (green line) is plotted on right. . . 95 5.11 The evolution of the current, coil resistance, hot spot temperature, coil inductive
and resistive voltage in CS1 coil for various beam operation time. . . 95 5.12 The peak temperature after quench as a function of the elapsed time of beam
operation. . . 96 5.13 The quench characteristics for the cases with and without the aluminum strips
inserted between coil layer. . . 97 5.14 Comparison of the quench propagation for a coil with (left) and without (right)
aluminum inserted between each layer. All elements quenched at more than 20 sec for a case without aluminum strips, and about 7 sec for the case with inserted aluminum strips. . . 98 5.15 Comparison of the quench propagation when the hot spot is located in the
center (left) and inner layer (right) of coil for a coil only with a innermost aluminum strip. All elements quenched at about 10 sec for a case when the hot spot is far from the aluminum strips, and about 8 sec for the case when the hot spot is near to the aluminum strip. . . 99 5.16 A metallic strip model with a time-varying magnetic field perpendicular to
the x-y plane for the investigation of the effect of eddy current for quench propagation. . . 100 5.17 The heat generation from the eddy current effects (top) during the current
discharge (bottom) in the CS1 coil. . . 101 5.18 The estimated MPZ and normal zone propagation velocity at RRR = 400 in
various magnet field until 1 Tesla. . . 102 5.19 The calculated detection time (left) and MIITs estimated at B = 0.1 Tesla
(right) during the magnet charging. The voltage threshold is set to 0.1 V. . . 103 6.1 Schematic view of the compact pion capture solenoid made of the HTS based
double pancake coils. ab-axis: direction as same as the current flow, c-axis:
perpendicular to the surface of HTS tape. (copyright: IOP science [111]) . . 106
current density is calculated to 139 A/mm from the equation of J =nturn× nlayer×Iop/(t×l). The total magnetic field, that of r component and that of z component are shown on left, middle and right. . . 107 6.3 Critical current (B // c-axis) of ReBCO coated conductor (SuperPower,
SCS4050) with a operation point. . . 108 6.4 Estimated flux of each particle (right) with a simulation model of pion capture
solenoid (left). . . 109 6.5 Distribution of energy deposition in HTS coil in the unit of Gy/sec (=W/kg).
Horizontal axis indicates the axis of HTS solenoid, and vertical is the radius from the solenoid axis. (copyright: IOP science [111]) . . . 110 6.6 The simulation model for the thermal analysis. . . 111 6.7 Temperature distribution in the HTS coil during the beam operation, in which
the only temperature distribution of double pancake coil is plotted here. The coil is divided to 4 part along the azimuth, and the peak of temperature is located from 90 to 180 degree due to the axis asymmetry of energy deposition.
(copyright: IOP science [111]) . . . 111 A.1 Root finding with a Newton-Raphson method. . . 117 B.1 The measurement data of critical current (left) and n-value (right). The solid
line is the function fitted with the measurement data. . . 120 C.1 Cross-sectional view of the ATLAS central solenoid [120]. . . 123 C.2 Simulation result of the current decay and temperature rise after the quench.
The case I (II) indicates the model with (without) the consideration of current redistribution in aluminum-stabilizer. Dots are the experimental data given in Ref. [106], and curves are the prediction from the quench simulation. Red (Black) dots present the temperature (current). . . 124 C.3 The predicted evolution of temperature for aluminum strip (upper left), conduc-
tor (upper right) and lower left (lower left), and heat generation in conductor (lower right). . . 125 C.4 Predicted current decay and temperature rise at hot spot for a scan of magnetic
field (left) and various of insulation thermal conductivity (right). . . 126 D.1 The experimental setup for the critical current measurement at liquid nitrogen
temperature. . . 128 D.2 Measured temperature during the heat treatment. The temperature of blue
and red line are measured on test sample, and the one of green line is the temperature in the furnace. . . 129 D.3 The measured V-I characteristics of HTS tape before (left) and after (right)
the heat treatment at 180◦C with 30 h. . . 130 D.4 The degradation of critical current (left) and n-value after the heat treatment
of 180◦C (black) and 200◦C (red). . . 131
D.5 The ceramic-coated HTS tape with a coated length of 5 cm (upper) and a thickness of 0.04 mm on surface (lower left). A crack is observed with the optical microscopy (lower right). . . 131 E.1 The evolution of current sharing, coil voltage and hot spot temperature for a
operation current of 100 A (left) and 140 A (right). The green and red line indicate the current in the superconductor and copper respectively. The black and blue line are the hot spot temperature and coil resistive voltage. The red and blue axis shows a scale for current and voltage. . . 134 E.2 The resistive voltage (left) and the elapsed time after the quench detection
(right) as a function of peak hot spot temperature, in which tis the global time, and tdet is the time when the coil resistive voltage reaches to the threshold of 100 mV. The dashed line is the criteria of 0.1 sec. . . 135 E.3 R-θ view of the temperature distribution in double pancake at the operation
current of 100 A. The hot spot is located at the innermost layer of first single pancake coil (left). The right one shows the temperature in the second single pancake coil. The mesh of single pancake coil is cut to be 120 along the azimuth and 166 along the radius. . . 135
List of Tables
1.1 Comparison of pion capture solenoid system for current and future muon beam
line [15][16][17][18]. . . 4
1.2 Coil specification for the PCS. r0 and r1 are the inner and outer radius of coil. z0 and z1 are the position of coil end along the beam axis. Bz is the required magnetic field along the beam axis. . . 9
1.3 Design parameters of the aluminum-stabilized conductor for PCS . . . 11
2.1 The composition of tungsten alloy AN-1800. . . 16
2.2 The peak of neutron fluence, DPA and energy deposition within the statistical error for CS and MS coils estimated by PHITS simulation. . . 21
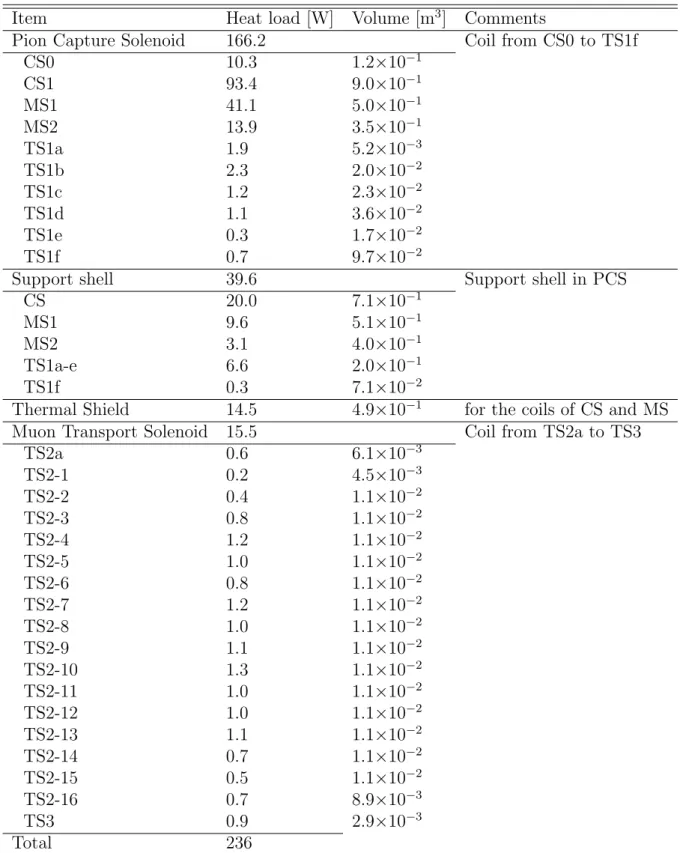
2.3 The predicted total nuclear heat load from the PHITS simulation. . . 24
2.4 The peak of neutron flux, DPA rate, dose rate and total nuclear heat load in each coil for the use of a production with a length of 320 mm and a radius of 3 mm. . . 26
3.1 The current sharing temperatureTcs, critical temperatureTcand critical current estimated with the maximum magnetic field Bmax and bath temperature of 4.5 K for each coil. It is noted that the operation currents for TS1b, TS1d, TS1e and TS1f are 2581 A, 2619 A, 2538 A and 2916 A, respectively. . . 29
3.2 Parameters used in the heat transfer simulation for the CS and MS coils. . . . 31
3.3 Estimated filling ratio of aluminum strip along the azimuth in a 9-layer coil (CS0, CS1). . . 38
3.4 Fit parameters for NbTi critical surface [55]. . . 40
3.5 Fit parameters of the electrical resistivity and magnetoresistivity for copper [53]. 42 3.6 Fit parameters for the electrical resistivity of aluminum. . . 43
3.7 Fit parameters of the electrical resistivity model for copper [53]. . . 45
3.8 Fit parameters for the thermal conductivity of aluminum [66]. . . 46
3.9 Fit parameters of thermal conductivity for aluminum A5083 [54]. . . 47
3.10 Fit parameters of thermal conductivity for NbTi [51]. . . 47
3.11 Fit parameters of thermal conductivity for GFRP-G10. The first and second raw indicate the normal and parallel direction [54]. . . 48
3.12 Fit parameters of thermal conductivity for polyimide (Kapton) [54]. . . 48
3.13 Fit parameters of the specific heat for copper [54]. . . 49
3.14 Fit parameters of the specific heat for aluminum [54]. . . 49
3.15 Fit parameters of the heat capacity for NbTi [53]. . . 50
3.16 Fit parameters for the heat capacity of polyimide (Kapton) [54]. . . 51 3.17 Fit parameters for the heat capacity of GFRP-G10 [54]. . . 51 3.18 Possible variation for the parameters in thermal analysis. . . 52 3.19 The damage rate measured with the neutron irradiation for aluminum in the
past. . . 54 4.1 The thermal conductivity of BT-prepreg insulation tape before and after
irradiation fitted by function: k(T) =p0Tp1 from 4.5 K to 20 K. The first and second item of parameter p0 indicate the systematic error of measurement and geometrical uncertainty. . . 79 5.1 The parameters used in the MIITs calculation to estimate the maximum
temperature after discharge. . . 82 5.2 Maximum temperature at hot spot and MIITs for each coil at non-irradiated
condition. . . 90 5.3 The assumed parameters and possible variation of each parameters in quench
analysis. . . 93 5.4 Impact of the conductor RRR on the maximum temperature after quench.
Rcoil indicates the reached coil resistance when the current is discharged until 0 A. . . 94 6.1 Design parameters for the HTS coil. . . 108 B.1 Fit parameters for ReBCO tape. . . 120 C.1 Parameters used in the quench simulation for the ATLAS central solenoid. . 124 D.1 The measured critical current and n-value before and after heat treatment. . 130
List of Symbols
T [K] Temperature
∆T [K] Temperature difference
Q [W] Heat load
q [W/m3] Volumetric heat
l [m] Length
A [m2] Cross-sectional area k [W·m−1·K−1] Thermal conductivity C [J·kg−1·K−1] Heat capacity
% [kg/m3] Mass density
ρ [Ω·m] Electrical resistivity R [Ω] Electrical resistance
L0 Lorentz number
µ0 [H/m] Vacuum permeability B [Tesla] Magnetic flux density
RRR Residual-resistance ratio
I [A] Current
M IIT s [MA2·sec] Time integration of the square of current A Vector potential of magnetic field
RRRef f Effective residual resistance ratio
η Degradation rate of electrical resistivity to radiation En [MeV] Energy of neutron
φ [n/m2/sec] Particle flux
top [sec] Continuous beam operation time
ρ0 [Ω·m] Residual electrical resistivity at cryogenic temperature ρRT [Ω·m] Electrical resistivity at room temperature
Tc [K] Superconductor critical temperature Tcs [K] Current sharing temperature
Tb [K] Bath temperature
Iop [A] Operation current
Ic [A] Superconductor critical current
∆Tmin [K] Magnet temperature margin
Tpeak [K] Coil peak temperature during the operation α [m2/sec] Thermal diffusivity
τt [sec] Characteristic time of thermal diffusion tcs [sec] Time at the moment of current sharing
f Friction factor
hc [W·m−2·K−1] Heat transfer coefficient
Tf [K] Temperature of flow
Tr [W/m−2] Heat flux
N u Nusselt number
D [m] Diameter of cooling pipe
Re Reynolds number
µ [Pa·sec] Viscosity
P r Prandtl number
G [kg·m−2·sec−1] Mass flow rate per cross-sectional area
˙
m [kg/sec] Mass flow rate
cp [J·kg−1·K−1] Specific heat at constant pressure Rdump [Ω] Resistance of dump resistor
Rcoil [Ω] Resistance of coil
τ [sec] Time constant of discharge
L [H] Inductance
Ec [V/m] Criterion for critical current of superconductor E [V/m] Electrical field
n n-Value
[F/m] Dielectric constant σ [S/m] Electrical conductivity J [A/m2] Current density
τm [sec] Characteristic time of current diffusion
dAl [m] Current diffusion length in aluminum-stabilizer Vt [V] Thermal voltage of diode
Is [A] Saturation current of diode
Φ [Wb] Magnetic flux
lM P Z [m] Length of minimum propagation zone
v [m/sec] Velocity of normal zone propagation VN ZP [V] Voltage of normal zone
Vth [V] Threshold of the voltage for quench detection τdet [sec] Validation time
ρtrans [Ω·m] Transverse electrical resistivity of copper matrix ρef f [Ω·m] Effective electrical resistivity
ps [m] Twist pitch of Rutherford cable
λ Fraction of superconductor in Rutherford cable Qc [W/m3] Inter-filament coupling loss per unit volume Qe [W/m3] Eddy current loss per unit volume
P [W/m] Eddy current loss per unit length R(T) [K/W] Thermal resistance
RK [K/W] Kapitza resistance
p [GeV/c] Momentum of charged particle
r [m] Radius of charged particle drift in magnetic field
This study as described in this thesis has been carried out at KEK and J-PARC where I staied from April, 2014 to March, 2018. I would like to thank everyone who advised and supported me to accomplish this thesis.
I would like to thank my supervisor at KEK, Associate Prof. Makoto Yoshida, Associate Prof. Masami Iio and Prof. Toru Ogitsu who directly advised me during this 4 years in KEK. With their supervision, this study will not be successful.
I would like to thank Prof. Nobuo Ikeda and Associate Prof. Kazuhiro Kajikawa from Kyushu university who give me a lot of useful comment on this thesis.
I would like to thank my supervisor in Kyushu university, Associate Prof. Kesuke Maehata, Assistant Prof. Nobuhiro Shigyo and emeritus Prof. Kenji Ishibashi who has retired in 2017. I want to thank them to give me an opportunity to have a research in KEK and work for the COMET experiment.
I would like to thank Prof. Tatsushi Nakamoto who gives me a lot of useful advices on superconducting magnets, and Associate Prof. Ken-ichi Sasaki who advised me on the study of quench.
I would like to thank Associate Prof. Michinaka Sugano in KEK to give me a lot of advices for HTS tape and helps for the critical current measurement.
I would like to thank Dr. Teakyung Ki who left KEK to Institute for Basic Science (IBS) to has a lot of discussions on the cryogenic system.
I would like to thank Prof. Yasuhiro Makida to give me a lot of advices for the quench simulation of ATLAS central solenoid.
I would like to thank Assistant Prof. Kento Suzuki in KEK to has a lot of discussions on the HTS coil and quench protection.
I would like to thank Associate Prof. Hiroshi Yamaguchi to has a discussion on the cooling pipe.
I would like to thank Dr. Yosuke Iwamoto and the others from PHITS group in Japan Atomic Energy Agency (JAEA) to help me to develop the algorithm in PHITS code.
I would like to thank Prof. Satoshi Mihara and Assistant Prof. Kazuki Ueno from Institute of Particle and Nuclear Studies at KEK to have many discussions about the radiation level in COMET experiment.
I would like to thank Dr. Akira Idesaki from Takasaki Advanced Radiation Research Institute at National Institutes for Quantum and Radiological Science and Technology (QST) to help me for the irradiation test.
I would like to thank everyone in cryogenics science center at KEK and cryogenics section at J-PARC during this 4 years.
I would like to thank everyone in COMET collaboration.
I would like to thank everyone at Kyushu University during this 5 years.
Ye Yang Tsukuba, Japan 2018.1.12
1
Chapter 1 Introduction
The application of muon nowadays is being attracted attention in the field of not only the particle physics but also the other field such as muon-catalyzed fusion [1], volcanoes muon imaging [2], nuclear transmutation of fission products [3] and so on, in which the high intense muon beam is required in most of applications. As for the current muon facility, for instance, in the µE1 beam line at Paul Scherrer Institute (PSI) [4] and Superomega beam line at Japan Proton Accelerator Research Complex (J-PARC) [5], several branch of beam lines are positioned surrounding the muon production target, and capture the secondary particle of muon produced from the bombardment of primary proton beam with a magnetic field as shown in Fig. 1.1. However, the muon yield in these muon beam lines is limited by the solid angle of magnet, and the magnetic field applied on production target since the production target is positioned out of magnet.
A novel method to collect the pion, a pion production system, was firstly discussed in the MELC project [6], in which a production target is embedded in the superconducting magnet, then the Muon to Electron COnversion (MECO) project took over the idea with a solenoid of Niobium-Titanium (NbTi) Rutherford superconducting cable [7]. However, the MECO experiment has been cancelled, then this novel pion production system is proved at the Research Center for Nuclear Physics (RCNP), Osaka University, MUon Science Innovative muon beam Channel (MuSIC) beam line. It is successful to deliver the world’s most intense muon beam of 4.2×10⁸ µ/sec with a 400 MeV, 400 W incident proton beam [8].
After this novel method to produce the high muon beam has been proved in MuSIC project, utilizing the same method, two projects, the COMET experiment and the Mu2e experiment to search for the muon-to-electron transition, are now under construction at J-PARC and FermiLAB respectively. For the COMET experiment, it is aiming to achieve the world’s most negative-muon with an intensity of 1011 µ−/sec [10]. In order to obtain the high intense muon beam, 1). high intense and high energy primary proton beam and 2). massive production target is essential for producing the pions resulting in muons. To collect the produced pions efficiently, the superconducting magnet with 1). large aperture and 2). high magnetic field on target is required. Therefore, an 8 GeV, 56 kW proton beam is utilized to produced the pions with a tungsten target, and the pions is captured with a magnetic field on target of 5 Tesla provided by a superconducting magnet system with an inner radius of 672 mm. In consequence, the
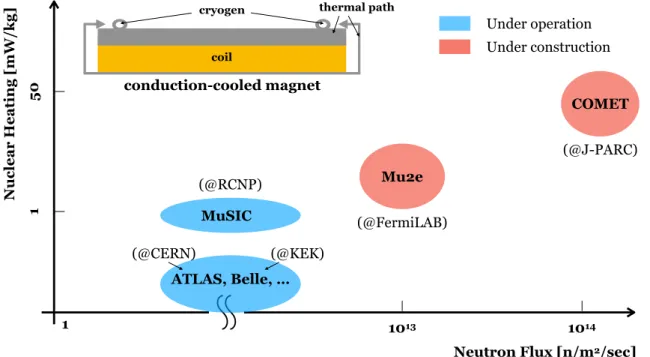
Figure 1.1: Layout of the Muon Science Facility (MUSE) in the Material and Life Science Facility (MLF) experimental hall at J-PARC (copyright: ELSEVIER [9]).
conduction-cooled superconducting magnet, Pion Capture Solenoid (PCS) will be exposed to the severe irradiation of secondary particles, which could affect the thermal performance of superconducting magnet during the beam operation. In order to improve the thermal performance of COMET superconducting magnets in high radiation environment, a novel method to insert the pure aluminum thermal path between coil layer is firstly proposed. In this thesis, feasibility study on the stable operation of the conduction-cooled superconducting magnet for high intense muon beam line (COMET-PCS), comprising the coil temperature and the quench protection is performed by using a novel design a novel design method with a consideration of nuclear heating in the magnet and degradation of the material properties due to the radiation.
This chapter gives an introduction of this study. Sec. 1.1 gives an introduction of the conduction-cooled superconducting magnets applied in the current and future experiment for particle physics. The radiation influence in the material applied to the superconducting magnet, which has been reported in past, is presented in Sec. 1.2. Then, an overview of superconducting magnet system in the COMET muon line is introduced in Sec. 1.3.
Section 1.4 presents the magnet design for the pion capture solenoid to enhance the radiation tolerance. In Sec. 1.5, the cryogenic system is described to show the capability of cooling down the magnets in a high radiation environment. In final, the overview of this thesis is given in Sec. 1.6.
1.1 Issue for Pion Production System
From the past to the present, a conduction-cooled superconducting magnet system, where the coil is conductively cooled with the thermal path made of pure metal such
Chapter 1. Introduction
as aluminum (see Fig. 1.2), is widely utilized the experiment for high energy physics.
Additionally, combining with the conduction-cooling, a aluminum-stabilized NbTi super- conducting cable is firstly adopted in the detector solenoid to let the particle through the magnet so that can be detected. Recently, the aluminum-stabilized conductor is also applied to remove the heat from the magnet. The technology of conduction-cooled superconducting magnet is usually utilized in a high radiation environment to
• minimize the tritium production in helium,
• reduce the nuclear heating by the reduction of the helium dewar in the cold mass of magnet system.
Although only about 1.4 ppm3He exists in the helium, the cross section of nuclear reaction with thermal neutrons:3He (n, p)3H is over 5000 b. Compared with a bath-cooled magnet, a conduction-cooled superconducting magnet can reduce the tritium production in the cryogen of helium is critical issue for a long-term operation. In contrast to the direct cooling, the conduction-cooling has the disadvantage of
• inefficient cooling ability,
and the cooling efficiency and magnet thermal stability rely on the thermal conductivity and contact area of the thermal path significantly.
coil
cryogen thermal path
Neutron Flux [n/m2/sec]
Nuclear Heating [mW/kg] 150
1014 1013
1
MuSIC
ATLAS, Belle, …
COMET
Mu2e conduction-cooled magnet
(@J-PARC)
(@FermiLAB) (@RCNP)
(@CERN) (@KEK)
Under operation Under construction
Figure 1.2: The conduction-cooled superconducting magnet operated in a high radiation environment.
Figure 1.2 shows the conduction-cooled superconducting magnet operated in a high radiation environment. For the Belle and ATLAS detector solenoid, there are no significant issue for the radiation influence on the conduction-cooled solenoid since the nuclear heating
and neutron flux is expected to be low enough. However, the effect of nuclear heat load on a conduction-cooled superconducting magnet for MuSIC project has been experimentally observed, and the coil temperature is increased by 0.4 K during the beam operation as reported by A. Sato [11]. As pointed out in Ref. [12][13], to design a conduction- cooled superconducting magnet in a higher neutron irradiation environment, the thermal conductivity will degraded by the irradiation of fast neutron and the other particles, and the damage will be accumulated at cryogenic temperature, however, the irradiation effect has never been analyzed. Then, the radiation influence for the pion production solenoid in the Mu2e experiment has been studied by a very simple model assuming a uniform degradation of thermal conductivity of aluminum stabilizer [14], and the coil temperature is shown to be increased from 5.0 K to 5.1 K even the residual resistance ratio (RRR) of stabilizer is degraded from 700 to 50. In the irradiation environment with a flux of 1014 n/m2/sec and a nuclear heating of 4 mW/kg, the thermal design is expected to be a more critical issue for the COMET conduction-cooled magnets. As the superconducting magnet applied on muon beam line listed in Table 1.1, much more intense primary proton beam will be used to produce more muon yield, and the superconducting magnet has to be operated at much higher irradiation environment. Therefore, a detailed study is essential to be carried out to show the feasibility of this conduction-cooled magnet in a high radiation environment.
Table 1.1: Comparison of pion capture solenoid system for current and future muon beam line [15][16][17][18].
MuSIC Mu2e COMET NuFACT
Status u.o.a u.c.b u.c. u.p.c
Muon momentum [MeV/c] 20-70 20-70 20-70 170-500
Magnet diameter [mm] 900 1600 1300 1300
Primary proton energy [GeV] 0.4 8 8 8
Primary proton intensity [kW] 0.4 25 56 4000
Target graphite tungsten tungsten mercury
Magnet field on target [Tesla] 3.5 5 5 20
Muon intensity [µ/sec] 3×10⁸ ∼1010 > 1011 1011−12
Nuclear heating [mW/kg] 1 ∼10 40 45
Neutron flux [n/m2/sec] ∼1011 > 1013 ∼1014
a: under operation.
b: under construction.
c: under planning.
1.2 Irradiation Influence on Superconducting Magnet
In general, the NbTi Rutherford superconducting cable consists of the twisted bunch of strands, in which the strands are made of the superconductor filaments and copper matrix.
Chapter 1. Introduction
As for PCS system in COMET muon beam line, the aluminum stabilized superconducting cable [19] is adopted for which the secondary particles can go through the aluminum stabilizer to avoid the nuclear heating. Additionally, the aluminum strips with high purity is employed as the thermal path. Besides the metals, the organic material such as epoxy, polyimide are applied to the spacer at layer jump and coil insulation. Since the radiation design must be carried out to avoid significant degradation on materials, a short introduction of the radiation influence on the superconductor, organic material, and metals is given here.
1.2.1 Superconductor
The mechanical strength for superconducting cable is enhanced by Rutherford cable.
Therefore, the damage on the critical surface of superconductor could affect the operation condition, thermal stability and quench characteristics. In the case of PCS, the radiation effect on the critical current of NbTi-type superconductor has been studied in many reports investigated with the reactor neutron irradiation [20][21], which presents the degradation starts from the neutron irradiation with fluence of 1022 n/m2 (En > 1 MeV).
The critical temperature is degraded by 0.15 K with the neutron irradiation of 1023 n/m2 as reported in Ref. [22].
1.2.2 Organic Material
As for the organic material, the radiation affects many material properties such as mechanical strength, thermal and electrical properties. Since the ionization is the major mechanism for the organic material since it breaks the chemical bonds and prevents the recombination of bonds, a lot of studies have been carried out with the gamma ray or ion irradiation. The radiation resistance of glass fiber reinforced plastics (GFRP) with cyanate-based resin has been examined by A. Idesakiet al., in which the BT-GFRP applied to PCS shows a good radiation tolerance on the mechanical strength and out-gassing until the gamma-ray irradiation of 100 MGy [23].
For the thermal properties, the degradation on polyimide (Kapton) insulation tape has been studied with ion irradiation as reported in Ref. [24]. With an irradiation of 5×10¹² Ni-ions/cm2 (25 MGy), nearly 50% degradation has been found in thermal conductivity, while no significant degradation is observed in specific heat below 20 K. The radiation tolerance on the thermal conductivity of BT insulation tape applied to COMET superconducting magnet has not been studied yet, therefore, it is measured and will be described in chapter 4 later.
1.2.3 Metals
The radiation, in particular, neutron irradiation induces the defects in metals, and the recombination of displaced atoms are difficult at cryogenic temperature, consequently, the electrical resistivity will be increased as a phenomenon of radiation damage, while, this damage can be recovered with a thermal cycle [25]. As for PCS, which is conduction-cooled with the inserted thermal path, the thermal characteristics during the irradiation will be
influenced by radiation significantly, since the electrical resistivity is correlated to the thermal conductivity in metals.
As the study done by J. Horak et al. [26], the electrical resistivity per Frenkel pair1 is given to be 6.8×10⁻⁴ Ω·cm for aluminum, and 2.5×10⁻⁴ Ω·cm for copper with the neutron irradiation of 1016 n/m2 (En > 0.1 MeV). Furthermore, the electrical resistivity has been investigated by M. Yoshidaet al. at cryogenic temperature with a higher neutron irradiation with a fluence up to 1020 n/m2 (En > 0.1 MeV) [27], in which the residual resistivity is confirmed to be increased linearly by accumulated neutron flux, and the degradation rate is given to be 0.03 nΩ·m. Compared the damage rate given by the increased electrical resistivity per Frenkel pair [28], the measurements carried out by M. Yoshidaet al. and J. Horaket al. give a higher degradation rate of electrical resistivity due to the neutron irradiation. Since the damage rate provided by J. Horak et al. is measured with a reactor neutron irradiation, here the damage rate is treated as the electrical resistivity per DPA.
Because the thermal conductivity of metals relies on its impurity corresponding to the RRR, as the estimation given in Sec. 3.2, the RRR of aluminum starts to degrade at the neutron fluence of 1019 n/m2 (or DPA of 10−6 DPA). For instance to the aluminum strip, the RRR of 2000 degrades to about 80 after the neutron irradiation with a fluence of 1020 n/m2, in which its thermal conductivity can be reduced by about factor 10 at cryogenic temperature. Furthermore, the degradation becomes RRR independent after the neutron irradiation of 1020 n/m2 (or 10−5 DPA).
Apart from the thermal properties, the mechanical strength of aluminum, which is mostly used in PCS, will not be affected by neutron irradiation at cryogenic temperature until a neutron fluence of 1023 n/m3 as reported in Ref. [29].
1.3 Overview of the COMET Superconducting Magnets
The COMET experiment, J-PARC E21 experiment, aims to search for the process:
µ−+N(A, Z) → e−+N(A, Z) with a single event sensitivity (SES) of 2.6×10⁻¹⁷. In order to achieve the required SES, the most efficient way is to upgrade the intensity of muon beam. Hence, a negative-muon beam with a intensity of more than 1011 µ−/sec is required for the COMET experiment, which is 3 orders better than the world’s highest intense muon beam in RCNP and PSI.
Since the process of muon-to-electron transition is produced by which the muon is captured in a stopping target, the negative-muon with low momentum is desirable for COMET experiment. In order to collect the low momentum muon as much as possible, backward pions are generated from a production target, and captured with a magnetic field on target of 5 Tesla. A novel method, pion capture system which has been proofed in MuSIC project, will be employed in the COMET experiment.
1Frenkel pair: a point defect in lattice. The defect forms when an atom leaves the original location in the lattice creating a vacancy, and becomes an interstitial by lodging in a nearby location.
Chapter 1. Introduction
The COMET Experiment 57
(a) Schematic with Key Component Names
(b) Event Display with Particle beams
Figure 3.6: The COMET Phase-II layout, schematically (a) and in the simulation (b). The 8 GeV proton beam (magenta in (b)) enters from the top-left, producing (amongst other things) pions (dark blue). Pions travelling backwards with respect to the proton beam are then transported through the Torus1 and Torus2 bent solenoids, during which time most of the pions decay, producing an intense muon beam (green). About 40% of these muons then stop in the stopping target (centre of image). Any electrons (yellow) coming from µ-e conversion are then transported through another 180 degrees of bent solenoid into the detector system. Also Figure 1.3: Schematic layout of the muon beam line and detector in the COMET experiment (Copyright: the COMET collaboration [16]).
1.3.1 COMET Muon beam line
The COMET muon beam line consists of the three parts of superconducting system, the Pion Capture Solenoid (PCS), the Muon Transport Solenoid (MTS) and the Detector Solenoid (DS) section as shown in Fig. 1.3. An 8 GeV, 56 kW proton beam slow-extracted from the J-PARC main ring is employed as the primary beam to bombard a tungsten target for the pion production. The backward pions resulting muons are captured in a magnetic field on target of 5 Tesla, then transported in a gradient magnetic field from 5 Tesla to 3 Tesla to the MTS. To avoid the background from the uncharged particles and positive-charged particles, the curved superconducting magnet of MTS are bended with 90 degree, and provides a magnetic field of 3 Tesla. Furthermore, a dipole magnet attached to the innermost of solenoid provides a dipole field of 0.055 Tesla to select the momentum of muon beam.
The most of selected muons will be captured by a stopping target made of aluminum plate, then, as a signal of muon-to-electron transition, a 105 MeV electron will be emitted from the stopping target. To eliminate the background, the superconducting magnets
7
will be designed for which only the signal of 105 MeV electron can be transported to the detectors. Then, the signal will be detected with a Straw-tube tracker and Electromagnetic Calorimeter (StrECAL) in a magnetic field of 1 Tesla.
The three parts of the superconducting magnet system are systematically separated to each other. The PCS and the first of half 90-degree curved superconducting magnets are settled in a high radiation environment of the experimental hall.
1.4 Pion Capture Solenoid
The pion capture solenoid plays an important role for the pion production and providing an enough length of 6 m for the pion decay resulting in muon. Also, the pions in the beam, which can cause the background in the search the muon-to-electron transition, are reduced through the decay in flight. A gradient magnetic field is provided from 5 Tesla to 3 Tesla to collect the pions, which must be smooth without any dips to avoid the trapping of the charged particle.
Figure 1.4: Configuration of the pion capture solenoid magnet system (copyright: IEEE [30]).
As shown in Fig. 1.4, the PCS consists of the large superconducting coils, Capture Solenoid (CS0 and CS1), Matching Solenoid (MS1 and MS2) and Transport Solenoid (TS1). The TS1 magnet is composed of 6 small coils, TS1a, TS1b, TS1c, TS1d, TS1e and TS1f. All these coils are designed in a same cryostat but separated to the different cold mass of CS and TS1. In both cold masses, the coils are supported by a support shell made of aluminum A5083 to keep the electromagnetic force below 64 MPa [30]. The cold mass is held in the cryostat by the support rods made of titanium alloy (Ti-6Al-4V) to avoid the conduction heat inleak from the warm side and fix the position of each coil. To
Chapter 1. Introduction
reduce the thermal radiation, the multilayer insulation (MLI) is employed to cover the thermal shield and magnets. Since a proton beam is delivered from J-PARC main ring and hits the production target with an angle of 10 degree, a beam duct is mounted via the TS1 cold mass. A 6.4 m long iron yoke is cover the entire PCS to shield the magnetic field as well as provide a fix position for support rods.
In addition to protect the superconducting magnet from the exposure of secondary particles, in particular, CS and MS coils, a massive radiation shielding made of tungsten alloy is surrounded the production target. A thick copper shielding is positioned next to the tungsten alloy shielding because the radiation in MS coils is expected to be lower than that of CS coils.
As for the power supply, all the coils in PCS are electrically connected in series, and fed with the nominal current of 2700 A by a current lead box. Table 1.2 gives the specification of each coil for the PCS. To obtain the smooth magnetic field along the beam axis, a trim current supply is applied in TS1b, TS1d, TS1e and TS1f coil to adjust the current.
Table 1.2: Coil specification for the PCS. r0 andr1 are the inner and outer radius of coil. z0
and z1 are the position of coil end along the beam axis. Bz is the required magnetic field along the beam axis.
Coil Bz r0 r1 z0 z1 Layer Turn Current density
[Tesla] [mm] [mm] [mm] [mm] [A/mm2]
CS0 4.0 672 824 -858 -1038 9 35 31.11
CS1 5.0 672 824 595 -795 9 270 31.11
MS1 4.0 672 756 2121 654 5 285 31.11
MS2 3.0 672 790 2910 2190 7 140 31.11
TS1a 3.0 250 265 2933 2727 1 40 34.15
TS1b 3.0 250 296 3204 2956 3 48 32.45
TS1c 3.0 250 311 3453 3247 4 40 33.13
TS1d 3.0 250 311 3805 3475 4 64 33.13
TS1e 3.0 250 296 4053 3847 3 40 33.13
TS1f 3.0 410 502 4355 3995 6 70 36.89
1.4.1 Coil Structure in Pion Capture Solenoid
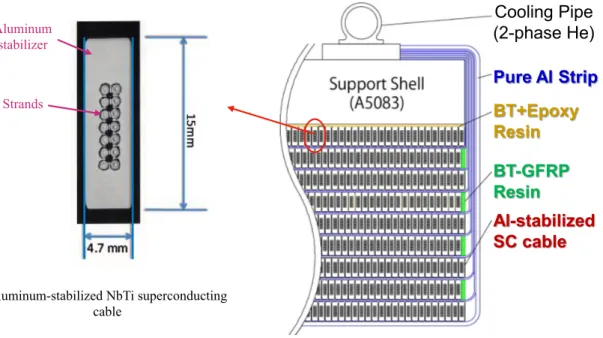
As mentioned in previous section, the superconducting coil for PCS has to be designed against the high irradiation environment. Taking the radiation influence into account, a coil structure is designed for the magnets in PCS as given in Fig. 1.5 All magnets in PCS are conduction-cooled with two-phase helium forced flow in cooling pipes. In contrast to a bath-cooled magnet system, the cooling ability for that of conduction-cooling is not efficient, however, the liquid helium dewar can be eliminated to reduce the total mass and the nuclear heating on dewar as well as the tritium production. A thermal path made of high pure aluminum (RRR = 2000) with a thickness of 1 mm are inserted between the coil layers, and connected to cooling pipe to remove the nuclear heating in coil efficiently.
Because the secondary particles deposit their energy in the superconducting cable, the aluminum stabilized superconducting cable based on NbTi is employed so that the
secondary particles can pass through, and the heat can be easily removed due to the excellent thermal conductivity of aluminum. The stabilized is made of a 5N aluminum with 0.1% nickel mixed (RRR = 400), which also has a good yield strength at cryogenic temperature. The design parameters of the aluminum-stabilized conductor are summarized in Table 1.3.
/32
15 /32
Key Technologies for Radiation-Resistant Coil
Cooling Pipe (2-phase He)
Pure Al Strip BT+Epoxy Resin BT-GFRP Resin
Al-stabilized SC cable
• Minimization of nuclear heating
• Minimization of radioisotope generation
Coils are cooled with small amount of Liq. He
through Al-strips
- Lightweight coils have an advantage in reducing energy deposition by radiation
Al-stabilized cable
- Bath cooling could cause liquid helium activation (Tritium production)
Conduction cooling method
Al stabilized SC cableSize: 4.7x15mmOffset yield point of Al@4K: >85MPaRRR@0T: >500Al/Cu/SC: 7.3/0.9/114 SC strands: 1.15mm dia.
Pion Capture Solenoi d
Alumi num stabili zed SC cable to red uce nuclea r he ati ng ( ma x. 35 mW/kg) Radiation resistant insulator, resin Pure alum inum strips in betwee n layer s to co ol do wn a coi l in si de
7
CS coi l struc ture
Aluminum-stabilized NbTi superconducting cable
Aluminum stabilizer
Strands
Figure 1.5: Overview of the coil structure for pion capture solenoid.
As for the insulation, an insulation composed of polyimide film and boron free glass fabric pre-impregnated with the epoxy blended with bismaleimide-triazeine (BT) resin, BT-prepreg tape is developed for the enhancement of radiation tolerance. This BT-prepreg tape is employed as both ground insulation between the thermal path and coil layer and turn-turn insulation in PCS magnets. The details of BT-prepreg tape will be described later in chapter 4. Also the glass fabric reinforced plastic (GFRP) impregnated with BT resin is utilized as the jumper at the coil end to fill the space between layer to layer. The coil is impregnated with the epoxy resin during the coil winding, and reformed by the heat treatment after the fabrication.
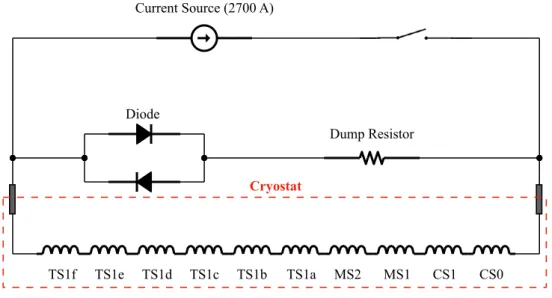
1.4.2 Quench Protection System
Magnet quench, a transition from the superconductor state to normal conductor state, could cause the burnout of the coil owing to the joule heating. Totally 47 MJ energy is stored in the PCS, and the total inductance is 12.69 H so that the longer time constant of current discharge is expected, and coil could be burnout by magnet quench. To protect the magnet against the quench, a self-protection system is adopted for the PCS, in which all of the coils in PCS are connected together, and the stored energy is extracted with a dump resistor as shown in Fig. 1.6. To avoid the radiation damage occurred in the diode, the dump resistor and diode are set out of the cryostat and operated at room temperature.
10
Chapter 1. Introduction
Table 1.3: Design parameters of the aluminum-stabilized conductor for PCS
Item Value
Conductor Aluminum stabilized NbTi superconducting cable Size 15.0 × 4.7 mm2 (without insulation)
15.3 × 5.0 mm2 (with insulation) Strand diameter 1.15 mm
Number of strands 2 × 7
Al : Cu : NbTi 7.3 : 0.9 : 1.0 Aluminum RRR 400
Copper RRR 50
Critical current 14.1 kA at 4.2 K and 5 Tesla
Cable insulation Polyimide film / Boron-free glass cloth / BT-Epoxy prepreg When a quench signal is detected, the power supply is shutdown immediately, and the current in magnet is discharged in the protection circuit within about 3 minutes due to the large inductance.
These magnets are capable of being protected with a dump resistor as well as the helps from the thermal path inserted between coil layers which acts as the quench propagators.
The details of quench protection are analyzed and presented later in chapter 5.
CS0 CS1 MS1 MS2 TS1a TS1b TS1c TS1d TS1e TS1f
Current Source (2700 A)
Dump Resistor Diode
Cryostat
Figure 1.6: Quench protection circuit for Pion Capture Solenoid magnet system.
1.5 Cryogenic System
All of the superconducting magnets in the PCS and MTS are conduction-cooled by two-phase forced helium flowing in the cooling pipes which are welded on the outer surface of support shell made of aluminum A5083. The diameter and thickness of cooling pipe in
![Table 1.1: Comparison of pion capture solenoid system for current and future muon beam line [15][16][17][18].](https://thumb-ap.123doks.com/thumbv2/123deta/9916302.1918607/28.892.152.745.664.912/table-comparison-pion-capture-solenoid-current-future-muon.webp)