九州大学学術情報リポジトリ
Kyushu University Institutional Repository
Point mutations in yeast
oligosaccharyltransferase decouple the oligosaccharyl transfer and hydrolysis of lipid-linked oligosaccharide reactions: an improved purification strategy and peptide substrate for the oligosaccharyltransferase researches
山﨑, 貴大
http://hdl.handle.net/2324/4474954
出版情報:九州大学, 2020, 博士(システム生命科学), 課程博士 バージョン:
権利関係:
Point mutations in yeast oligosaccharyltransferase decouple the oligosaccharyl transfer and hydrolysis of lipid-linked oligosaccharide reactions: an improved purification strategy and peptide substrate for the oligosaccharyltransferase researches
by
TAKAHIRO YAMASAKI
A DISSERTATION
Submitted in partial fulfillment of the requirements for the degree DOCTOR OF PHILOSOPHY (Ph.D.) IN SYSTEM LIFE SCIENCES
Graduate School of Systems Life Sciences
KYUSHU UNIVERSITY Fukuoka, Japan
February 2021
Supervised by:
Professor Daisuke Kohda
Table of Contents
Acknowledgments……… 4
Abbreviations used in this thesis……… 5
Abstract……… 6
Chapter 1. Introduction……… 7
1.1 Post-translational protein modification 1.2 N-glycosylation 1.3 Free N-glycan (FNG) 1.4 OST complex of Saccharomyces cerevisiae 1.5 Interchangeable subunit: OST3 and OST6 1.6 Motivation Chapter 2. Construction of the experimental system for the study……… 13
2.1 The merits of yeast for this study 2.2 Gene manipulation 2.3 Yeast genetic experiments 2.3.1 Common motifs of STT3 protein 2.3.2 Preparation of stt3 knockout strain 2.3.3 Plasmid shuffling 2.4 Purification of OST complex for studies 2.4.1 Effect of PA tag to STT3 protein on yeast growth 2.4.2 Purification of OST complex including Stt3 subunit protein expressed by plasmid 2.5 Check contamination of the yeast OST preparation 2.6 In vitro assay 2.6.1 Oligosaccharyl transfer assay 2.6.2 FNG generation assay 2.7 Preparation of peptide substrate 2.8 Effect of tag position 2.9 Kinetic parameters for peptide substrates 2.10 Discussion Chapter 3. Mutation study of yeast STT3 subunit……… 46
3.1 Determination of mutation sites 3.2 Plasmid shuffling
3.3 Protein purification 3.4 In vitro assay
3.4.1 Oligosaccharyl transfer assay 3.4.2 FNG generation assay
3.5 Comparison of mutated OST complex 3.6 In vivo assay
3.6.1 N-glycosylation status
3.6.2 Quantification of FNG in cells 3.6.3 Quantification of LLO in cells
3.6.4 Quantification of the total N-glycans from mannoproteins 3.7 Peptide optimization for studies
3.8 Conclusion of mutation study 3.9 Discussion
Chapter 4. The response to environmental stress conditions……… 70 4.1 Growth plate assay with chemical compounds
4.1.1 Effect of mutation 4.1.2 Effect of gene knockout 4.1.3 Tolerance of tunicamycin
4.2 Growth liquid culture assay with chemical compounds 4.2.1 Growth rate
4.2.2 Amount of FNG in the cell 4.3 Sensitivity of OST to DTT
4.4 Discussion
Chapter 5. Electron microscopy analysis of yeast OST complex……… 82 5.1 Introduction
5.2 Importance of structural domain in OST3 and OST6 for yeast 5.3 Comparison of acquired density map vs known structure 5.4 Discussion
Chapter 6. Conclusion……… 88 References……… 90
Acknowledgments
Upon the completion of this thesis, I am grateful to those who have offered me support during my study.
Firstly, I would like to express my sincere gratitude to my supervisor, Prof. Daisuke Kohda, whose suggestions and encouragement are beneficial to me a lot.
I appreciate Dr. Atsushi Shimada and Dr. Kouta Mayanagi giving professional technical supports about respectively X-ray crystal structure analysis and electron microscopy analysis.
I thank Dr. Shunsuke Matsumoto, Dr. Rei Matsuoka, Dr. Daisuke Fujinami, Dr. Yuya Taguchi, and Dr. Hiromi Ogino for technical supports in the experiments. Also, I learned how to think scientifically from many discussions.
Finally, I would like to thank all the people I have met, both directly and indirectly through literature and lectures, for their knowledge and experiments that helped me complete this paper.
Abbreviations used in this thesis:
2-AP, 2-aminopyridine
CBB, Coomassie Brilliant Blue CPY, carboxypeptidase Y ER, endoplasmic reticulum FNG, free N-glycan
5-FOA, 5-fluoroorotic acid
GPD, glyceraldehyde 3-phosphate dehydrogenase LLO, lipid-linked oligosaccharide
OD, optical density
OST, oligosaccharyltransferase PA, a high-affinity tag
PNGase, peptide : N-glycanase
TAMRA, 5(6)-carboxytetramethylrhodamine tam, TAMRA
UPLC, ultra-performance liquid chromatography WT, wild-type
O-GlcNacylation, O-linked-N-acetylglucosaminylation GPI, Glycosylphosphatidylinositol
HA, Human influenza hemagglutinin
MALDI-TOF-MS, Matrix-Assisted Laser Desorption/Ionization Time of Flight Mass Spectrometry
DTT, 1,4-dithiothreitol
SDS-PAGE, Sodium dodecyl sulfate Polyacrylamide gel electrophoresis EDTA, ethylenediaminetetraacetic acid
DMSO, Dimethyl Sulfoxide Tm, Tunicamycin
H2O2,hydrogen peroxide
Cryo-EM, Cryo-electron microscopy
PyMOL, molecular visualization system software
Abstract
Oligosaccharyltransferase (OST) is responsible for the first step in the N-linked glycosylation, transferring an oligosaccharide chain onto asparagine residues to create glycoproteins. In the absence of the acceptor asparagine, OST hydrolyzes the
oligosaccharide donor, lipid-linked oligosaccharide (LLO), and releases free N-glycans (FNGs) into the endoplasmic reticulum (ER) lumen constitutively. Here, I established a purification method for mutated OSTs using a high-affinity epitope tag attached to the catalytic subunit Stt3, from yeast cells co-expressing the wild-type OST to support growth. A high-affinity epitope tag attached to the catalytic subunit Stt3 enabled the preparation of functionally impaired OSTs free from the genome-derived native Stt3.
The purified OST protein with mutations is useful for wide-ranging biochemical experiments. I assessed the effects of mutations in the Stt3 subunit on the two enzymatic activities in vitro, as well as their effects on the N-glycan attachment and FNG content levels in yeast cells. The correlations with the growth phenotype suggested that FNG in the ER was dispensable for the growth of yeast cells under laboratory conditions. I found that mutations in the first DXD motif increased the FNG generation activity relative to the oligosaccharyl transfer activity, both in vitro and in vivo, while mutations in the DKM motif had the opposite effect. The decoupling of the two
activities may facilitate future deconvolutions of the reaction mechanism. The isolation of the mutated OSTs also enabled me to identify different enzymatic properties in OST complexes containing either the Ost3 or Ost6 subunit and to find a 15-residue peptide as a better quality substrate than shorter peptides. This toolbox of mutants, substrates, and methods will be useful for investigations of the molecular basis and physiological roles of the OSTs in yeast and other organisms.
Chapter 1 Introduction
1.1 Post-translational protein modification
Many proteins function with post-translational modifications 1. More than 200 post- translational modifications have been reported in eukaryotes 2. Phosphorylation and O- GlcNacylation are representative of reversible modifications, which are modulated by signaling molecules 3,4. Among glycosylations, there are N-linked, O-linked, GPI anchor type, etc. In glycosylation, the chemical structure of the transferred
oligosaccharide chain is processed by other glycosyltransferases and glycosidases in the endoplasmic reticulum (ER) and Golgi apparatus, which results in various glycan structures in response to the environment and stimuli of cell 5.
1.2 N-glycosylation
N-glycosylation refers to the covalent attachment of an oligosaccharide chain on asparagine residues in proteins (Fig. 1) 6–8. The N-glycosylation consensus, Asn-X- Ser/Thr (X≠Pro), is the sequon, and the N-oligosaccharide chain attached to a protein is the N-glycan. The oligosaccharide donors are lipid-linked oligosaccharides (LLOs) 9. The oligosaccharide portion of LLO is transferred to the side-chain carboxamide group of asparagine residues in the sequon by the action of oligosaccharyltransferase (OST) at the luminal side of the rough endoplasmic reticulum 10. In the absence of the acceptor asparagine, OST hydrolyzes LLO and releases free N-glycans (FNGs) into the ER lumen constitutively 11,12. In higher eukaryotes, including the budding yeast
Saccharomyces cerevisiae (S. cerevisiae), the transfer of the 14-residue oligosaccharide chain, Glc3Man9GlcNAc2. N-linked glycosylation serves as a marker for folding, hydrophilic surface, and signaling molecules, contributing to protein quality control and cell-cell interactions 5. Statistical studies revealed that two-thirds of the sequons are glycosylated 13. The proper selections of the sequons to be glycosylated or left
unmodified are a prerequisite for the protein quality control in the ER and subsequent degradation in the cytosol 6,7. Genes involved in N-linked glycosylation include glycan donor synthases, glycosidases, and glycosyltransferases. It has been estimated that human glycome requires more than 700 proteins to generate the glycan structures 14. Congenital disorder of glycosylation (CDG) disease is a human genetic disease involved in glycosylation 6. Many reports of CDG diseases are caused by mutations in genes
Figure 1. Overview of the oligosaccharyltransferase enzymatic reaction.
The Oligosaccharyltransferase (OST) catalyzes the transfer of a sugar chain to the asparagine residues in the consensus sequence (N-X-S/T, X≠P). The OST also
hydrolyzes lipid-linked-oligosaccharide (LLO) to generate free N-glycan (FNG). The yeast OST consists of eight membrane protein subunits, including the catalytic subunit, STT3 (yellow). ER, endoplasmic reticulum.
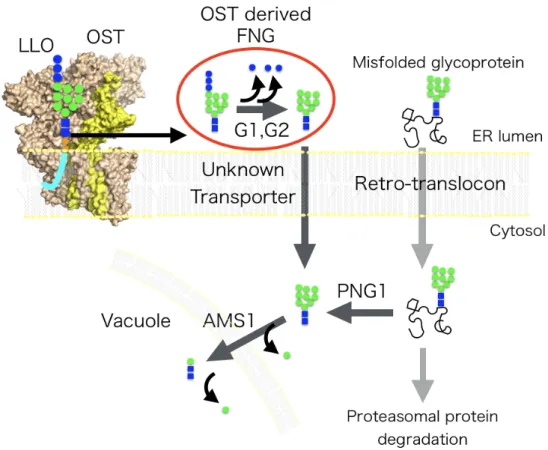
1.3 Free N-glycan (FNG)
Interestingly, oligosaccharide chains that are not attached to proteins reportedly accumulate inside the ER and the cytosol (Fig. 2) 16. The peptide:N-glycanase (PNGase), Png1, cleaves the N-glycans from misfolded glycoproteins in the cytosol.
The PNGase-derived "free" N-glycans (FNGs) account for 95% of the total FNGs in the yeast cytosol 11. The yeast OST generates the remaining 5% of FNGs via LLO
hydrolysis reaction. No other enzyme had been found that can hydrolyze mature LLO.
The OST-derived FNGs are transported from the ER to the cytosol for degradation by a cytosol-vacuolar α-mannosidase, Ams1 17,18. The amounts of FNGs generated by OST can be measured using a png1∆ams1∆ double-knockout strain, by suppressing the generation of the cytosol-originated FNGs 11. In contrast, most of the FNGs in the ER and the cytosol are attributed to the hydrolytic activity of OST in the ER lumen in mammalian cells 12. In mammalian cells, Manβ1-4GlcNAc disaccharide is produced by FNGs degradation enzymes and stimulated immune responses 19. It had also been
suggested that FNG generation activity may differ depending on the subunit
composition of the OST complex in mouse embryonic fibroblasts 20. In plant cells, mass spectrometry analyses had suggested that FNG may be released from the ER to the extracellular space via the Golgi apparatus in the same manner as secretory proteins 21. In other free oligosaccharide researches, free GPIs, nonprotein-anchor GPI were existed at the plasma membrane in some tissues of mice and modified the same structural remodeling pathway as do protein-linked GPI 22. It was reported that glucose starvation induced the accumulation of free O-mannosylated glycans in budding yeast 23.
Previously reports showed that N-glycan conjugated asparagines directly promote protein folding 21,24,25. It should be noted here that the physiological function of the FNG in ER remains largely unexplored.
Figure 2. Outline of the FNGs processing pathway in yeast.
OST generates FNG consisting of 14 sugars in the ER lumen by LLO hydrolysis. 14 Sugar FNG is trimmed by the action of ER luminal α-glucosidase I (G1) and α- glucosidase II (G2) as well as sugar chains on glycoproteins. FNGs and misfolded
transporters. The sugar chain of the misfolded glycoprotein is cleaved from the protein by the action of cytoplasmic PNGase, and FNGs are produced. Cytosolic FNGs are degraded by the action of Ams1 localized at the vacuole.
1.4 OST complex of Saccharomyces cerevisiae
The budding yeast Saccharomyces cerevisiae (S. cerevisiae) is a model organism for eukaryotes. The yeast OST complex consists of the same number of subunits as the human OST complex (Table. 1). The yeast OST is a membrane-embedded protein complex consisting of eight membrane-protein subunits in an equimolar ratio. Stt3, Wbp1, Swp1, Ost1, and Ost2 are essential gene products, while Ost3/Ost6, Ost4, and Ost5 are non-essential gene products 10. The Stt3 subunit has a catalytic site. In general, eukaryotic genomes encode multiple paralogous stt3 genes 26. The homologous Stt3 proteins expressed from these paralogous genes generate different OST complexes.
Except for Caenorhabditis species, the genomes from all sequenced metazoan
organisms contain two STT3 genes (STT3A and STT3B). Plant genomes also encode two copies of STT3 genes (STT3A and STT3B) 27. In the phylum Protista, for example, the Leishmania major genome contains four stt3 genes, stt3A, stt3B, stt3C, and stt3D 28. Despite their similar names, the human and protist genes lack direct orthologous
relationships 27,29. One important exception is fungi, including S. cerevisiae, with genomes encoding a single stt3 gene. The human STT3B protein sequence is more similar to the yeast Stt3 protein sequence, suggesting that the human STT3A is a newcomer in evolution and the human STT3B is orthologous to the yeast Stt3 29.
Table 1. Subunit composition of OST complex in Homo sapiens and S. cerevisiae Genes in the same row are a homologous relationship. The left column showed the molecular weight of Homo sapiens protein. In Homo sapiens, two OST complexes exist, STT3A complex and STT3B complex that contains each STT3A or STT3B as the catalytic subunits. STT3A complex contains either KCP2 or DC2 subunit. STT3B complex contains either TUSC3 or MAGT1 subunit. In S. cerevisiae, the OST complex contains either Ost3 or Ost6.
1.5 Interchangeable subunit: OST3 and OST6
In place of the single Stt3, the yeast genome encodes the two paralogous ost3 and ost6 genes, which generate two different OST forms containing either Ost3 or Ost6 (Table. 1)
30. The ratio of the Ost3-containing to Ost6-containing OST complexes is 4:1 11. Single deletions of either Ost3 or Ost6 resulted in moderate underglycosylation of proteins, and the Ost3 and Ost6 double knockout led to severe underglycosylation in yeast cells 31.
1.6 Motivation
It is still unclear whether FNGs in the ER have a physiological function or not.
Previous studies had suggested that the hydrolysis of LLO may be a side reaction, as the amounts of FNGs were reduced in the cells when impaired OST mutants expressed 11,32. However, one was in vivo mutant analysis using bacteria cells which OST is not
Leishmania major OST with lethal phenotypic mutations in yeast 11. The previous article had suggested that FNG generation activities may differ by the difference of subunit composition of OST complex in mouse embryonic fibroblast 20.
I think it is important to consider FNG generation activity and oligosaccharyl transfer activity separately for exploring the function of FNGs. However, there are few
examples of examining it in detail.
In this study, I measured the oligosaccharyl transfer activity and the hydrolytic activity of LLO in vitro, using the OST complexes carrying mutations in the catalytic Stt3 subunit. In parallel, I determined the N-glycosylation status of the glycoproteins and the amounts of FNGs generated by OST in strains harboring the same stt3 mutations. These detailed comparisons of the two activities of a series of mutations provided new insights into the N-glycosylation reactions in vitro and in living cells. Then, I explored under what conditions the amount of intracellular FNG changes and identified the factors that cause changes in OST activity. By studying the relationship between the amount of intracellular FNG and phenotype, I would clarify how the OST-derived FNG in the ER affects the survival of the organism.
Chapter 2 Construction of the experimental system for the study
2.1 The merits of yeast for this study
In this study, I needed to use an experimental organism that would allow us to easily determine the amount of FNG and its phenotype. Therefore, I chose budding yeast, S.
cerevisiae, which OST is essential for survival. Yeast has only OST and PNG1 enzymes that generate FNG, and few N-glycan trimming enzymes 33. There is a wealth of
information such as OST structural information 34,35, N-glycome analyses 36,37, and glycosidase annotations 11,18,38. Yeast grows quickly and is a unicellular model genetic organism and used for studies of common cellular processes in higher organisms.
2.2 Gene manipulation
Yeast is easy to allow genetic manipulation and can be selected based on auxotrophy and antibiotic resistance. Sporulation and PCR fragments were used to create a gene knockout strain of yeast. I used a native promoter or constitutive strong expression promoter (glyceraldehyde 3-phosphate dehydrogenase: GPD) for expression from plasmids.
Yeast strains used in this study are listed in Table 2.
Plasmids used in this study are listed in Table 3.
Table 2. Yeast strains used in this study
Strain name Genotype Source Purpose
BY4741 MATa his3Δ1 leu2Δ0 met15Δ0 ura3Δ0
Laboratory strain
Parental strain, Source of LLO stt3∆-
pSTT3
MATa stt3∆::KanMX BY4741- pRS316-STT3
This study Plasmid shuffling
stt3∆ png1∆
ams1∆- pSTT3
MATa stt3∆::KanMX
png1∆::HygMX ams1∆::LEU2 BY4741- pRS316-STT3
This study Plasmid shuffling
stt3∆ png1∆
ams1∆- pSTT3/pST
MATa stt3∆::KanMX
png1∆::HygMX ams1∆::LEU2 BY4741- pRS316-STT3/pRS313-
This study Plasmid shuffling
stt3∆ png1∆
ams1∆- pSTT3(X)
MATa stt3∆::KanMX
png1∆::HygMX ams1∆::LEU2 BY4741- pRS313-STT3(X)
This study Quantification of the glycosylation status of CPY and Wbp1, and the amounts of FNG, LLO, and
mannoprotein N- glycans
ost6∆- pOST3a
MATa ost6∆::LEU2 BY4741- pOST3
This study Production of OST[Ost3, PA- Stt3(X)]
ost6∆
ost4PA- pOST3a
MATa ost6∆::LEU2 ost4∆::ost4- PA BY4741- pOST3
This study Production of OST[Ost3, Ost4- PA]
ost3∆ost4P A-pOST6b
MATa ost3∆::LEU2 ost4∆::ost4- PA BY4741- pOST6
This study Production of OST[Ost6, Ost4- PA]
ost6∆- FLAGstt3- pOST3a
MATa ost6∆::LEU2 stt3∆::HygMX-FLAG-stt3 BY4741- pOST3
This study Check
contamination of mutated PA-Stt3 by WT FLAG- Stt3
png1∆
ams1∆
MATa png1∆::HygMX ams1∆::LEU2 BY4741
This study The amounts of FNG in stress conditions W303-1A MATa {leu2-3,112 trp1-1 can1-
100 ura3-1 ade2-1 his3-11,15}
Laboratory strain
Determination of the mating type W303-1B MAT alpha {leu2-3,112 trp1-1
can1-100 ura3-1 ade2-1 his3- 11,15}
Laboratory strain
ost6∆ ost3∆
ost4PA- pOST3a
MATa ost6∆::LEU2
ost3∆::HygMX ost4∆::ost4-PA BY4741- pOST3
This study Plasmid shuffling
aThe extra expression of Ost3 from the pOST3 plasmid reduces the deleterious effects by the absence of Ost6.
bThe extra expression of Ost6 from the pOST6 plasmid reduces the deleterious effects by the absence of Ost3.
Table 3. Plasmids used in this study
Plasmid name Description Source Purpose
pRS316 CEN6/ARS4, URA3 BYP562,
National BioResource Project Japan
Parental plasmid
pRS316-STT3 described previously Reference 39 Expression of WT Stt3 under the native promoter
pRS313 CEN6/ARS4, HIS3 BYP559,
National BioResource Project Japan
Parental plasmid, An empty plasmid in Figs. 5, 17, 18, 35
pRS313-STT3- 3HA
described previously Reference 39 Expression of WT Stt3 under the native promoter
pRS313-STT3 3×HA tag sequence was removed from pRS313- STT3-3HA
This study Expression of WT and mutated Stt3 under the native promoter in plasmid shuffling experiments and other in vivo experiments pSTT3(E45A) pRS313-STT3(E45A) This study
pSTT3(E45D) pRS313-STT3(E45D) This study pSTT3(E45K) pRS313-STT3(E45K) This study pSTT3(E45Q) pRS313-STT3(E45Q) This study pSTT3(D47A) pRS313-STT3(D47A) This study pSTT3(D166A) pRS313-STT3(D166A) This study pSTT3(E168A) pRS313-STT3(E168A) This study pSTT3(D583A) pRS313-STT3(D583A) This study pSTT3(K586A) pRS313-STT3(K586A) This study
pSTT3(K586L) pRS313-STT3(K586L) This study pSTT3(K586R) pRS313-STT3(K586R) This study pSTT3(K586S) pRS313-STT3(K586S) This study pSTT3(M590A) pRS313-STT3(M590A) This study pAG416-GPD-
ccdB
CEN6/ARS4, HIS3, GPD, CYC1, ccdB
#14148, Addgene
Parental plasmid
pOST3 pAG416-GPD-OST3 This study Compensate for the lack of Ost6 pOST6 pAG416-GPD-OST6 This study Compensate for the
lack of Ost3 pPA-STT3 pRS313-GPD-PA-spacer-
STT3
This study Expression of WT and mutated PA-Stt3 under the GPD
promoter in the strain, ost6∆-pOST3
pPA-
STT3(E45A)
pRS313-GPD-PA-spacer- STT3(E45A)
This study
pPA-
STT3(E45D)
pRS313-GPD-PA-spacer- STT3(E45D)
This study
pPA-
STT3(E45K)
pRS313-GPD-PA-spacer- STT3(E45K)
This study
pPA-
STT3(E45Q)
pRS313-GPD-PA-spacer- STT3(E45Q)
This study
pPA-
STT3(D47A)
pRS313-GPD-PA-spacer- STT3(D47A)
This study
pPA-
STT3(R159A)
pRS313-GPD-PA-spacer- STT3(R159A)
This study
pPA-
STT3(E350A)
pRS313-GPD-PA-spacer- STT3(E350A)
This study
pPA-
STT3(W517A)
pRS313-GPD-PA-spacer- STT3(W517A)
This study
pPA-
STT3(D518A)
pRS313-GPD-PA-spacer- STT3(D518A)
This study
pPA-
STT3(D583A)
pRS313-GPD-PA-spacer- STT3(D583A)
This study
pPA-
STT3(K586A)
pRS313-GPD-PA-spacer- STT3(K586A)
This study
pPA-
STT3(K590A)
pRS313-GPD-PA-spacer- STT3(M590A)
This study
pGST-C-NVT8 pGEX6p-GST-C-NVT8 This study Expression of oligosaccharyl transfer substrate peptide
pGST-C-NVT9 pGEX6p-GST-C-NVT9 This study pGST-C-
NVT18
pGEX6p-GST-C-NVT18 This study
pGST-C- NVT28
pGEX6p-GST-C-NVT28 This study
pFA6a-OST4- PA-URA4MX6
pFA6a-OST4-PA- URA4MX6
This study Preparation of ost4PA strain pFA6a-
ura4MX6
pFA6a-ura4MX6 # 49184,
Addgene
Parental plasmid
pFA6a-6xGLY- 3xFLAG- hphMX4
pFA6a-6xGLY-3xFLAG- hphMX4
# 20755, Addgene
Parental plasmid
pRS313-OST3 pRS313-OST3 This study Plasmid shuffling pRS313-OST3
∆26-175 AA
pRS313-OST3 ∆26-175 AA
This study
pRS313-OST3
∆26-205 AA
pRS313-OST3 ∆26-205 AA
This study
pRS313-OST3
∆2-175 AA
pRS313-OST3 ∆2-175 AA This study
pRS313-OST3
∆2-205 AA
pRS313-OST3 ∆2-205 AA This study
pRS313-OST6 pRS313-OST6 This study
pRS313-OST6
∆28-178 AA
pRS313-OST6 ∆28-178 AA
This study
pRS313-OST6
∆28-205 AA
pRS313-OST6 ∆28-205 AA
This study
pRS313-OST6
∆2-178 AA
pRS313-OST6 ∆2-178 AA This study
pRS313-OST6
∆2-205 AA
pRS313-OST6 ∆28-205 AA
This study
2.3 Yeast genetic experiments
2.3.1 Common motifs of STT3 protein
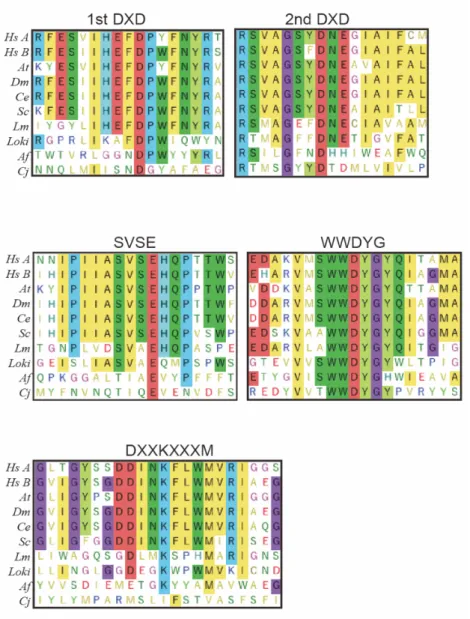
Comparison studies revealed that several common motifs in STT3 catalytic subunit conserved in the three domains of life, 1st DXD (Glu45-Asp47), 2nd DXD (Asp166-Glu168), SVSE (Ser347-Glu350), WWDYG (Trp516 -Trp517-Asp518-Tyr519-Gly520), and DKM
(Asp583-Lys586-Met590) (Fig. 3) 35,39.
Figure 3. Multiple sequence alignments of amino acid sequences of conserved motifs of STT3 proteins.
STT3 protein sequences contain five evolutionally conserved structural motifs among three domains of life. The species from the top to the 7th line are Eukaryota.
Lokiarchaeum sp. GC14_75 and Archaeoglobus fulgidus are Archaea species.
Campylobacter jejuni is Eubacteria.
Symbols: Hs A, Homo sapiens STT3A; Hs B, Homo sapiens STT3B; At, Arabidopsis thaliana STT3A; Dm, Drosophila melanogaster STT3B; Ce, Caenorhabditis elegans STT3; Sc, Saccharomyces cerevisiae STT3; Lm, Leishmania major STT3D; Loki, Lokiarchaeum sp. GC14_75 AglB; Af, Archaeoglobus fulgidus AglB; Cj,
Campylobacter jejuni PglB.
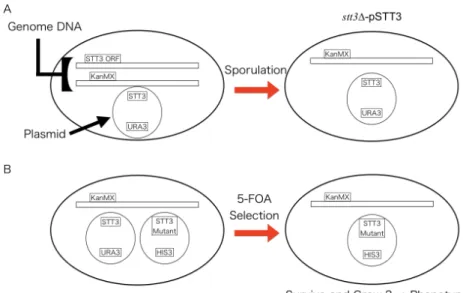
2.3.2 Preparation of stt3 knockout strain
For in vivo mutagenesis studies, I prepared an stt3 knockout strain. Because stt3 is an essential gene for yeast survival, the stt3 knockout strain was sustained the stt3
expression plasmid (pRS316-STT3). Thus, I used the sporulation method for creating an stt3 knockout strain.
creating a haploid strain stt3∆-pSTT3
The Yeast Hetero-Diploid Knock Out Strain YGL022W (YSC1021-6716911, Mata/alpha his3/his3 leu2/leu2 lys2/LYS2 MET15/met15 ura3/ura3
∆stt3::kanMX4/STT3, dharmacon) was purchased and transformed with pRS316-STT3
39. The STT3 regions of pRS316-STT3 and pRS313-STT3 are 2,680-bp fragment containing the entire stt3 gene (2,157 bp) plus 299 bp (native promoter) and 224 bp (native terminator) at the 5' and 3' ends, respectively. pRS313-STT3 was generated by the deletion of the 3×HA tag sequence (30 amino acid residues) from the pRS313- STT3-3HA plasmid constructed previously 39. After sporulated, the haploid strain stt3∆- pSTT3 (MATa his3 leu2 lys2 ura3 ∆stt3::kanMX4 [pRS316-STT3]) was selected on a - Met-Ura+G418+alpha-aminoadipate plate (G418 and alpha-aminoadipate, Sigma) (Fig.
4A). The mating type was determined using Yeast Reference strains, W303-1A MATa and W303-1B MAT alpha.
2.3.3 Plasmid shuffling
In vivo mutagenesis studies of the individual subunits of the yeast OST have been performed using the spotting plate assay. Switching from the wild-type OST to the mutated OST in cells is accomplished by the plasmid shuffling method 39,40 or the
genes in yeast (Fig. 4B) 42. Plasmid shuffling shows the importance of motifs introduced with mutations by yeast cell growth.
Figure 4. Acquisition of STT3 knockout strain and plasmid shuffling procedure.
pRS316-STT3 was transformed into Yeast Hetero-Diploid Knock Out Strain YGL022W. STT3/stt3Δ heterozygotes were sporulated to obtain the stt3 knockout haploid. pSTT3 (X) was transformed into stt3∆-pSTT3 strain, followed by 5-FOA selection was performed to drop pRS316-STT3. Yeast can grow if the STT3 mutant can complement the function of STT3. If not complementary, yeast cannot grow.
plasmid shuffling and spotting plate assay
stt3∆ cells bearing pRS316-STT3 encoding the wild-type stt3 were transformed with p(RS313-)STT3(X), encoding the stt3 gene containing a single-point mutation X. The transformants were grown in SD medium lacking L-histidine until the OD600 reached 1.
Collected cells were diluted in a 5-fold series. Aliquots (3 µL) of each dilution were spotted onto SD plates lacking L-histidine and those lacking L-histidine supplemented with 5-FOA, at a final concentration of 1 mg mL-1. After incubations at 25, 30, and 37°C for 2 days, cell growth was assessed.
I defined the growth phenotypes as follows, lethal means no growth in any temperatures, normal means the same growth as wild-type STT3, and the others
classified the temperature-sensitive (Fig. 5). 1st DXD motif E45A mutation is temperature-sensitive, D47A mutation is lethal (Fig. 5A). 2nd DXD motif D166A mutation is lethal, E168A mutation is temperature-sensitive. The D583A mutation of DXXKXXXM motif was lethal, the K586A mutation was temperature-sensitive, and the M590A mutation was normal (Fig. 5B). Because the K586A mutation was
previously reported as lethal 39,41, I changed to another amino acid and re-experimented to Lys586 residue. K586A, L, R, S mutations were temperature-sensitive, K586H
mutation was normal (Fig. 5C). In previous reports, the K586A and K586R mutations were lethal, both were temperature-sensitive in this experiment. In a previous study, a 3×HA tag was added to the C-terminus of STT3, and I suspect that it affected growth.
Chromosomal mutations in the STT3 locus (K586A) experiment resulted in a temperature-sensitive phenotype 35.
Figure 5. Spotting plate assay of yeast strains expressing mutated Stt3 subunits.
The yeast strains, stt3∆-pRS316-STT3(WT)+p(RS313-)STT3(X), where X denotes a mutation, were spotted on -His + 5-FOA plates. The growth of the colonies at three different temperatures was compared after 2 days 30,37˚C and 3 days 25˚C. 't.s.' stands
for temperature-sensitive. The OST complex expressed in the cells was the mixed type of Ost3 and Ost6.
2.4 Purification of OST complex for studies
The spotting plate assay is quite easy to execute, but its outcome is rather limited: a mutation is just classified into lethal, temperature-sensitive, or normal (i.e., non- conditional) growth phenotypes. Moreover, the different properties of the two OST complexes containing Ost3 or Ost6 in vivo could complicate the interpretation of the results obtained by the spotting plate assays.
In some situations, enzymological studies using purified proteins with a defined subunit composition are preferred. However, the reconstitution of the OST complex in vitro using recombinant proteins has not been successful. Fortunately, the genetic manipulation of the yeast genome is straightforward. Previously, the 3×HA
(hemagglutinin) epitope tag encoding sequence was inserted at the 3′-ends of the stt3 and ost3 genes in the yeast genome, for immunopurification of the OST complexes and immunodetection of other subunits 40,43. The tandem IgG-binding domain encoding sequence of Protein A was added to the 3′-end of the stt3 gene in the yeast genome for the same purpose 44. Subsequently, other types of epitope tag sequences (FLAG, 3×FLAG, and 1D4) were incorporated into the 3′-end of the ost4 gene in the yeast genome, and the tagged OST complexes were affinity purified to homogeneity for enzymatic investigation 11 and cryo-EM single-particle analyses 34,35,45.
In the case of conditional mutations, the isolation of OST complexes containing such mutant proteins is possible, provided that the yeast strain can grow under permissive conditions. Yeast strains carrying the stt3-4 and stt3-6 (G520D), stt3-5 (G520S), and stt3-7 (S552P) alleles have temperature-sensitive phenotypes 44. These strains were grown at the permissive temperature of 23°C, and the membrane fractions were prepared. In the membrane fractions, the OST complexes with these mutants showed very low oligosaccharyl transfer activities 44. In contrast, the introduction of lethal or very severe temperature-sensitive mutations into the Stt3 subunit is rather difficult, as the co-expression of the wild-type Stt3 subunit is necessary for cell culture.
In this study, I fused a new epitope tag (PA tag) to the 3'-end of the ost4 genes in the genome DNA or 5′-end of the stt3 genes in expression plasmids.
2.4.1 Effect of PA tag to STT3 protein on yeast growth
First of all, I confirmed that the addition of the PA tag to the STT3 subunit protein did not affect the growth of yeast by plasmid shuffling. I selected four mutants from
previously reported growth phenotypes, R159A as temperature-sensitive, E350A, W517A, and D518A as lethal 35,40,46.
plasmid construction
The pPA-STT3 plasmid was constructed with a Gibson Assembly kit (NEB). The open reading frame of the stt3 gene was amplified using genomic DNA from the yeast strain BY4741 as the PCR template. For the construction of pPA-STT3, the GPD promoter, the yeast Stt3 sequence, and the CYC1 terminator were assembled into pRS313. The GPD promoter and the CYC1 terminator were derived from pAG416-GPD-ccdB as the PCR template. pAG416GPD-ccdB was a gift from Susan Lindquist (Addgene plasmid # 14148; http://n2t.net/addgene:14148; RRID:Addgene_14148). Then, the DNA
sequences corresponding to the PA tag, GVAMPGAEDDVV, and the spacer sequence, (GGGGS)2, were inserted between the GPD promoter and the Stt3 sequence (Fig. 6A).
An inverse PCR-based site-directed mutagenesis kit (SMK-101, TOYOBO) was used to generate single-point mutations to generate pPA-STT3(X).
plasmid shuffling and spotting plate assay
Stt3∆ cells bearing pRS316-STT3 encoding the wild-type stt3 were transformed with pPA-STT3(X), encoding the stt3 gene containing a single-point mutation X. The transformants were grown in SD medium lacking L-histidine until the OD600 reached 1.
Collected cells were diluted in a 5-fold series. Aliquots (3 µL) of each dilution were spotted onto SD plates lacking L-histidine and those lacking L-histidine supplemented with 5-FOA, at a final concentration of 1 mg mL-1. After incubations at 25, 30, and 37°C, cell growth was assessed.
The WT phenotype did not change with the addition of the PA tag to the STT3 protein (Fig. 6B). As reported for mutants, R159A was temperature-sensitive and E350A, W517A, D518A were lethal 35,40,46. I decided that STT3 expressed with the addition of the PA tag did not significantly change the properties of OST function, and proceeded to the next experiments.
2.4.2 Purification of OST complex including Stt3 subunit protein expressed by plasmid
In vitro analysis required the mutated OST protein in addition to WT OST protein.
Next, I tried to purify the OST complex from the yeast transformed a plasmid to verify if it was possible to purify WT, temperature-sensitive, and lethal mutants of STT3 proteins.
yeast strain
PCR-based methods were used to disrupt of yeast ost6 gene, replacing ost6 to LEU2.
Correct gene knockout was confirmed by PCR and DNA sequencing. The pOST3 plasmids were constructed with a Gibson Assembly kit (NEB). The open reading frames of the ost3, the gene was amplified using genomic DNA from the yeast strain BY4741 as the PCR template. For the construction of pOST3, the DNA sequence encoding Ost3 was inserted into the multiple cloning site of pAG416-GPD-ccdB.
affinity purification of the yeast OST complex bearing the PA tag
The OST complex was purified from yeast strains as previously described, with modifications 34. Yeast cells transformed with pPA-STT3(X) were grown in SD media lacking appropriate nutrients (-Ura and -His). Recovered yeast cells were lysed with glass beads, and microsome fractions were collected by ultracentrifugation at 100,000 × g. The membrane pellets were resuspended and dissolved in 20 mM Tris-HCl buffer, pH 7.5, 1.5% digitonin, 0.5 M NaCl, 1 mM MgCl2, 1 mM MnCl2, 1 mM EDTA, 1 mM phenylmethylsulfonyl fluoride, protease inhibitor cocktail (Roche), and 10% (v/v) glycerol. After 1 h incubation, the mixture was ultracentrifuged for 30 min at 100,000 × g, and the clarified supernatant was mixed with pre-washed anti-PA tag antibody beads (Fujifilm Wako Pure Chemicals) at 4°C overnight with gentle shaking. The affinity beads were collected by centrifugation and washed five times with 20 mM Tris-HCl buffer, pH 7.5, 0.1% digitonin, 150 mM NaCl, 1 mM MgCl2, and 1 mM MnCl2. Finally, the OST complex was eluted with the same buffer containing 0.1 mg mL-1 PA-tag peptide (Fujifilm Wako Pure Chemicals).
Affinity purification of the OST complexes containing mutations in the Stt3 subunit.
The PA epitope tag sequence was inserted into the region encoding the N-terminus of
the Stt3 subunit via a 10-residue spacer sequence. The tagged Stt3 protein was expressed under the control of the constitutive GPD (glyceraldehyde 3-phosphate dehydrogenase) promoter from the expression plasmid, pPA-STT3. An Ost6-knockout strain (ost6∆) was used as the host to prepare the Ost3-containing OST complex (referred to as OST[Ost3]). Deleterious effects caused by the absence of Ost6 were compensated by the extra expression of Ost3 from the pOST3 plasmid 35,47. The purified samples contained bands corresponding to the subunits of STT3, OST1, WBP1, OST3, SWP1, and OST2, respectively (Fig. 6C). I confirmed that the OST complex can be purified by this method in temperature-sensitive and lethal mutants as well as in WT STT3.
Figure 6. Effect on the cell growth and protein purification by point mutations of Stt3 subunit protein expressed by the plasmid.
A. Schematic representation of the gene construction for expression of the PA tag- fused Stt3 protein. The PA tag sequence, GVAMPGAEDDVV, is inserted at the N- terminus of the Stt3 protein via a 10-residue spacer sequence, (GGGGS)2. Transcription is controlled by the GPD promoter and the CYC1 terminator. B. The yeast strains, stt3∆-pRS316-STT3(WT)+pPA-STT3(X), where X denotes a mutation, were spotted on -His + 5-FOA plates. The growth of the colonies at three different temperatures was compared after 2 days 30 and 3 days 25˚C. 't.s.' stands for temperature-sensitive. The OST complex expressed in the cells was the mixed type of Ost3 and Ost6. C. CBB- stained gel image of the purified OST proteins. The triangles indicate the three bands corresponding to the non-, mono-, and diglycosylated forms of the Wbp1 subunit.
2.5 Check contamination of the yeast OST preparation
The epitope tag has a high affinity to a specific antibody and enables the preparation of the OST complex containing STT3 expressed by plasmid free from the native OST complex. I must confirm that the OST preparation with the mutated Stt3 subunit is not contaminated with the native OST complex containing the wild-type Stt3 subunit.
Preparation of FLAGstt3 yeast strain
The PCR-based method was used to create fusion to epitope tags (FLAGstt3). PCR fragments that contain the DNA sequences corresponding to the FLAG tag and the spacer sequence, (GGGGS)2, were inserted before the Stt3 sequence, and a selectable marker HygMX was integrated into the yeast genome DNA by homologous
recombination and selected strain based on antibiotic resistance. HygMX sequence was derived from pFA6a-6xGLY-3xFLAG-hphMX4 as the PCR template. pFA6a-6xGLY- 3xFLAG-hphMX4 was a gift from Mark Hochstrasser (Addgene plasmid # 20755 ; http://n2t.net/addgene:20755 ; RRID:Addgene_20755) 48. Correct insertion was
confirmed by PCR and DNA sequencing. The N-terminal amino acid sequence fused to Stt3 is DYKDDDDK-(GGGGS)2 (the FLAG epitope tag sequence followed by spacer sequence).
affinity purification of the yeast OST complex
Yeast cells (ost6∆-FLAGstt3-pOST3) transformed with pPA-STT3(WT) were grown in SD media lacking appropriate nutrients (-Ura and -His). The materials containing FLAG-Stt3(WT) were immunoprecipitated from yeast cells expressing the
chromosomal stt3 gene using anti-FLAG affinity gel (A2220 Millipore). The materials absorbed were eluted with the SDS sample buffer. Separately, the OST complex containing PA-Stt3(WT) expressed from the plasmid was immunopurified from the same yeast cells as described above (chapter 2.4.1). The collected materials were separated on SDS-PAGE using gradient gels (10–20%).The proteins in the gels were transferred to Immobilon-P PVDF membranes (Millipore), probed with the indicated antibodies, and visualized by chemiluminescence with the SuperSignal West Femto Maximum Sensitivity Substrate (ThermoFisher). The anti-FLAG antibody(PM020 MBL) and anti-STT3 antiserum 39 were used at dilutions of 1:5000 and 1:1000, respectively. The peroxidase-conjugated anti-rabbit IgG antibody (NA934VS
Amersham ECL) was used at a dilution of 1:12500. The chemiluminescent images were recorded with an LAS-3000 multicolor image analyzer (Fuji Photo Film).
I checked the incorporation of the wild-type Stt3 protein expressed from the
chromosome into the OST sample preparations, considering the oligomeric interactions between the OST molecules 45. I created a strain carrying an stt3 gene in the
chromosome with a FLAG epitope tag encoding sequence. The immunoprecipitated materials with the anti-FLAG antibody (FLAG-IP) and those with the anti-PA antibody (PA-IP) were analyzed by western blotting (Fig. 7). As a positive control experiment, the FLAG-IP sample was analyzed with the anti-FLAG antibody, indicating the presence of a single band (Fig. 7, lane 1). In contrast, the PA-IP sample contained no detectable bands with the anti-FLAG antibody (lane 2), even though much larger amounts of the OST complex protein were loaded to the lanes of PA-IP (lanes 2 and 4) than those of FLAG-IP (lanes 1 and 3). I concluded that the genome-derived Stt3 was virtually absent in the OST preparations purified with the PA-epitope tag.
Figure 7. Check wild-type Stt3 incorporation into the OST preparation.
Immunoprecipitated samples with the anti-FLAG tag antibody (FLAG-IP) and the anti-PA tag antibody (PA-IP) were analyzed by western blotting. The wild-type Stt3 expressed from the chromosome was detected with the anti-FLAG antibody (left). The amounts of the Stt3 protein in the same sample volumes were measured with an anti- STT3 antibody (right).
2.6 In vitro assay
An in vitro experimental system was established to study the oligosaccharyl transfer and the FNG generation activity in purified OST (Fig. 8). Time course was measured using NVT9-tam as substrate peptide used previously in oligosaccharyl transfer activity experiments 49. FNG generation activity was quantified by reacting with LLO in the absence of substrate peptide and then labeling the generated FNGs with 2-AP.
Figure 8. Scheme of in vitro assays.
Fluorescently labeled peptides were mixed with detergent-solubilized OST complex and LLOs for oligosaccharyl transfer reaction. After the reaction, N-glycosylated peptides were detected and quantified by UPLC equipment. Detergent-solubilized OST complex and LLOs were incubated without peptide for FNG generation. After the reaction, FNGs were labeled by 2-AP. 2-AP labeled oligosaccharides were detected and quantified by UPLC equipment.
extraction of LLO for in vitro assays
The yeast cells, strain BY4741, were grown in a 3-L flask containing 1-L synthetic complete medium at 30°C until the OD600 reached 10. Cells were collected and used for the extraction of LLO, as described previously 50. To determine the amount of LLO, I used the endpoint assay and acid-hydrolysis methods. The endpoint assay measures the maximum amount of the N-glycosylated peptide produced by OST in the presence of an excess of the peptide substrate. The acid hydrolysis method measures the
oligosaccharide released from LLO by acid hydrolysis. The LLO was hydrolyzed using 20 mM hydrochloride in a 2-propanol-water mixture (1:1, v/v) at 100°C for 30 min.
After evaporation to dryness, the pellet was labeled with 2-AP (see below). The
pyridylaminated oligosaccharides were separated by Infinity 1290 UPLC (Agilent) with an AdvanceBio Glycan Mapping column (Agilent) and quantified by an in-line
fluorescence detector. Solvent A was 100 mM ammonium acetate buffer, pH 4.5, and solvent B was 100% acetonitrile. The column was equilibrated with 20% solvent A at a flow rate of 0.5 ml min-1. A linear gradient of solvent A was applied from 20 to 40%
over 8.5 min. Typically, 10-20 nmol of LLO was obtained from 10 grams of wet yeast
pyridylamination of FNG
The reducing end of the oligosaccharides was derivatized with 2-aminopyridine (AP) as described previously, with some modifications 18. The dried oligosaccharides were incubated with 20 µL of 2-AP in acetic acid at 80°C for 1 h. After the reaction, the mixture was incubated with 20 µL of dimethylamine borane reagent in acetic acid at 80°C for 30 min. The excess 2-AP was removed using a MonoFas silica gel spin column (GL Sciences). The spin column was washed with water and then
preequilibrated twice with 800 µL of 100% acetonitrile before use. The sample solution was mixed with 460 µL of 100% acetonitrile and loaded onto the spin column. The column was washed twice with 800 µL of 95% (v/v) acetonitrile. Water was added to the column to elute the fluorescently labeled oligosaccharides.
2.6.1 Oligosaccharyl transfer assay
The oligosaccharyl transfer assay was performed using the fluorescent peptide
substrate method 51,52. The reaction mixture (total 10 µL) contained 1 µM yeast LLO, 1 µM substrate peptide, and 1 – 5 nM purified OST protein, in 20 mM Tris-HCl buffer, pH 7.5, 5 mM MnCl2, 5 mM MgCl2, and 0.1% (v/v) Triton X-100. The substrate peptides were labeled with a fluorescent dye, 5(6)-carboxytetramethylrhodamine
(TAMRA) for detection (Table 4). The reaction mixture was incubated for the indicated time at 30°C. The reaction was stopped by the addition of 2 µL of 60 mM EDTA- NaOH, pH 8.0. The reaction products were separated by Infinity 1290 UPLC (Agilent) with an AdvanceBio Glycan Mapping column and quantified by an in-line fluorescence detector. Solvent A was 100 mM ammonium acetate buffer, pH 4.5, and solvent B was 100% acetonitrile. The column was equilibrated with 20% solvent A at a flow rate of 0.5 ml min-1. A linear gradient of solvent A was applied from 20 to 41.5% over 16 min.
Table 4. Information of substrate peptide used in this section
Peptide name Amino acid sequencea Preparative method
NVT9-tam Ac-AAYNVTKRK(TAMRA) -COOH Chemical
synthesisb
aThe N-glycosylation sequon is underlined. TAMRA and tam denote the fluorescent dye, 5(6)-carboxytetramethylrhodamine. The peptide concentrations were determined by the absorbance at 555 nm, with an extinction coefficient of 90,000 M-1 cm-1. The N-
terminal α-amino group is modified with an acetyl group (Ac-). The C-terminal α- carboxyl group is unmodified (-COOH).
bTAMRA is attached to the side-chain ε-amino group of the C-terminal lysine residue.
Oligosaccharyl transfer activity was measured in vitro using purified OST (Fig. 9).
The peak was recovered and measured by MALDI-TOF-MS, and the observed MS was consistent with a 14-residue oligosaccharide chain-added peptide. The amounts of N- glycosylated peptide increased over time and reacted linearly up to 60 minutes.
Figure 9. UPLC chromatograms for the oligosaccharyl transfer assay of the purified OST complexes and mass spectrum (MALDI-TOF) of N-glycosylated NVT9-tam peptides.
A. The original chromatogram data. B. The amounts of N-glycosylated NVT9-tam peptides generated by the OST protein were plotted versus reaction time each 0, 15, 30, 45, and 60 minutes. Triplicate measurements were performed for each time point. The straight line showed the approximate straight line generated from the plots. C. Observed molecular mass (m/z) was shown on the peak. The observed molecular mass was in good agreement with the calculated theoretical molecular mass of Glc3Man9GlcNAc2 - NVT9tam = 3854.54.
2.6.2 FNG generation assay
The purified OST complex was incubated with 1 µM LLO for indicated time at 30°C in a 100 µL reaction solution, containing 20 mM Tris-HCl, pH 7.5, 5 mM MnCl2, 5 mM MgCl2, and 0.1% (v/v) Triton X-100. The incubation time was longer (24 h) than that for the oligosaccharyl transfer assay (1 h) to compensate for the low hydrolytic activity.
The reaction was terminated by the addition of 1 µL of 0.5 M EDTA-NaOH, pH 8.0. A 300 µL aliquot of ethanol was added, and the reaction solution was incubated for 15 min at 4°C. After centrifugation at 15,000 × g for 15 min, the supernatant was
evaporated to dryness. The resultant pellet was labeled with 2-AP. The pyridylaminated oligosaccharides were separated by Infinity 1290 UPLC with an AdvanceBio Glycan Mapping column and quantified by an in-line fluorescence detector. Solvent A was 100 mM ammonium acetate buffer, pH 4.5, and solvent B was 100% acetonitrile. The
column was equilibrated with 20% solvent A at a flow rate of 0.5 ml min-1. A linear gradient of solvent A was applied from 20 to 40% over 14 min.
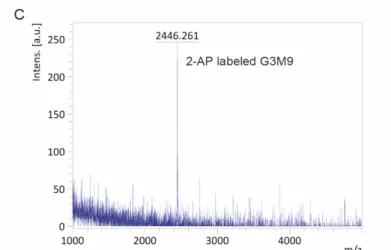
The FNG-generating activity was measured in vitro using purified OST (Fig. 10). The peak was recovered and measured by MALDI-TOF-MS, and the observed MS was consistent with the addition of 2-AP to the 14 sugar. FNG increases in the test tube over time and reacted linearly up to 28 hours, indicated that the OST complex had not
denatured or inactivated during 28 hours.
Figure 10. UPLC chromatograms for the FNG generation assay of the purified OST complexes and mass spectrum (MALDI-TOF) of 2-AP labeled G3M9GlcNac2 oligosaccharide.
A. The original chromatogram data. B. the amount of FNGs generated by the OST protein were plotted versus reaction time each 4, 8, 24, and 28 hours. The straight line showed the approximate straight line generated from the plots. Mass spectrum
(MALDI-TOF) of 2-AP labeled oligosaccharide. C. Observed molecular mass (m/z) was shown on the peak. The observed molecular mass was in good agreement with the calculated theoretical molecular mass of 2-AP labeled Glc3Man9GlcNAc2
oligosaccharide = 2447.87.
2.7 Preparation of peptide substrate
Previous studies have used peptides with less than 10 residues due to their simplicity of synthesis and detection 11,35. However, it is not known how OST interacts with the substrate peptide to place the sequon at the active center. Therefore, a developed assay is required using a peptide having a sufficient length, which is closer to the reaction in vivo. In this section, peptides were prepared by expressing substrate peptides as a glutathione S-transferase (GST)-fusion protein and after cleavage with proteases.
Peptides were labeled with thiol-reactive TAMRA-maleimide fluorophore.
expression and purification
OST substrate peptides were expressed as a GST-fusion protein using the pGEX-6P-1 vector (GE Healthcare) as a template, pGEX6p-GST-C-NVT(X). X indicates the total number of amino acids in the peptide to be prepared. The transformed Escherichia coli
strain BL21(DE3) cells were grown using the ZYM-5052 medium at 30°C for 24 hours
53. The cells were harvested by centrifugation at 5,000 × g at 4°C for 10 min and resuspended in 20 mM Tris-HCl, pH 8.0, containing 300 mM NaCl, 5 mM 1,4- dithiothreitol (DTT), and 10% (v/v) glycerol (buffer A). After disruption by sonication and centrifugation at 7,500 × g at 4°C for 10 min, the supernatant was centrifuged 50,000
× g at 4°C for 30 min. The supernatant loaded onto a Glutathione Sepharose 4B (GE Healthcare) column equilibrated with buffer A. The column was then washed with buffer A. After cleavage with 3C protease on the column overnight, the protein was eluted with buffer A.
The eluted materials were loaded on a COSMOSIL 5C18-AR-II reverse phase column (Nacalai Tesque, Kyoto, Japan) in trifluoroacetic acid (TFA) and acetonitrile. Solvent A was 0.1% (v:v) TFA, and Solvent B was 80% (v:v) acetonitrile, 0.1% (v:v) TFA. A linear gradient of solvent B was applied from 20% B to 60% B. The peaks were collected and dried in a SpeedVac concentrator (Thermo Savant).
Dry up samples were dissolved in water. The alpha-cyano-4-hydroxycinnamic acid was used as the matrix and dissolved at 10 mg/ml in 80% (v:v) acetonitrile, 0.1% (v:v) TFA. Equal volumes (0.5 µl each) of the sample and the matrix solution were mixed on a target plate and dried. MS spectra were acquired in the positive ion reflection mode, using a MALDI-TOF-mass spectrometer Autoflex (Bruker) for C-NVT-8 and C-NVT- 18, and C-NVT28.
A fluorophore, carboxytetramethylrhodamine (TAMRA), was attached to the thiol group of the cysteine residue. Each peptide was dissolved in 100 mM HEPES buffer, pH 7.5. 10 mM 5,6-TAMRA-maleimide solution in dimethyl sulfoxide was added, and the solution was incubated overnight at room temperature. Modified peptides were purified by a COSMOSIL 5C18-AR-II reversed-phase column. The peak was collected, dried, and re-dissolved in water (Table 5). The concentration of the peptides was
determined by the absorbance at 555 nm, with an extinction coefficient of 90,000 M−1 cm−1.
Table 5. Information of substrate peptides used in this section
Peptide name Amino acid sequencea Preparative method C(tam)-NVT8 NH2-GPC(TAMRA)-YNVTK-COOH Protein expression
and chemical modificationb C(tam)-NVT9 NH2-GPC(TAMRA)-SYNVTK-COOH Protein expression
and chemical modificationb C(tam)-NVT18 NH2GPC(TAMRA)
GAGGSYNVTKGAGGS-COOH
Protein expression and chemical modificationb C(tam)-NVT28 NH2-GPC(TAMRA)-
GAGGSGAGGSYNVTKGAGGSGAGGS- COOH
Protein expression and chemical modificationb
aThe N-glycosylation sequon is underlined. TAMRA and tam denote the fluorescent dye, 5(6)-carboxytetramethylrhodamine. The peptide concentrations were determined by the absorbance at 555 nm, with an extinction coefficient of 90,000 M-1 cm-1. The N- terminal α-amino group is unmodified (NH2-). The C-terminal α-carboxyl group is unmodified (-COOH).
bTAMRA is attached to the side-chain sulfhydryl group of the cysteine residue via the thiol-maleimide reaction.
oligosaccharyl transfer assay
The oligosaccharyl transfer assay was performed the same as described above (chapter 2.6.1).
The peptide expressed as a GST-fusion protein was further purified on a reverse-phase column. The fraction was measured the mass spectrum by MALDI-TOF-MS, which was almost the same as the theoretical molecular weight. The peptide was labeled with TAMRA-maleimide and used as a substrate peptide for oligosaccharide transfer activity. Oligosaccharyl transfer reaction was confirmed with all the prepared peptides (Fig. 11).
Figure 11. Mass spectra (MALDI-TOF) of HPLC purified peptides and the effects of the acceptor peptide on the enzymatic activities.
A. Observed molecular mass (m/z) was shown on the peak. The observed molecular mass was in good agreement with the theoretical molecular mass of each peptide C- NVT8 = 881.01, C-NVT18 = 1539.64, and C-NVT28 = 2198.20. B. In vitro
oligosaccharyl transfer activities of the OST complexes using each peptide as acceptor.
The activities of OST[Ost3, Ost4-PA] using C(tam)-NVT8 were set to 1. Open circles indicated the measurement of each trial. The bar heights indicate the mean values of duplicate measurements.
2.8 Effect of tag position
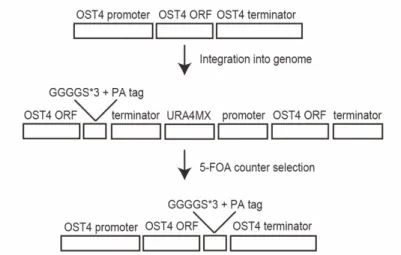
I need to make sure that the position of the tag does not change the substrate specificity for the peptide. Markerless strain ost4PA was prepared by a two-step method, plasmid integration followed by counter selection using 5-fluoroorotic acid 54. The C-terminal amino acid sequence fused to Ost4 is (GGGGS)3-GVAMPGAEDDVV (spacer sequence followed by the PA epitope) (Fig. 12).
creating ost4PA strain
The OST4 regions of pFA6a-OST4-PA-URA4MX6 are containing the entire ost4 gene followed by GGGGS×3 linker and PA tag encoding sequence plus 250 bp (native promoter) and 250 bp (native terminator) at the 5' and 3' ends, respectively. URA4MX6 sequence was derived from pFA6a-ura4MX6 as the PCR template. pFA6a-ura4MX6 was a gift from Eishi Noguchi (Addgene plasmid # 49184 ;
http://n2t.net/addgene:49184 ; RRID:Addgene_49184) 55. pFA6a-OST4-PA-
URA4MX6 was digested with the Xho1 restriction enzyme and the purified fragments were integrated into the yeast genome. Correct integration was confirmed by PCR and DNA sequencing. For the selection of yeast strain ost4PA, a fresh colony of pFA6a- OST4-PA-URA4MX6 integrated yeast strain was inoculated on a synthetic complete medium containing 5-FOA. Correct PA tag integration was confirmed by PCR and DNA sequencing.
The pOST6 plasmid was constructed with a Gibson Assembly kit (NEB). The open reading frame of the ost6 gene was amplified using genomic DNA from the yeast strain BY4741 as the PCR template. For the construction of pOST6, the DNA sequence encoding Ost6 was inserted into the multiple cloning site of pAG416-GPD-ccdB.
Figure 12. Integration of the PA tag encoding sequence into the yeast genome at OST4 gene locus.
The genomic ost4 gene was C-terminally tagged with the PA epitope by two-step markerless gene replacement. pFA6a-OST4-PA-URA4MX6 plasmid integrated into the yeast genome. Target strain was selected by counter selection using 5-FOA, induced homologous recombination.
In addition to the OST complexes with the PA tag added to the Stt3 subunit, I prepared the OST complexes with the PA tag in the Ost4 subunit (Fig. 13). The tag was inserted at the region encoding the C-terminus of the ost4 gene in the genome via a 15-residue spacer, (GGGGS)3. To prepare the yeast OST complexes containing the Ost3 subunit alone, the ost6∆ knockout strain was used. The resulting strain and OST complex are referred to as ost6∆-ost4PA-pOST3 and OST[Ost3, Ost4-PA], respectively. The extra expression of Ost3 from the pOST3 plasmid reduces the deleterious effects caused by the absence of Ost6. In the same manner, I constructed the strain ost3∆-ost4PA-pOST6 and purified the OST[Ost6, Ost4-PA] complex. As for the Ost3-containing OST complex, two constructs bearing the PA tag in different subunits are available. I assessed the influence of the tag position.
quantification of OST protein amounts
OST[Ost3, PA-STT3], [Ost3, Ost4-PA], and [Ost6, Ost4-PA] proteins were purified the same as described above (chapter 2.4.1). The eluted fractions were separated by SDS-PAGE using gradient gels (10–20%). Fluorescence measurement after western
gels were transferred to Immobilon-FL PVDF membranes (Millipore). Anti-Wbp1 antiserum 39 was used as the primary antibody at a dilution of 1:5,000, and IRDye- labeled goat anti-rabbit IgG (LI-COR) was used as the secondary antibody at a dilution of 1:25,000. The fluorescence of the IRDye was measured by an Odyssey (LI-COR) imaging system.
oligosaccharyl transfer assay
The oligosaccharyl transfer assay was performed the same as described above with slight modification. The reaction mixture (total 10 µL) contained 1 µM yeast LLO, 5 µM substrate peptide, and 1 – 5 nM purified OST protein, in 20 mM Tris-HCl buffer, pH 7.5, 5 mM MnCl2, 5 mM MgCl2, and 0.1% (v/v) Triton X-100. The reaction mixture was incubated for 1 h at 30°C. A linear gradient of solvent A was applied from 25 to 57% over 8.5 min.
Figure 13. CBB-stained gel image of the purified OST proteins and the result of quantitative Western blotting.
A. The triangles indicate the three bands corresponding to the non-, mono-, and diglycosylated forms of the Wbp1 subunit. B. The relative amounts of the OST complexes were estimated by fluorescent Western blotting of the Wbp1 subunit and used to normalize the activities. The yield of the OST complex containing the WT Stt3 subunit with the PA tag is set to 1. Open circles indicated the measurement of each trial.
The bars indicate the mean values of triplicate measurements.
Comparison of peptide substrates in the in vitro oligosaccharyl transfer assay. The OST[Ost3, PA-Stt3] and OST[Ost3, Ost4-PA] complexes had the same specific activities for the oligosaccharyl transfer activity with the four different peptides substrates, indicating the negligible effects of the insertion and position of the PA tag (Fig. 14). Additionally, the growth rates of the cells expressing the PA-tagged Ost4 and the PA-tagged Stt3 were the same as that of the wild-type cells. These results indicate that the added PA tag has no detectable harmful effects, and the PA-tagged Ost4 and Stt3 proteins are fully functional in vitro and in vivo.
Table 6. Information of substrate peptides used in this section
Peptide name Amino acid sequencea Preparative method
NVT9-tam Ac-AAYNVTKRK(TAMRA) -COOH Chemical
synthesisb
tam-NVT9 (TAMRA)-GAYNVTAKR-COOH Chemical synthesis
tam-NVT15 (TAMRA)-GAGGSYNVTKGAGGS-
CONH2
Chemical synthesis Reference 51
C(tam)-NVT28 NH2-GPC(TAMRA)-
GAGGSGAGGSYNVTKGAGGSGAGGS- COOH
Protein expression and chemical modificationc
aThe N-glycosylation sequon is underlined. TAMRA and tam denote the fluorescent dye, 5(6)-carboxytetramethylrhodamine. The peptide concentrations were determined by the absorbance at 555 nm, with an extinction coefficient of 90,000 M-1 cm-1. The N- terminal α-amino group is either unmodified (NH2-), modified with an acetyl group (Ac-), or modified with the TAMRA group (TAMRA-). The C-terminal α-carboxyl group is either unmodified (-COOH) or modified with an amide group (-CONH2).
bTAMRA is attached to the side-chain ε-amino group of the C-terminal lysine residue.
cTAMRA is attached to the side-chain sulfhydryl group of the cysteine residue via the thiol-maleimide reaction.
Figure 14. Effects of the epitope tag position on the oligosaccharyl transfer activity.
The PA tag was attached to either the N-terminus of the Stt3 subunit (PA-STT3) or the C-terminus of the Ost4 subunit (Ost4-PA). The two OST complexes contain the Ost3 subunit alone. The four peptides in Table 6 were used as acceptor peptide substrates.
The relative amounts of the PA-tagged OST complexes were estimated by fluorescent western blotting of the Wbp1 subunit (Fig. 13) and used to normalize the activities. The activities of the OST with the tag in Stt3 were set to 1. Open circles indicated the measurement of each trial. The bar heights indicate the mean values of triplicate
measurements. For statistical analysis, Welch's t-test was applied for each peptide, but no significant differences were detected (p=0.44, 0.14, 0.26, and 0.073).
2.9 Kinetic parameters for peptide substrates
Enzymatic parameters were determined for the peptides used above section (Table 6).
The oligosaccharyl transfer activities of the purified OST complexes were measured with LLO prepared from yeast cells as the oligosaccharide donor, and various peptides containing the sequon Asn-Val-Thr as the oligosaccharide acceptor. The glycopeptide products were separated by normal-phase UPLC and quantified with in-line
fluorescence detection of the TAMRA dye attached to the peptide substrates. I designed four peptide substrates for the selection of a peptide substrate suitable for the
oligosaccharyl transfer assay (Table 6). Kinetic parameters were determined using the OST[Ost3, PA-Stt3(WT)] complex. There were few differences in the maximal velocity Vm, whereas considerable variations in the Michaelis-Menten constant Km were
observed (Fig. 15, Table 7). The 15-residue peptide substrate, tam-NVT15, had the smallest Km value, indicating the highest affinity for the OST[Ost3].
oligosaccharyl transfer assay
The oligosaccharyl transfer assay was performed the same as described above with slight modification. The reaction mixture (total 10 µL) contained 2 µM yeast LLO, 0.4 to 40 µM substrate peptide, and purified wild-type OST protein, in 20 mM Tris-HCl buffer, pH 7.5, 5 mM MnCl2, 5 mM MgCl2, and 0.1% (v/v) Triton X-100. The reaction mixture was incubated for 1 h at 30°C. A linear gradient of solvent A was applied from 25 to 57% over 8.5 min. Kinetic parameters for peptide substrates were determined by nonlinear least-squares fitting of the initial rates in the presence of 2 µM LLO to the Michaelis-Menten equation, using the program Kaleidagraph version 4.5.1 (Synergy Software).
Figure 15. Kinetic parameter determinations with four different peptide substrates.
The peptide sequences are listed in Table 6. The initial rate of the oligosaccharyl transfer reaction (V0) was plotted as a function of the peptide concentration. The maximum velocities (Vm) and substrate affinities (Km) were derived by nonlinear regression to the Michaelis-Menten model (continuous lines). The kinetic constants are presented as best-fitted values with the standard errors in Table 7.
Table 7. Enzyme kinetic parameters of the oligosaccharyl transfer reactiona of the yeast OST complexb for various peptide substrates
peptide Km (µM) Vm (fmol min-1)
NVT9-tam 4.9 ± 0.3 2.9 ± 0.04
tam-NVT9 8.8 ± 1.3 4.1 ± 0.19
tam-NVT15 1.6 ± 0.2 3.3 ± 0.09
C(tam)-NVT28 3.8 ± 0.3 3.5 ± 0.06
aIn the presence of 2 µM LLO.
bOST[Ost3, PA-Stt3(WT)].