微粒子誘電泳動を利用したDNA 検出法
丁, 震昊
http://hdl.handle.net/2324/2236264
出版情報:Kyushu University, 2018, 博士(工学), 課程博士 バージョン:
権利関係:
DNA Detection Methods Based on Microbeads Dielectrophoresis
微粒子誘電泳動を利用した DNA 検出法
Zhenhao Ding
Graduate School of Information Science and Electrical Engineering
Kyushu University
2019
Contents
Chapter 1 ... 1
Introduction ... 1
1.1 Research background ... 1
1.2 Present methods of bacterial detection ... 2
1.2.1 Measurement of viable bacteria by culture ... 2
1.2.2 Rapid bacterial detection method ... 3
1.2.3 Performance required for bacterial detection method ... 5
1.3 Bacterial detection by combining PCR with dielectrophoresis based DNA detection .... 6
1.4 Structure of this paper ... 7
Chapter 2 ... 10
Theory ... 10
2.1 Introduction ... 10
2.2 Dielectrophoresis ... 10
2.2.1 Dielectrophoretic force acting on dielectric particles ... 11
2.2.2 Travelling wave dielectrophoresis ... 13
2.2.3 Summary ... 14
2.3 Measurement principle of DEPIM method ... 15
2.3.1 Equivalent circuit of the electrode system ... 15
2.3.2 The equivalent circuit of the electrode system and bacteria in DEPIM method ... 17
2.3.3 Impedance measurement method ... 18
2.3.4 Suspension concentration estimation ... 19
2.4 The structure and properties of DNA ... 22
2.5 PCR ... 23
2.6 Theory of DNA detection based on microbeads dielectrophoresis ... 25
2.6.1 Surface conductance of particles ... 25
2.6.2 Theory of dielectrophoretic property change due to DNA labeling ... 29
2.6.3 Binding of particles and DNA ... 29
2.7 Crossover frequency ... 30
Chapter 3 ... 45
Microbeads positive dielectrophoresis-based DNA detection ... 45
3.1 Introduction ... 45
3.2 The alteration of microbeads DEP characteristic due to DNA labeling ... 45
3.2.1 DNA preparation ... 46
3.2.2 DNA labeling on microbeads ... 47
3.2.3 Measurement of cross-over frequency ... 48
3.3 Results and discussion ... 48
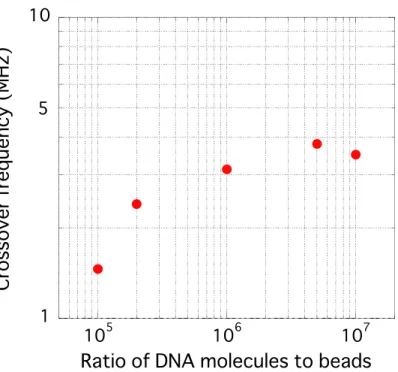
3.3.1 Effect of the labeled DNA amount on microbead DEP characteristic ... 48
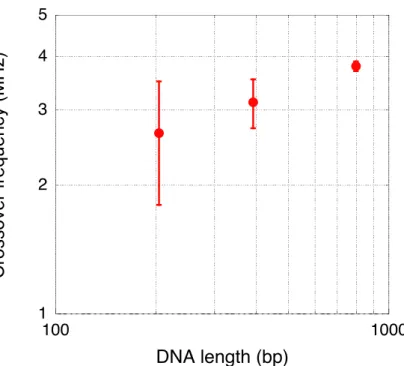
3.3.2 Effect of the labeled DNA length on microbead DEP characteristic ... 49
3.4 DNA detection method combing microbeads p-DEP and DEPIM ... 50
3.4.1 DNA preparation ... 50
3.4.2 DNA labeling on microbeads ... 50
3.4.3 DEPIM measurement ... 51
3.4.4 Results and discussion ... 51
3.5 Summary ... 52
Chapter 4 ... 59
Microbeads positive dielectrophoresis-based DNA detection for bacterial detection ... 59
4.1 Introduction ... 59
4.2Experimental methods ... 59
4.2.1 Bacterial preparation and DNA extraction ... 59
4.2.2 PCR ... 60
4.2.3 DNA labeling on microbeads ... 61
4.2.4 Optical observation of DEP behaviors of DNA-labelled microbeads ... 61
4.2.5 DEPIM of DNA-labeled microbeads ... 62
4.2.6 Selective detection of target bacteria ... 62
4.3 Results and discussion ... 62
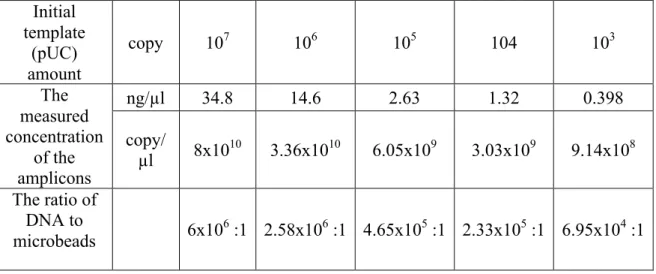
4.3.1 Relationship between the bacterial concentration and the DNA amplified from extracted bacterial DNA ... 62
4.3.2 Microbeads DEP behavior observation ... 63
4.3.3 Detection for pure E. coli solution. ... 63
4.3.4 Selective detection of E. coli from E. coli and yeast mixture ... 64
4.4 Summary ... 66
Chapter 5 ... 74
Microbeads negative dielectrophoresis-based DNA detection ... 74
5.1 Introduction ... 74
5.2 Proposed microfluidic device for DNA detection based on negative dielectrophoresis ... 75
5.3. Numerical calculation ... 75
5.3.1 Equations ... 75
5.3.2 Analysis of particle trajectory ... 76
5.3.3 Simulation results of particle trajectory ... 77
5.4 DNA detection microfluidic device using n-DEP of DNA labeled fluorescent microbeads ... 78
5.4.1 DNA preparation ... 78
5.4.2 DNA labeling on microbead ... 78
5.4.3 Microfluidic device fabrication ... 79
5.4.4 Experiment setup ... 81
5.5. Results and discussion ... 81
5.6 Summary ... 83
Chapter 6 ... 96
Microbeads Travelling wave dielectrophoresis-based ... 96
DNA detection ... 96
6.1 Introduction ... 96
6.2 DNA preparation ... 97
6.3 DNA labeling ... 97
6.4 Microelectrode ... 98
6.5 twDEP observation ... 98
6.6 Microbead velocity analyze ... 98
6.6.1 The velocity analyze region upon the electrode ... 99
6.6.2 The velocity analyze height upon the electrode ... 99
6.6.3 The velocity analyze time range ... 100
6.7 Velocity analyze of different amount of DNA labeled microbeads ... 100
6.6 Summary ... 101
Chapter 7 ... 115
Summary ... 115
Reference ... 118
Acknowledgements ... 122
Chapter 1 Introduction
1.1 Research background
In recent years, many cases of food poisoning caused by pathogenic bacteria have occurred. In 2011, collective food poisoning incident occurred by intestinal hemorrhagic E. coli (O - 111, O - 157) detected from beef provided at restaurant, leading to a situation of death1. As a result, sanitary standards concerning the handling of raw meat became stricter. In the worldwide, large-scale food poisoning cases caused by intestinal hemorrhagic E. coli O-104 have occurred in Europe, which have more than 4000 victims and 48 people were killed. According to report from Centers for Diseases Control and Prevention (CDC), approximately 48 million people in the United States get ill, 128000 people are hospitalized and 3000 people die annually due to foodborne diseases despite United States has the safest food supplies in the world(2-4).
Such food poisoning cases are often caused by a decrease in morality, such as the neglect of sanitary examinations of food providing companies. Many incidents can be prevented if the companies can strictly follow the sanitary standards. However, it is difficult to completely prevent the contamination of microorganisms no matter how strictly controlled. Therefore, techniques for detecting bacteria is required. Even if it is impossible to completely prevent contamination, it is possible to prevent contaminated foods from being distributed beforehand if it is determined whether or not bacteria are present in the food. The traditional method for bacterial detection is time-consuming and requiring specialized experts. In order to detect and identify the source of a bacterial contamination, various methods were used. For example, microscope observation, cell culture, immunological tests and genetic analysis. Microscopy is relatively quick but not specific. Culturing and growing bacteria can take up to several days. Furthermore, not all bacteria can be cultured in the laboratory5,6. Immunological tests (such as ELISA) are good methods to detect specific bacterial markers7. However, these methods are time consuming and costly, and require expert to carried out the test. Genetic methods such as the polymerase chain reaction (PCR) and real-time PCR have been used for bacterial detection(8-12). The high sensitivity, specificity, and speed of PCR-based methods have led to the development of DNA-based bacterial detection methods. PCR is used to
amplify specific regions of DNA or RNA via enzymatic reaction. Theoretically, PCR exponentially amplifies template DNA or RNA because each thermal cycle doubles the template number. It does not require culturing bacteria due to the small sample needed.
DNA amplified by PCR, are generally separated by size and detected by agarose gel electrophoresis. Although this method is well established and reliable, it requires rather complicated and time-consuming manual operations, carried out by experts. Hence, it is important to develop a more rapid, cost-effective, and sensitive methods for the detection of amplified DNA. From this point of view, in this research, we are conducting research on a new DNA detection method that is simple, rapid and cost effective.
1.2 Present methods of bacterial detection
Generally, bacteria, which requires detection, are typically single cell microorganisms having a cell size of 1.0 to 3.0 × 0.5 to 1.0 µm and a weight of about 1 pg. It requires moisture for growth and is weak against drying. Cell shape is spherical or oval, and exists in a single, linked or aggregated state. Oval cells include short ones (short bacilli), long ones (long bacilli), curved (Vibrio) and helical (Spirit). Some cells have flagellum, and the position and number of flagella is one of the criteria for bacterial classification.
However, bacterial individuals are extremely small and impossible to see with the naked eye. Even if they can be observed with a microscope, it is not possible to identify various bacteria by themselves. Therefore, it is common to perform qualitative and quantitative determination of bacteria by culturing in a medium. In the following, we describe the method of microorganism examination using culture of common living bacteria and coliform bacteria, which is representative as food hygiene indicator bacteria specified by law.
1.2.1 Measurement of viable bacteria by culture5,6
For examining the number of bacteria, there are a method using an agar plate and a method using a fermentation tube. The former can quantitatively measure the actual value, and the latter can obtain a quantitative theoretical value.
[Method using agar plate]
The sample stock solution prepared by the general viable cell count test or the 10- fold serial diluted sample solution is used as the test sample solution. Put 1 ml of each of
the sample solution into two Petri dishes, then pour 15-20 ml of desoxycholate agar medium, which is previously warmed and dissolved at 50 °C, into the Petri dishes. Once the medium has solidified, overlay the same medium on top of it, invert the Petri dish and incubate at 35 ° C for 24 hours in an incubator. After culture, count the colonies that appeared on the desoxycholate agar medium in accordance with the general viable cell count to calculate the number of bacterial, such as the E. coli groups.
[Method using fermentation tube]
Serial diluted sample was mixed in BGLB (Brilliant Green Lactose Bile Bouillon) medium fermentation tube, and cultured at 35 ° C for 48 hours. In the fermentation tube method, the MPN (most probable number) of the bacterial is determined from the number of regular colony of metallic luster to dark purplish red on the EMB agar medium flat plate. When starting from lactose broth fermentation tube at the beginning, MPN value is immediately obtained from the number of fermentation tubes where gas evolution was observed after incubation at 35 ° C for 48 hours.
1.2.2 Rapid bacterial detection method
In 1.2.1, the detection procedure by the culture method was shown for the case of the general viable bacteria. Although the culture method has high reliability respect to sensitivity and selectivity, the detection time depends on the proliferation process (1 day to 1 week) due to the cell division. Furthermore, it requires expert for the complex procedure, such as the sampling and dilution from the detection object, planting on the medium, counting the number of settlements. Therefore, various bacterial detection methods other than the conventional method have being studied. Representative bacterial detection methods are described below.
(1) ATP method
All bacteria confirmed contain ATP (adenosine triphosphate). The ATP method is an application in which luciferin-luciferase derived from firefly is luminescent by oxidation of luciferin when it contacts with ATP in the presence of magnesium ion. Since the amount of luminescence is proportional to the amount of ATP, the original viable cell count can be determined from the amount of light that measured with a highly sensitive photometer, which is proportion to the amount of ATP. ATP is kept constant in the cell as an energy source for bacteria, yeasts and fungi, but since ATP disappears in a very short time due to autolysis of dead cells. Therefore, the amount of ATP can be measured to
determine the number of viable bacteria. The ATP method can be considered as a rapid detection method since it does not require culturing, and it can measure the number of bacteria in real time. It can detect about 104 cells / ml in about 2 minutes. However, depending on the sample, there are problems such as the color of the sample medium that hinders light emission, interference due to ATP contained in the food itself, measurement limit at low level, difference in ATP amount between yeast and bacteria, complication of reagent preparation, etc. Therefore, it was used only for a limited range for examination.
Recently, a quick and simple ATP wiping inspection method which is carried out for routine confirmation of the cleanness of instruments etc. is widely used.
(2) ELISA (Enzyme-Linked Immunosorbent Assay) Method(7-23)
The ELIZA method is a method of highly sensitivity by labeling an antibody or antigen with an enzyme. When immobilizing antibody, which binds to the target bacterium (antigen), on the surface of a substrate, and put the solution containing the bacterium to the surface of the substrate, the tested bacterium specifically binds to the immobilized antibody. Then remove the liquid and leave only the bacteria which is bound to the immobilized antibody. Then, an enzyme-labeled antibody is added to bind with the antigen (bacteria). If the amount of the bacteria remaining on the surface and the amount of the enzyme-labeled antibody are in an appropriate range, the amount of the antibody to be bound varies depending on the amount of the remaining immobilized bacteria. When a chemical substance which develops color by enzymatic reaction is used, the amount of the bound antibody can be determined by measuring the absorbance, and it is also possible to quantify the bacteria. ELISA method has high selectivity because it uses antigen-antibody reaction, and it is also a sensitive inspection method. However, the experimental procedure is complicated and it is necessary to concentrate the bacterial from the sample, in order to obtain the concentration suitable for measurement of absorbance.
(3) PCR method(24-28)
The PCR (polymerase chain reaction) method can amplify a target specific DNA region by 105 times or more in a short time, and it is widely used in the field of DNA research. DNA is a molecule composed of a long duplex consisting of four consecutive bases (adenine (A), thymine (T), guanine (G), cytosine (C)). When DNA is heated to high temperature (94 ° C.), the doubled strand DNA are separated and become single-stranded, and when the temperature is gradually lowered, it has the property of restoring to the
original duplex. When placing a large amount of primer (a set of single-stranded DNA molecules having the same base sequence as about 20 bases at both ends of the target DNA region) when unbending the double strand, the primers complementary bind to the site of the sequence (referred to as annealing). If there are DNA synthase (DNA polymerase) and four kinds of bases there, it can be synthesized each chain starting from the part where the primer is bound. Bacteria inhabiting in high temperature hot springs have a kind of DNA polymerase with an optimum temperature of 72 ℃. By using this bacterial DNA polymerase, the temperature changes (94 ℃ -> 45 ℃ -> 72 ℃ -> 94 ° C) cycles can lead to a chain reaction of DNA synthesis took place. It was possible to increase the DNA in the test tube in about 2 to 3 hours. PCR has been studied for the detection of various bacterial86-90, such as E. coli, L. monocytogenes, Samonella spp., Shigela spp, C. jejuni and S. aureus.
The realtime PCR has also being widely used to reduce the detection time29.The amplification process of DNA is detected by using a fluorescent reagent, and the state of amplification can be confirmed even during the reaction cycle, and the detection can be as short as about 30 minutes. It has been used for detection for various bacterial30-34. Furthermore, there are commercially available kits available for bacterial detection and has been stuied35-43. Although this method can identify bacterial in a short time, it requires expert for the complex operation. Furthermore, it requires expensive equipment, as well as expensive reagent for each detection.
1.2.3 Performance required for bacterial detection method
Several methods for detecting bacteria have been presented so far. Here we describe the performance required for bacterial detection in order to identify bacteria caused food contamination or infective diseases.
(1) Rapidness
The early detection and identification of bacteria is required to select an appropriate clinical treatment or to assess the danger to the public. It is desirable to detect the bacterial as soon as possible to prevent or minimize damage in advance.
(2) High sensitivity
Bacteria such as pathogenic Escherichia coli O - 157 and Salmonella bacteria can develop disease on small intakes of several hundred cells. Therefore, it is required a more
sensitive detection method for the bacteria detection.
(3) Selectivity
In a bacteria test, it is rare that only a single kind of bacteria is existed in the sample.
Mostly, there are various kinds of bacteria mixed in the sample. Hence, it is necessary to selectively detect only the harmful bacteria.
(4) Simplicity
When the inspection procedure is complicated and various kinds of reagents are required, the running cost of bacterial examination is increased due to the requirement of expert operation and the usage of a large amount of reagent. In addition, due to the complexity of work, artificial mistakes may occur more frequently, which will result in false positive or false negative results. Therefore, bacteria detection needs to be performed with a simple operation. Furthermore, portable detection of bacterial is essential for bacterial detection to assess the danger to the public, which requires the bacterial detection method to be able to be performed by untrained staffs.
1.3 Bacterial detection by combining PCR with dielectrophoresis based DNA detection
Currently proposed bacterial detection methods do not satisfy those requirements discussed in 1.2.3. However, PCR method, as discussed, has high sensitivity and selectivity, because theoretically it can amplify the specific region from a single DNA.
Furthermore, the PCR method has been approved for various bacterial detections by FDA44. The DNA amplified by PCR, are generally separated by size and detected by agarose gel electrophoresis. Although this method is well established and reliable, it requires rather complicated and time-consuming manual operations, carried out by experts. Therefore, if a rapid and simple DNA detection method is developed, by combining this method with PCR, it can achieve rapid, simple, selective and sensitive detection of bacterial.
In order to achieve simple and rapid detection of DNA, we proposed a novel electric method for DNA detection based on dielectrophoresis (DEP).
DEP refers to the motion of electrically polarized particles in non-uniform electric fields, which has been widely used to manipulate biological microbeads, such as bacteria, biological cells, and DNA. Due to the physics properties of DNA, the DEP has been used for the manipulation of DNA molecules, such as separation(53-55), concentration(56-58) and
trapping(59-61). Furthermore, DEP have been used for DNA detection by binding DNA onto microbeads due to the physics properties change of DNA labeled microbead62,63.
Kawabata et al has been developed a method to use dielectrophoresis to detect molecular by labeling the molecular on to microbeads62. They attached ssDNA to microbeads and flow the sample through an electrode array for DNA detection. By choosing the applied voltage frequency, the DNA labeled microbeads experienced negative DEP while the unlabeled ones experienced positive DEP. Gagnon et al. also developed a method for DNA detection by using DEP of DNA labeled microbeads63,64. They proposed a method to detect DNA by applying the difference of crossover frequency for DNA labeled microbeads. These two detection methods show the possibility for DNA detection by applying the DEP characteristic change of DNA labeled microbeads. Therefore, it is possible to achieve rapid and simple detection of DNA if we can monitor the DEP characteristic change caused by DNA attachment in a rapid and simple way.
1.4 Structure of this paper
In this research, we applied the DEP characteristic change of DNA labeled microbeads for DNA detection and develop a novel electrical method for rapid detection of amplicons by dielectrophoresis (DEP) of microbeads. In the method, the amplicons are chemically labeled on dielectric microbeads so that the DNA labeling alters the surface conductance of microbeads and result in the change of Clausius–Mossotti (CM) factor K of DEP25. Since the DPE behavior is related to the K, it is possible for the detection of DNA by monitoring the behavior of the DEP.
And the following DNA detection method was examined.
1. Development of DNA rapid detection method utilizing positive dielectrophoresis (p-DEP) of microbeads and its application to bacterial specific detection.
2. Development of highly sensitive DNA detection method using negative dielectrophoresis (n-DEP) of microbeads.
3. Development of detection method of DNA using microbead traveling wave dielectrophoresis (twDEP).
Thus, this study developed methods that can detect DNA rapidly with only simple operation, and expected to contribute to the rapid identification of bacteria and viruses related to the field of infectious diseases and food safety.
This paper is based on these research results and consists of the following six chapters.
Chapter 1 summarized previous work and study subjects related to this research and described the purpose and outline of this research.
Chapter 2 explains the principle of dielectrophoresis and the theoretical model of dielectrophoretic impedance detection (DEPIM) with the aim of clarifying the theoretical foundation of the experiment results described in Chapter 3 and later.
In chapter 3, development of a rapid DNA detection method was described by exploiting the fact that the dielectrophoretic properties of microbeads change when DNA binds to microbeads. The DNA functionalization alters the DEP characteristics of the microbeads, mainly the surface conductance and the DEP force act on the microbeads will change from negative to positive. Hence, DNA labeled microbeads are trapped on a microelectrode under the action of p-DEP, whereas bare microbeads are repelled from the electrode, due to the n-DEP. Combining this dramatic alteration in DEP characteristics with impedance measurement allows rapid and quantitative detection of the PCR amplified DNA. Because the dielectrophoretic properties change with the negative charge of DNA, we investigated the change of dielectrophoretic properties depending on the amount and length of DNA modified on the surface of microbeads. By using this method, it became possible to detect DNA rapidly in 15 minutes.
Chapter 4 shows the application for bacteria detection using the method developed in Chapter 3. In order to investigate quantitative detection of bacteria by microbead p- DEP based DNA detection method, DNA extracted from bacteria was amplified by PCR and detected by proposed method. When the bacteria concentration was 3.9 × 10 3 CFU / ml or more, it showed the possibility of quantitative detection of bacteria. Furthermore, specific bacteria detection using this method was studied. By using PCR and microbeads dielectrophoresis phenomenon, an E. coli solution with a bacterial concentration of 105 CFU / ml or more could be specifically detected from a mixture of yeast and E. coli.
In Chapter 5, a highly sensitive DNA detection method was developed using n-DEP of microbeads. In the DNA detection method based on the p-DEP of DNA labeled microbeads, it is necessary to change the particle DEP from negative to positive, so the detection limit is determined by the necessary amount of DNA labeling (it is necessary to attach about 105 or more DNA to one microbeads). Since the changes of the DEP properties, which is caused by DNA labeling, are continuous, so that if the change in n- DEP force can be detected, even a DNA with a smaller labeling amount can be detected
and possibly resulting in higher sensitivity of DNA detection. Therefore, a microfluidic device was proposed which can detect the change of the n-DEP force acting on DNA labeled microbeads by monitoring the trajectories of DNA labeled microbeads in the microfluidic device. By the simulation, when K changes due to the change of the amount of the DNA attached on the microbeads surface, the trajectories of the microbeads changes. It was possible to detect DNA when the DNA labeling amount was 10 DNA / particle or more by detecting the fluorescence signal using the fluorescent microbeads to monitor the trajectories of DNA labeled microbeads.
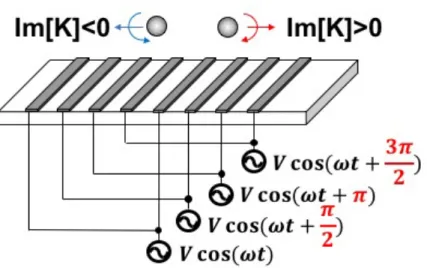
In Chapter 6, focusing on particle twDEP, a new DNA detection method was developed. A traveling wave electric field can be generated by applying an alternating electric field having a phase difference to alternately arranged comb-like microelectrodes.
While the usual dielectrophoretic force is proportional to the real part Re [K], the traveling wave dielectrophoretic force is proportional to the imaginary part of K. When the amount of modified DNA is small, it is theoretically clear that the Im[K] changed more dramatically than the Re[K]. When the Im [K] changes, the twDEP fore changes and results in the change of the velocity of DNA labeled particle. By analyzing the velocity of DNA labeled microbeads, it is possible to detect DNA when more than 103 copies of DNA are labeled on one microbead.
Finally, Chapter 7 summarizes the results obtained in this research, summarizes this paper, and describes future tasks.
Chapter 2 Theory
2.1 Introduction
In order to achieve rapid for simple detection for bacterial with high slectivity and high sensitivity, we intend to develop novel electrical methods for DNA amplified by PCR based on the electrophoresis characteristic of DNA labeled microbeads. In this chapter, the dielectrophoretic phenomenon of DNA labeled microbeads and related basic theories are dicussed. Also, the dielectrophoresis impedace measurement (DEPIM), which is the method used for the detection of DNA labeled microbeads based on the positive dielectrophoresis (p-DEP) force that developed previously by our group, is also discussed.
2.2 Dielectrophoresis66,67
Particle manipulation using electrostatic field, such as electrophoresis and dielectrophoresis, has already been put to practical use in a wide range of fields. Figure 2.1 shows the conceptual diagrams of electrophoresis and dielectrophoresis.
Electrophoresis is a phenomenon in which charged particles migrate along the electric flux line to the electrode of opposite polarity to its own charge due to the action of the Coulomb force in the non-uniform electric field and the uniform electric field. On the other hand, dielectrophoresis is a phenomenon of driving neutral particles in an non- uniform electric field. When neutral particles are placed in the electric field, the same amount of reverse polarized charge is induced in the portion facing each electrode. In the uniform electric field, the electric field strength acting on the respective polarization charges are equal, so that the generated Coulomb forces neutralized each other, and no net force acts on the particles. On the other hand, in the non-uniform electric field, since the electric field intensity acting on each polarization charge is different, there will be net force acting on the particles. This is called dielectrophoretic force. For example, when particles are more likely to polarize than the surrounding medium (Fig. 2.2. (a)), polarization charges (d-), which are the opposite polarity to the electrode of high electric field (+ in the figure 2.2), are induced on the high electric field side of the particle. In this case, since the force acting on acting on d- is larger, the particles move toward the higher electric field. On the orther hand, in the case where the surrounding medium is more
likely to be polarized than the particles (Fig. 2.2 (b)), the polarization charges (d+), which are the same polarity as the electrode on the high electric field side, are induced on the high electric field side of the particle. In this case, since the force acting on the d+
becomes larger, the particles move toward the lower electric field. The former is called positive dielectrophoresis (p-DEP) and the latter is called negative dielectrophoresis (n- DEP). Also, even if the polarity of the electric field is reversed, the polarity of the polarized charge will also be inverted, so that the dielectrophoretic force always acts in a fixed direction. Therefore, it is possible to use electric fields of both direct current (DC) and alternating current (AC).
In addition, since the polarization charge induced in the particles depends not only on the physical properties of the particles but also on the physical properties of the external medium and the electric field frequency, it has a potential for various ways of particles manupitation.
2.2.1 Dielectrophoretic force acting on dielectric particles65
The dipole in the non-uniform electric field E 1 is shown in Figure 2-3, and its position vector is r. The dielectrophoretic force F is the sum of the Coulomb forces acting on the polarization charges ± q with the distance d. So F can be expressed by following equation,
(2.1) Due to Taylar expansion:
(2.2) F can be expressed by following equation,
(2.3) Assuming that the dipoles are sufficiently small, the terms of second order and higher can be ignored. And since p=qd, F can then be expressed by following equation,
(2.4) Considering P is the dipole moment per unit volume (dielectric polarization), v is the volume. Therefore, p can be expressed as p=vP. Assuming the polarizability is a, then P can be expressed as following,
(2.5) Therefore, equation 2.4 becomes to
€
F=qE1
(
r+d)
−qE1( )
r
€
E1
(
r+d)
= E1( )
r +d⋅ ∇E1( )
r +
€
F=qd⋅ ∇E1
( )
r +€
F=
(
p⋅ ∇)
E1P=αE1
(2.6) Due to the vector operation equation:
(2.7)
and
(2.8)
so
(2.9)
Because of equation (2.6) and (2.9), F can be expressed by following equation, (2.10)
Assuming a spherical particle (radius a and dielectric constant e2) is inside of a medium with a dielectric constant e1. The internal electric field E2 of the particle and the dielectric polarization P can be expressed as following,
(2.11)
(2.12) Due to the equation (2.5), (2.11) and (2.12), the polarizability a can be expressed as following,
(2.13)
Due to the equation (2.10) and (2.13), the dielectrophoretic forces act on a dielectric sphere (radius a and dielectric constant e2) that is inside of a medium with a dielectric constant e1 can be express as following,
(2.14)
where
(2.15)
Consider the case of applying an alternating electric field. The current density J, when applying the AC electric field E to the dielectric spheres, equal to the sum of the conductive current and the displacement current. Therefore, J can be expressed as following,
€
F=αv
(
E1⋅ ∇)
E1€
∇
(
A⋅B)
= A× ∇ ×(
B)
+(
A⋅ ∇)
B+B× ∇ ×(
A)
+(
B⋅ ∇)
A€
∇ ×E1 =0
€
E1⋅ ∇
( )
E1= 12∇E1 2
€
F= 1
2αv∇E1 2
€
E2 = 3ε1 ε2 +2ε1 E1
€
P=
(
ε2−ε1)
E2€
α= 3ε1
(
ε2−ε1)
ε2 +2ε1
€
F=2πa3ε1K∇E1 2
€
K= ε2−ε1 ε2 +2ε1
(2.16) where wis the angular frequency of the electric field, e is the dielectric constant of the dielectric sophere and s is the conductivity of the dielectric sophere. Asuming
(2.17) J can be expressed as following,
(2.18)
e.
is called the complex permittivity, it is an important physic property when discussing the dielectrophoretic phenomena in AC electric field. Therefore, equation (2.15) becomes
(2.19)
The dielectrophoretic force, when an AC electric field is applied, can be expressed as following,
(2.20)
K
.
is called the Clausius-Mossotti factor. Re[K.
] has the value between -0.5 and 1.
When Re[K.
]>0, particles in the non-uniform electric field move towards the high electric field (p-DEP). When Re[K.
]<0, particles move towards the low electric field (n-DEP). As shown in the equations (2.17) and (2.19), Re[K.
] depends on the relative permittivity and the conductivity of both the medium and the dielectric particles, and also the applied electric field frequency. Furthermore, the magnitude of DEP force is proportional to Re[K.
].
2.2.2 Travelling wave dielectrophoresis27
It is essential to note that equation (2.14) can only simplified to equation (2.20) when assuming there is no spatially dependent phase in the non-uniform electric field. When a phase-shifted voltage is applied on microelectrodes, it will produce a traveling wave electric field. For instance, a travelling wave electric field can be generated as shown in figure 2.4 for an interdigitated microelectrode with a four phase AC signal.
When there is spatially varying phase in the non-uniform electric field, the equation (2.14) can be expand as:
𝑭 = 2𝜋𝑎'𝜀)Re 𝐾 ∇𝐸/ −12384567Im 𝐾 𝐸/ (2.21)
€
J=
(
jωε+σ)
E€
ε =˙ ε − jσ ω
€
J= jωε ˙ E
€
K =˙ ε ˙ 2−ε ˙ 1 ε ˙ 2 +2ε ˙ 1
€
F=2πa3ε1Re
[ ]
K ˙ ∇E1 2As shown in equation (2.21), when the particle is inside a non-uniform electric field with spatially varying phase, the DEP force acting on the particle consists of two components. The first component is the conventional DEP force and the second component is called the travelling wave DEP (twDEP) force. The model of traveling wave dielectrophoresis is established by Huang in 1992.78 The particle inside a traveling wave electric field will move along or against the direction of the field travel due to the experienced twDEP force, which is either against or along the direction of field travel when the Im[K] is either positive or negative, as shown in figure 2.4. When there is no spatially varying phase in the non-uniform electric field, the Im[K] will be zero, which means there will be no twDEP force. Furthermore, when the particle, which is in a traveling wave electric field, experienced both p-DEP force and twDEP force due to the applied voltage frequency as well as the conductivity and permittivity of the medium, the movement of the particle caused by twDEP force would not be observed. This is because the particle will be trapped to the microelectrode due to the p-DEP and prevent it to move along or against the direction of field travel. Therefore, the twDEP will only be effective when the applied voltage as well as the conductivity and the permittivity of chosen medium satisfied this two conditions:
1. The Imaginary part of the Clausius-Mossotti factor cannot be zero.
2. The particle need to be experiencing n-DEP to be levitated above the microelectrode.
2.2.3 Summary
The DEP phenomenon can be summarized as following,
1. DEP is a phenomenon of driving dielectric particles in a non-uniform electric field towards either high electric field of low electric field region. The direction of the movement, which is related to the Clausius-Mosotti factor K.
, dosed not depend on the polarity of electric field, so AC electric field can be used to generate the DEP.
2. Re[K.
] depends on the relative permittivity and the conductivity of both the medium and the dielectric particles. When the permittivity and the conductivity of the medium and the particle satisfies Re[K.
]> 0, the dielectric particle is driven to the high electric field region by p-DEP force, and when Re[K.
]<0, it will experience n-DEP force and move towards the low electric field region.
3. The magnitude of DEP force is proportional to Re[K. ].
4. The twDEP will be generated when the electric field has a spatially varying phase.
Particles will experience twDEP force against or along the direction of field travel when the Im[K.
] is positive or negative.
5. The magnitude of twDEP force is proportional to Im[K. ].
2.3 Measurement principle of DEPIM method(69-72) 2.3.1 Equivalent circuit of the electrode system
In this section, the measurement principle of DEPIM method will be explained by describing the detection of biological particles suspended in liquid medium using the DEPIM method.
Due to the advances in the photolithography technique, the usage of microelectrode has become common in the sensing of micro or nano materials. Especially in the case of bio-sensing using impedance measurement in solutions, the interdigitated microelectrode is often used due to the certainty and the rapidity of the response, as well as its characteristic sensitivity(73-75).
The interdigitated microelectrode used for DEPIM is fabricated on a slide glass by the photolithography technique. Each microelectrode strip has a 50 µm width, 12 mm length and 5 µm, as shown in figure 2.5.
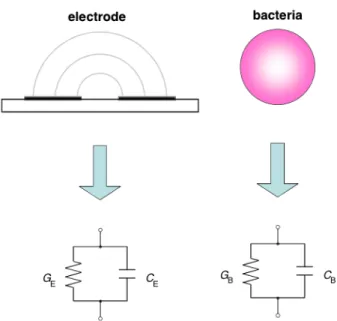
The electrode system model and its equivalent circuit in that case are represented by the resistance RS of the solution and the capacitance CS, and the capacitance CD of the electric double layer generated at the interface between the electrode and the solution as shown in figure 2.6. From this equivalent circuit, the total impedance Z of the electrode system is calculated by using the angular frequency w of the applied voltage.
(2.22)
(2.23) (2.24) From equations (2.22), (2.23) and (2.24), it can be seen that the total impedance Z depends on the frequency. Also, it can be seen that contribution degree of Z, RS, CS and CD components in Z depends on frequency. For example, RS can be ignored in the equation (2.23) in the low frequency range. Therefore, Z can be considered as,
€
Z= Z1Z2 Z1+Z2
€
Z1=RS+ 2 jωCD
€
Z2= 1 jωCS
(2.25) Also, since the electric double layer is very thin and generally CD >> CS, Z almost depends only on the CD component. On the other hand, as the frequency becomes higher, the dependency of the RS component becomes higher in the equation (2.23), so the equivalent circuit can be thought of as a parallel circuit of RS and CS, and the total impedance Z is
(2.26) In particular, in a relatively low frequency range (medium frequency range),
(2.27) In the relatively high frequency range (high frequency range),
(2.28) To summarize the above, the total impedance depends on 1) the electrostatic capacity CD of the electric double layer generated at the interface between the electrode in the low frequency range; 2) the resistance RS of the solution in the medium frequency region; 3) the electrostatic capacitance CS of the solution in the high frequency region.
The total impedance Z is shown with the real part Re [Z] on the horizontal axis and the imaginary part Im [Z] on the vertical axis (Cole-Cole plot) as figure 2.7 (a). It can be seen that the graph is indicated by a combination of a semicircle whose center is (0, RS / 2) and a radius is RS / 2 and a straight line of Re [Z] = RS. Since CD >> CS, the frequency f1
(= w1 / 2p) at the vertex A of the semicircle is
(2.29) It can be thought that the parallel circuit of RS and CS in the semicircular part, and the CD in the linear part.
Also, the horizontal axis shows the frequency f (=w/ 2p) in logarithmic representation and the vertical axis shows the absolute value of impedance | Z | (Bode plot), as shown in figure 2.7 (b). It can be seen that | Z | is inversely proportional to the frequency in the low frequency range and the high frequency range, and depends on the CS and CD
components, respectively. Moreover, in the middle frequency region, | Z | takes a constant
€
Z= 1
jω CS+CD 2
#
$ % &
' (
€
Z= RS jωCSRS+1
€
Z=Z1=RS
€
Z=Z2= 1 jωCS
€
f1= 1 2πRSCS
value RS with respect to frequency, and it is understood that it depends only on RS.
2.3.2 The equivalent circuit of the electrode system and bacteria in DEPIM method In the DEPIM method, when manipulating and collecting bacteria and virus by positive dielectrophoretic force, a high frequency electric field of about 100 kHz to 1 MHz is applied. In this case, since it is considered that the electrostatic capacity CD of the electric double layer generated at the interface between the electrode and the solution is negligible as described above, the equivalent circuit of the electrode system in the solution can be regarded as a parallel circuit of the resistance RS of the solution and the electrostatic capacity CS. On the other hand, the equivalent circuit of one bacterium is also represented by a parallel circuit of resistance and capacitance. Therefore, in the DEPIM method, the electrical equivalent circuit of the electrode and the bacterium is considered as a parallel circuit of the resistance of GE and GB and the capacitance of CE
and CB, respectively, as shown in figure 2.8. Assuming that one pearl chain is formed by m cells of bacteria between the electrode gaps, it can be considered that the equivalent circuit of one pearl chain connects one equivalent circuit of bacteria in series, so that its equivalent circuit can be considered as shown in figure 2.9. When the equivalent conductance GP and the equivalent capacitance CP are obtained,
(2.30) (2.31) Assuming that the total number of pearl chains formed between the electrode gaps is n, the equivalent circuit of the pearl chain as a whole can be thought of as an equivalent circuit of one pearl chain connected in parallel, so that its equivalent circuit can be shown as figure 2.10. When the equivalent conductance GT and the equivalent electrostatic capacity CT are obtained,
(2.32) (2.33) If all bacterial sizes are uniform, it can be considered that one pearl chain is always
€
GP = 1 mGB
€
CP = 1 mCB
€
GT =n GP= n mGB
CT =n CP= n mCB
formed by m cells of bacteria. Therefore, if N = m・n when the total number of bacteria trapped between the electrode gaps is N, the equations (2.32) and (2.33) are
(2.34) (2.35) N is proportional to GT and CT. This indicates that changes in bacterial count N can be measured by measuring changes in conductance GT or electrostatic capacity CT.
2.3.3 Impedance measurement method
As shown in figure 2.10, the impedance of the electrode system in which the bacteria are collected can be expressed by the electrode impedance GE, CE and the impedance GT
of the bacteria trapped in the electrode, CT and combined impedance GA, CA.
When a circuit as shown in figure 2.11 constructed and the combined impedance of the electrode system and the current detection resistor RL is ZA,
(2.36) where, w is the angular frequency of the power source (w = 2p f, f, is the frequency),
(2.37) (2.38) The resistance component r and the reactance component x of the composite impedance ZA are given by:
(2.39) (2.40) r, x can be determined from the following equation by actually measuring the phase difference q of voltage V, current I, voltage and current in the circuit of figure 2.11.
(2.41) (2.42) From equation (2.39) and (2.40),
€
GT = n
mGB=N 1 m2GB
€
CT = n
mCB=N 1 m2CB
€
ZA=RL+ GA− jωCA
GA
2+ω2CA 2
€
GA=GT+GE
€
CA=CT+CE
€
r=RL+ GA GA2+ω2CA2
€
x= ωCA GA2+ω2CA2
€
r=ZAcosθ =V I cosθ x=ZAsinθ =V
I sinθ
(2.43) (2.44) where rT = r - RL. And from equation (2.47) and (2.48),
(2.35) (2.46) In order to obtain GT and CT, the impedance of the electrode must be obtained. (2.43) and (2.44) from the measurement results in the state where no pearl-chain is formed immediately after voltage application.
From equation (2.44) and (2.45),
(2.47) Equation (2.47) shows that GT and CT are proportional to each other. Therefore, by confirming this relation, it can be determined whether or not the measurement result is a valid result.
2.3.4 Suspension concentration estimation
It is possible to estimate the concentration of the suspension from the impedance change when capturing bacteria between the electrode gaps. The theory is described below.
Figure 2.12 shows the process of collecting bacteria on the electrode. In this figure, bacteria enter the trap region in which the dielectrophoretic force works effectively and are trapped between the gaps. Here, the total area SE between the electrode gaps is divided into an area S1 of a region where no bacteria are collected and an area S2 of a region covered with already collected bacteria as shown in figure 2.13. The total area SE can be shown as
(2.48) Also, the number dNi of bacteria entering the collection region during time dt can be expressed as follows,
(2.49) where Si is the boundary area of the collection region, vi is the passage speed of the bacteria by forced circulation, etc., and r is the concentration of bacteria in the
€
GA = rT rT2+x2
€
CA= x ω
(
rT2+x2)
€
GT =GA−GE
€
CT =CA−CE
€
GT =GB CBCT
€
SE =S1+S2
dNi=Siviρdt
suspension. It is assumed that bacteria are always supplied and concentration r is almost constant. Assuming that bacteria are trapped in regions S1 and S2 with certain probabilities b1 and b2 while passing through the collection region,
(2.50) (2.51) Assuming that the probabilities b1 and b2 are proportional to the areas S1 and S2 of the region,
(2.52) (2.53) where K1, K2 are constants. When considering that the area S2 increases in proportion to N1,
(2.54) where a is constant. Due to equation (2.48), (2.49), (2.50), (2.52) and (2.54),
(2.55) By solving this differential equation with the initial condition set at t = 0 and N1 = 0,
(2.56) where
(2.57) Due to equation (2.49), (2.51), (2.53), (2.54), (2.56) and (2.57),
(2.58) By solving this differential equation with the initial condition being t = 0 and N2 = 0,
(2.59) Hence, the total number of bacteria collected between the electrodes is expressed as follows,
(2.60)
€
dN1=β1dNi
€
dN2=β2dNi
€
β1=K1S1
€
β2=K2S2
€
S2=αN1
€
d N1 N1−SE
α
=−αK1Siviρdt
€
N1=SE
α 1−exp
−t τ
%
&
' ( ) * +
, - .
/ 0
€
τ = 1 αK1Siviρ
€
d N2=K2SiviρSE 1−exp −t τ
%
&
' ( ) * +
, - .
/ 0 dt
€
N2=K2SiviρSEt−K2SE
αK1 1−exp −t τ
&
' ( )
* + ,
- . /
0 1
€
N t
( )
=N1+N2=K2SiviρSEt+SE α 1−
K2 K1
%
&
' (
) * 1−exp −t τ
%
&
' ( ) * ,
- . /
0 1
At t=0,
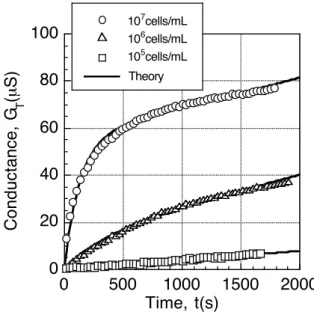
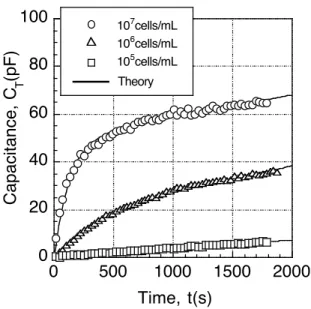
(2.61) From this, it can be seen that the slope of the tangent at t = 0 of the N - t curve is proportional to the concentration r. As can be seen from equations (2.34) and (2.35), since there is a proportional relationship between N and GT, CT, it is possible to estimate the concentration of bacteria in the suspension by measuring the impedance. Figures 2.14 and 2.15 show the results of measuring GT and CT using samples of three different concentrations of E. coli suspension as samples. From this figure, it can be seen that it coincides well with the theoretical curve drawn by equation (2.60).
In addition, when the conductance change GT is small, that is, when the total number of collected bacteria is small, since the saturation effect of the trapped bacteria can be ignored, the equation (2.60) can be approximated in a simple form. At this time, since rt is small and t / t is also small,
(2.62) Due to equation (2.60) and (2.62),
(2.63) where
(2.64) Due to equation (2.34) and 2.63,
(2.65) where
(2.66) Since K is a constant determined by bacterial species, electrodes, collection conditions, etc., when these conditions are fixed, GT is proportional to rt from equation (2.65). Therefore, if the value of K is found beforehand under the reference condition and the conductance change GT is obtained for a certain dielectrophoresis collection time t, using the equation (2.65), the suspension concentration r can be obtained. In order to investigate that if the equation (2.65) can be used, GT was measured by using E. coli suspension at a suspension concentration of 102 to 106 cells / ml as a sample, changing the suspension concentration r and collection time t. The experimental results are
€
d N
dt t=0=K1SiviρSE
€
exp −t τ
$
% & ' ( ) ≅1− t
τ
€
N t
( )
=K3ρt€
K3=K1SiviSE
€
GT
( )
t =Kρt€
K= K3GB m2
summarized in figure 2.16 as the relationship between GT and rt. From the figure, it can be confirmed that GT is proportional to rt when the suspension concentration is 3 × 10⁴ cells / ml or more. Therefore, when the suspension concentration is up to 104 cells / ml, it can be seen that the bacterial suspension concentration can be quantitatively estimated by GT measurement.
2.4 The structure and properties of DNA76,77
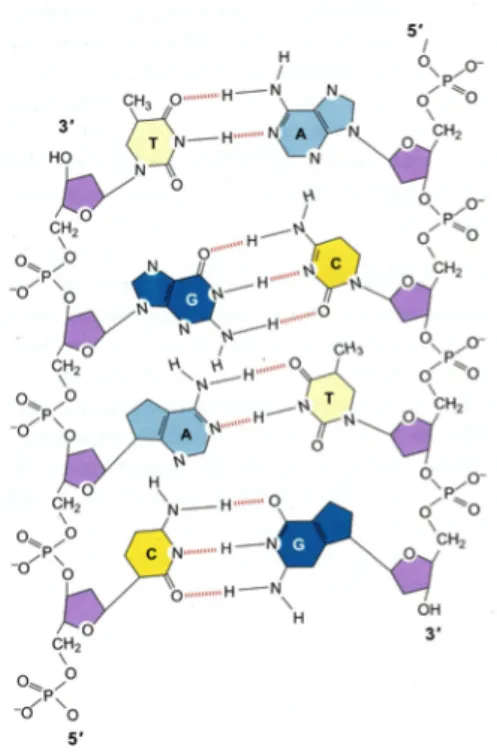
A deoxyribonucleic acid (DNA) molecule is made up of two long polynucleotide chains of four kinds of nucleotides. Each chain is called a single strand DNA, and it is the most important feature of DNA that these two chains form a double helix. Binding the two strands is a hydrogen bond formed between the base portions of nucleotides (Figure 2.17).
First, the properties of nucleotides, which are basic structural units of DNA, were described as bellow. The structure of nucleotide is shown in figure 2.18. The nucleotide is consisted of phosphoric acid and base that bonded to the sugar called 2'-deoxyribose.
The binding of the base to the 2'-deoxyribose may be considered to be a glyosidic bond formed by removing water molecules between the hydroxyl group at the carbon atom at the 1 'position of the sugar. Those in which sugar and base are bound are called nucleosides. It can be considered that binding of phosphoric acid to 2'-deoxyribose is also made possible by removing water molecules between phosphoric acid and hydroxyl group on the carbon at the 5 'position of sugar to produce 5' phosphate monoester.
Nucleoside with phosphate group added is called nucleotide. Thus, when a glycosidic bond is formed between a base and a sugar, and also a phosphoester bond is formed between a sugar and a phosphoric acid, a nucleotide is formed. Next, the polynucleotide chain is made through the phosphate group in which nucleotides are bound to 3'-OH and 5'-OH of 2'-deoxyribose (Figure. 2.19). This is a phosphodiester and the phosphate group between the two nucleotides is ester linked to the 3'-OH and 5'-OH of each sugar. By this linkage, a repeating main chain of polysaccharide and phosphate group, and also a polynucleotide chain is formed. Moreover, DNA has one negative charge per single base length. There are two kinds of bases of DNA, purine and pyrimidine. Purines are adenine and guanine, and pyrimidines are cytosine and thymine. Purine has the bicyclic structure shown in Fig. 2.20, and adenine and guanine have the same basic structure, but the bonding group is different. Likewise, cytosine and thymine are always paired with
thymine of the other chain at all times, guanine always forms a pair with cytosine, and therefore, complementary relationship to the base sequences of two chains which are intertwined with each other. In the case of adenine and thymine, a hydrogen bond can be formed between the exocyclic amino group of adenines C6 and the carbonyl group of C’s of thymine, and hydrogen bond can be formed between N 1 of adenine and N 3 of thymine. Similarly, between guanine and cytosine, complementarity of hydrogen bonds and shapes occurs, but in this case three hydrogen bonds can be formed. The exocyclic NH2 of guanine C2 faces the carbonyl group of C2 of cytosine to form a hydrogen bond.
And a hydrogen bond also formed between guanine N 1 and cytosine N 3 as well as between the guanine C 6 carbonyl group and cytosine C 4 exocyclic NH 2(Fig. (2.21)).
The polynucleotide chain that makes the DNA double helix is right handed. As a result of DNA forming a helix, periodicity is born. Each base pair is twisted by about 36 ° from the previous base pair, and according to the X-ray structural analysis of DNA, about 10 base pairs are overlapped and the helix rotates once. Therefore, every cycle of the helix, the cycle is approximately 10 base pairs. The complementary strand of a double helix is separated by a denaturation process when the DNA solution is heated above physiological temperature (near 100 ° C.) or raised in pH. However, perfect separation by denaturation is reversible, and when the heated DNA solution is slowly cooled, the single strand regenerates the double helix as it encounters the complementary strand.
Each eukaryotic chromosome contains one extremely long DNA molecule. However, it has been found that cytoplasmic DNA is present on the bacterial chromosome, and E.
coli has a circular chromosome of about 5 million base pair (bp). In addition, many bacteria have autonomously replicating small genetic elements called plasmids, which are also usually circular DNA molecules.
2.5 PCR(78-81)
The polymerase chain reaction (PCR) method is a DNA amplification method developed by Maris et al. (Kary B. Mullis was awarded the Nobel Prize in chemistry in 1993) in 1985. The PCR method also helped automate the equipment since the discovery of thermostable DNA polymerase (sometimes collectively referred to as the Taq DNA polymerase from the first discovered enzyme name) in 1988. Then the PCR has benn used in varios fields such as biology and molecular biology.
PCR is a method to specifically and exponentially amplify DNA. Its principle is shown