九州大学学術情報リポジトリ
Kyushu University Institutional Repository
吸着単分子膜と脂質二分子膜における分子混和性と ドメイン形成に関する研究
平城, 慎也
http://hdl.handle.net/2324/2236030
出版情報:Kyushu University, 2018, 博士(理学), 課程博士 バージョン:
権利関係:
Study on Molecular Miscibility and Domain Formation in Adsorbed Monolayer and Lipid Bilayer
Shinya Hiraki
Laboratory of Soft Interface Chemistry Department of Chemistry
Graduate School of Science
Kyushu University
Abstract
The nanoscopic domain called “raft” is expected to exist in a biological membrane.
Despite of the fact that mesoscopic domains have been observed in the monolayer and bilayer composed of several lipids, the principle of domain formation with a various shape and size in a complicated matter is still unclear mainly because of a lack of data on structure and molecular miscibility in domains. Thus, in this study, we investigated the effect of molecular miscibility on domain formation in two binary adsorbed films at hexane/water interface on the basis of “line tension”, which arises the domain boundary and is dominant for domain morphology. The molecular miscibility such as composition and intermolecular interaction and molecular arrangement inside and outside of domains were quantitatively evaluated by coupling interfacial tensiometry and X-ray reflectometry (XR). The effect of molecular mixing on domain morphology was examined by Brewster angle microscopy (BAM).
In Chapter 2, n-tetradecyl phosphocholine (C14PC) and Cholesterol (Chol) mixed system was adopted as a simple model of biological membrane. The adsorbed film took four kinds of film states; gaseous (G), expanded (E), liquid condensed (LC), and condensed (C) ones, depending on the molality of C14PC in the aqueous and that of Chol in the hexane solutions. The phase diagram of adsorption, the activity coefficient in the film, and the electron density profile showed that the arrangement of C14PC molecules was changed from staggered to parallel as mixing of Chol with C14PC because the favorable interaction between C14PC and Chol overcomes the electrostatic repulsion between PC groups of C14PC. Furthermore, BAM observation demonstrated that the circular domain with E state was dispersed into the C film at just above the E – C phase transition point and that the domain size reduced with increasing the C14PC compositions
inside and outside of domains, suggesting that a correlation between molecular miscibility and line tension.
In Chapter 3, methyl palmitate (MePa) – Chol mixed system was adopted in order to examine the effect of molecular mixing on line tension in more detail. The adsorbed film exhibited the phase transitions from G to C at low and from G to C via E states at high Chol composition in the hexane solution. In each state, the film was very rich in Chol because of a loss of effective packing between hydrophobic parts competing with hydrogen bonding between their hydrophilic parts of MePa and Chol molecules. As well as the former system, the circular domain with the G (or E) state was confirmed in the C film at just above the G or E – C phase transition point by BAM and by domain fitting analysis of XR data. The domain size reduced with small decreasing the Chol compositions in domains. Judging from the calculated line tension value as well as the electron density profile and activity coefficient, MePa molecule adding into domains reduces the thickness mismatch between domains and adsorbs at the domain boundary, both of which promote the reduction of contact energy associated with the contact of C domain and surrounding hexane solvent, shrinking the total length of domain boundary.
The purpose in Chapter 4 is to measure the line tension in giant unilamellar vesicle (GUV). Adopting distearoyl phosphatidylcholine (DSPC)/dioleoyl phosphatidylcholine (DOPC)/Chol and brain sphingomyelin (bSM)/DOPC/Chol mixed systems, we observed the domain formation by fluorescence microscopy and measured the line tension at a different tie lines which connect the lipid compositions of coexisting domains by Fourier analysis on thermally fluctuating domain contour called flicker spectroscopy. The line tension reduced from 1.1 pN to 0.4 pN for DSPC- and from 0.8 pN to 0.44 pN for bSM- containing systems as tie line becomes closer to critical point. The line tension was further
calculated from the equation of elastic energy due to the lipid deformation around domain boundary, into which the published structural and elastic properties of domains were substituted. The theoretical value was much higher but depended on the lipid composition of GUVs, indicating that the molecular miscibility inside and outside of domains affect the line tension by changing molecular arrangement or elastic property even in lipid bilayer. In the perspective section, the appropriate method to measure the line tension in monolayer at the liquid/liquid interface was discussed.
Contents
Chapter 1. General Introduction
1-1. General Introduction 1
1-2. References 4
Chapter 2. Molecular Miscibility and Domain Formation in Adsorbed Film of C14PC – Chol Mixture at C6/W Interface
2-1. Introduction 7
2-2. Experimental 10
Materials 10
Interfacial Tensiometry 10
Thermodynamics of Adsorption 12
X-ray Reflectometry 13
Brewster Angle Microscopy 17
Line Tension in Monolayer 19
2-3. Results and Discussion on Pure systems 21
State of Adsorbed Films 21
Structure of Adsorbed Films 25
Domain Structure of Adsorbed Chol Film 34
2-4. Results and Discussion on C14PC – Chol mixed system 38
Film State and Molecular Miscibility 38
Structure of Mixed Adsorbed Film 54
Domain Formation in Mixed Adsorbed Film 62
2-5. Conclusions 70
2-6. References 71
Chapter 3. Molecular Miscibility and Domain Formation in Adsorbed Film of MePa – Chol Mixture at C6/W Interface
3-1. Introduction 76
3-2. Experimental. 78
Materials 78
Interfacial Tensiometry 78
Thermodynamics of Adsorption 78
X-ray Reflectometry 79
Brewster Angle Microscopy 79
3-3. Results and Discussion 80
Film State and Molecular Miscibility 80
Structure of Mixed Adsorbed Film 91
Domain Formation and Line Tension 99
3-4. Conclusions 105
3-5. References 107
Chapter 4. Line Tensions in Ternary DSPC/DOPC/Chol and bSM/DOPC/Chol Bilayers
4-1. Introduction 109
4-2. Experimental 112
Materials 112
GUVs Preparation 112
Imaging of GUVs by Fluorescence Microscopy 114 Line Tension Measurement by Flicker Spectroscopy 115
Phase Diagrams of Ternary Systems 119
4-3. Results and Discussion 121
4-4. Perspective 126
4-5. Conclusions 128
4-6. References 129
Acknowledgement 132
1
Chapter 1. General Introduction 1-1. General Introduction
Studies on soft interfaces including molecular films at gas/liquid and liquid/liquid interfaces, emulsion, foam, and biological membrane provide us useful information on structure and property of them available for development of sophisticated materials in applied science as well as for understanding structure – function relation of living cells in basic science. One of the current issues in biochemistry and biophysics is heterogeneity of soft interfacial films which is closely related to high performance of biological membrane of eukaryotic cells.
In the end of 20th century, Simons and Ikonen have proposed “raft” hypothesis that the biological membrane is regarded as a heterogeneous bilayer in which nanoscopic liquid ordered domains are surrounded by fluid phase region and is responsible for the function of several membrane proteins and plays crucial role in signaling, membrane transferring, and virus infection[1–7]. Although many researchers have explored the role and principle of raft formation from the viewpoints of not only biology such as lipid metabolism and endocytosis but also physical chemistry such as phase separation in membrane, the nanoscopic domains in natural biological membrane has not been detected directly yet because of their extremely small size. In the study of model membrane using lipid vesicle of phospholipid (PL), cholesterol (Chol), and proteins, however, mesoscopic domain was found by a microscopic observation[8–11] and the morphology was examined in terms of lipid composition, membrane rigidity, and line tension at domain boundary.
According to the theories developed by McConnell et al.[12] and Kuzmin et al.[13], the line tension in monolayer is the sum of contact energy and dipole – dipole repulsive energy at the domain boundary. The former is due to the contact of hydrophobic part of
2
domain with the surrounding solvent and reduces the total length of the boundary, whereas the latter extends the domain boundary and promotes the formation of many tiny circular or stripe shaped domain. In the case of lipid bilayer (vesicle) dispersed in aqueous solution, because the contact of hydrocarbon chain with water causes the large contact energy, the relatively low energy of elastic deformation such as tilt, splay, and bend takes the place of the contact one (see Chapters 2 and 4 in detail, respectively).
Following the theories, attentions have been directed to an estimation of structural and mechanical properties of domains as well as to a development of the method to quantify line tension. In the researches on lipid monolayer and bilayer of PL – Chol mixture[14–21],the domain properties closely related line tension such as film thickness, molecular density, bending and tilt moduli, and spontaneous curvature were determined experimentally or estimated theoretically and found to be dependent on film composition, suggesting that the structure and property of heterogeneous film are affected appreciably by the mutual interaction between the molecules at the soft interfacial films[22–25]. Thus, disclosing the quantitative relation of molecular miscibility to structural and mechanical properties inside and outside of domains is one of key issues to elucidate the principle of domain formation with a diversity of morphology in the complicated molecular organized system such as biological membrane, from the viewpoint of line tension.
A main purpose in this thesis is to examine the effect of molecular mixing on domain formation form the viewpoint of physical chemistry. Thus, a study on the monolayer and bilayer of mixed component systems were adopted, and molecular miscibility and microscopic structure of the films as well as the domain formation were examined by coupling the thermodynamic strategy based on interfacial tensiometry with microscopic one on Synchrotron X-ray reflectometry (XR)[26,27]. Brewster angle microscopy (BAM)
3
was also adopted to visualize the domain morphology and to calculate the line tension[12]. In Chapter 2, we adopted binary single-chain PL (n-tetradecyl phosphocholine;
C14PC) – Chol system as a simple model of biological membrane. It was confirmed that the adsorbed film of the pure Chol system was a heterogeneous in which dilute circular domains are dispersed into condensed phase region. Furthermore, a dilute domain size decreased as mixing of C14PC molecule inside and outside of domain due to hydrogen bonding and van der Waals interactions between C14PC and Chol, suggesting the influence of molecular mixing on line tension and domain size.
In Chapter 3, methyl palmitate (MePa) was used instead of C14PC. As well as the mixed C14PC – Chol system, a dilute domain size decreased with slight increase of MePa in the adsorbed film. In this case, it was suggested that MePa molecule is less miscible with Chol in domains because of the ineffective packing between hydrocarbon chain and sterol ring, whereas it adsorbs at the domain boundary due to the hydrogen bonding between methyl ester and hydroxyl groups and reduces the line tension, such as a surfactant adsorbs at the interface and reduces the interfacial tension[28].
In Chapter 4, line tensions was determined in lipid bilayers of two ternary mixtures;
(i) distearoyl phosphatidylcholine (DSPC)/dioleoyl phosphatidylcholine (DOPC)/Chol and (ii) brain-sphingomyelin (bSM)/DOPC/Chol ones by flicker spectroscopy. This method is a shape analysis of thermal fluctuation of domain boundary by Fourier series[14,28–32]. The measured value was compared with that calculated from elastic theory into which the published structural, compositional, and mechanical values[16–19,29,33–35]
were substituted. Then, it was verified that the molecular and domain structures are dominant for line tension Furthermore, we discussed on the appropriate method to measure the line tension in adsorbed film at soft interface including liquid/liquid one.
4
1-2. References
[1] R.M. Epand, Biochim. Biophys. Acta - Biomembr., 1778, 2008, 1576–1582.
[2] D.A. Brown, J.K. Rose, Cell, 68, 1992, 533–544.
[3] M.J. Aman, K.S. Ravichandran, Curr. Biol., 10, 2000, 393–396.
[4] K. Simons, E. Ikonen, Nature, 387, 1997, 569–572.
[5] P. Gonnord, C.M. Blouin, C. Lamaze, Semin. Cell Dev. Biol., 23, 2012, 154–164 [6] S. Mañes, E. Mira, C. Gómez-Moutón, R.A. Lacalle, P. Keller, J.P. Labrador, C.
Martínez-A, EMBO J., 18, 1999, 6211–6220.
[7] P. Scheiffele, A. Rietveld, T. Wilk, K. Simons, J. Biol. Chem., 274, 1999, 2038–
2044..
[8] H.M. McConnell, Annu. Rev. Biophys. Biomol. Struct., 32, 2003, 469–492.
[9] G.W. Feigenson, Biochim. Biophys. Acta - Biomembr., 1788, 2009, 47–52.
[10] G.W. Feigenson, Nat. Chem. Biol., 2, 2006, 560–563.
[11] E. London, Biochim. Biophys. Acta, 1746, 2005, 203–220.
[12] H.M. McConnell, V.T. Moy, J. Phys. Chem., 92, 1988, 4520–4525.
[13] P.I. Kuzmin, S.A. Akimov, Y.A. Chizmadzhev, J. Zimmerberg, F.S. Cohen, Biophys. J., 88, 2005, 1120–1133.
[14] S.L. Keller, A.R. Honerkamp-Smith, P. Cicuta, M.D. Collins, S.L. Veatch, M. den Nijs, M. Schick, Biophys. J., 95, 2008, 236–246.
[15] G. Pabst, N. Kučerka, M.P. Nieh, M.C. Rheinstädter, J. Katsaras, Chem. Phys.
Lipids, 163, 2010, 460–479.
[16] G. Khelashvili, B. Kollmitzer, P. Heftberger, G. Pabst, D. Harries, J. Chem. Theory Comput., 9, 2013, 3866–3871.
[17] F.A. Heberle, R.S. Petruzielo, J. Pan, P. Drazba, N. Kuc, J. Am. Chem. Soc., 135,
5
2013, 6853–6859.
[18] B. Kollmitzer, P. Heftberger, M. Rappolt, G. Pabst, Soft Matter, 9, 2013, 10877–
10884.
[19] P. Heftberger, B. Kollmitzer, A.A. Rieder, H. Amenitsch, G. Pabst, Biophys. J., 108, 2015, 854–862.
[20] J. V. Bleecker, P.A. Cox, S.L. Keller, Biophys. J., 110, 2016, 2305–2308.
[21] W.C. Tsai, G.W. Feigenson, Biochim. Biophys. Acta - Biomembr., 1861, 2019, 478–485.
[22] B.P. Binks, MODERN ASPECTS OF EMULSION SCIENCE, Royal Society of Chemistry, CambridgeLondon, 1998.
[23] T. Takiue, T. Fukuda, D. Murakami, H. Sakamoto, H. Matsubara, M. Aratono, J.
Phys. Chem. B, 113, 2009, 14667–14673.
[24] J.N. Israelachvili, Intermolecular and Surface Forces, 3rd ed., Academic Press, 2011.
[25] S. Hiraki, T. Goto, H. Tanida, K. Nitta, T. Ina, T. Uruga, H. Matsubara, M. Aratono, T. Takiue, Colloids Surfaces A Physicochem. Eng. Asp., 482, 2015, 454–463.
[26] R. Fukuhara, H. Tanida, K. Nitta, T. Ina, T. Uruga, H. Matsubara, M. Aratono, T.
Takiue, J. Phys. Chem. B, 118, 2014, 12451–12461.
[27] S. V. Pingali, T. Takiue, G. Luo, A.M. Tikhonov, N. Ikeda, M. Aratono, M.L.
Schlossman, J. Phys. Chem. B, 109, 2005, 1210–1225.
[28] I. Sriram, D.K. Schwartz, Surf. Sci. Rep., 67, 2012, 143–159.
[29] R.D. Usery, T.A. Enoki, S.P. Wickramasinghe, M.D. Weiner, W.C. Tsai, M.B.
Kim, S. Wang, T.L. Torng, D.G. Ackerman, F.A. Heberle, J. Katsaras, G.W.
Feigenson, Biophys. J., 112, 2017, 1431–1443.
6
[30] B.L. Stottrup, A.M. Heussler, T.A. Bibelnieks, J. Phys. Chem. B, 2007, 11091–
11094.
[31] C. Esposito, A. Tian, S. Melamed, C. Johnson, S.Y. Tee, T. Baumgart, Biophys. J., 93, 2007, 3169–3181.
[32] M.C. Heinrich, I. Levental, H. Gelman, P.A. Janmey, T. Baumgart, J. Phys. Chem.
B, 112, 2008, 8063–8068.
[33] J. Lipfert, L. Columbus, V.B. Chu, S.A. Lesley, S. Doniach, J. Phys. Chem. B, 111, 2007, 12427–12438.
[34] T.M. Konyakhina, J. Wu, J.D. Mastroianni, F.A. Heberle, G.W. Feigenson, Biochim. Biophys. Acta - Biomembr., 1828, 2013, 2204–2214.
[35] R.S. Petruzielo, F.A. Heberle, P. Drazba, J. Katsaras, G.W. Feigenson, Biochim.
Biophys. Acta - Biomembr., 1828, 2013, 1302–1313.
7
Chapter 2. Molecular Miscibility and Domain Formation in Adsorbed Film of C14PC – Chol Mixture at C6/W Interface
2-1. Introduction
Soft interfacial films of surface active such as gas/liquid and liquid/liquid interfaces are strongly affected not only by the structure of the molecules but also by the mutual interaction between adsorbed molecules[1–10], and regarded as a basic structure of more complicated soft matters such as emulsion, foam film, and biological membrane. The investigation of the structure and property of them, therefore, is crucial to clearly understand the structure – function relation of molecular organized systems[11–17].
Since Simons et al. have proposed the heterogeneity of biological membrane[18], a lot of efforts have been paid to ascertain the formation of a heterogeneous structure in model membranes composed of phospholipid (PL) and cholesterol (Chol) from both microscopic and macroscopic viewpoints[19–24]. Among others, direct observation of insoluble monolayer and liposome (bilayer) of PL and Chol mixtures by optical method using Brewster angle microscope (BAM) and fluorescence microscope (FM) clearly indicated that the lateral phase separation, in which Chol-rich liquid ordered (Lo) domain with μm order is formed in Chol-poor liquid disordered (Ld) region, takes place depending on the composition of Chol in the mixture[25–29]. The application of Förster resonance energy transfer (FRET) and small angle neutron scattering (SANS) to the lipid liposome enables us to detect Lo domains with tens of nm[27,28,30–34]. In the theoretical studies by McConnell[35] and Kuzmin[36], furthermore, the effect of line tension, which is an excess energy generated on the domain boundary, on the domain morphology has been discussed from the viewpoint of the contact of domain forming molecules and solvent, the dipole – dipole interaction, and the tilt and spray of molecules at the domain boundary.
8
In our previous study on the adsorbed film of 1H,1H,2H,2H-perfluorodecanol (FC10OH) at the hexane (C6)/water (W) interface by interfacial tensiometry and X-ray reflectometry (XR)[37], it was found that the adsorbed FC10OH film shows an expanded – condensed phase transition detected by a break on the interfacial tension versus concentration and temperature curves, and that the expanded film is heterogeneous structure in which condensed domains with μm order are surrounded by low density gaseous region. The contact of FC10OH with hexane at the domain boundary produces line tension with a few pN (10−12 N) orders[38]. Another recent study on the adsorbed film of 1H,1H,10H,10H-perfluorodecane-1,10-diol (FC10diol) and FC10OH mixture[39]
demonstrated the appearance of the heterogeneous condensed film where the normal- oriented condensed domain of FC10OH coexists with the parallel-oriented condensed phase of FC10diol, due to the weaker interaction between different molecules than between the same ones. The coverage of domains resulted from XR is consistent with that estimated from film composition evaluated by interfacial tensiometry, indicating that the high reliability for our strategy of quantitative evaluation of molecular miscibility in the adsorbed film by the two techniques.
One of the current issues to be solved on the heterogeneous film in the mixed system is to understand the effect of molecular miscibility on the domain formation because many soft matters including biological membrane generally consists of several components and therefore their structure and property should be closely related to the mixing of molecules both in domain and surrounding phase. However, because of few methods to determine their compositions, a quantitative discussion on the driving force of domain formation as well as the effect of line tension on the domain formation is still unclear.
In this study, we aim at clarifying the effect of molecular mixing on the domain
9
formation in the adsorbed film of PL and Chol mixture as a simple model for biological membrane. For doing this, we employed the adsorbed film of water soluble single chain PL: n-tetradecyl phosphocholine (C14PC) and oil soluble Chol mixture at the C6/W interface, because our thermodynamic strategy for evaluating the film composition, especially those of coexisting two interfacial states, can be applicable to the adsorbed film in order to estimate the compositions of domain and surrounding phase by coupling with the domain coverage determined by BAM images of heterogeneous film. Furthermore, to understand the effect of line tension on the domain formation with the help of these valuable data, the adsorbed film at the C6/W interface was directly observed by BAM.
This study is a challenge to estimate quantitatively the compositions of coexisting domains and to elucidate the connection between molecular miscibility – domain formation – line tension by the combination of interfacial tensiometry, XR, and BAM.
The interfacial tension 𝛾 of the hexane Chol solution against aqueous C14PC one was measured as functions of molality of C14PC and that of Chol at 298.15 K under atmospheric pressure. The phase diagram of adsorption was constructed and the activity coefficient of a component in an adsorbed film was evaluated in order to examine the molecular miscibility in the adsorbed film from the viewpoint of intermolecular interaction between adsorbed molecules. X-ray reflectivity from the adsorbed film was analyzed to determine the electron density profile normal to the interface in the homogeneous film as well as the domain coverage in the heterogeneous one. The heterogeneity of adsorbed film was also observed by BAM to evaluate the coverage, size and shape of domains.
10
2-2. Experimental Materials
n-Tetradecyl phosphocholine (C14PC) purchased from Avanti polar Lipid Inc. (>
99 %) was used without further purification. Purity was confirmed by an equilibrium interfacial tension value at the C6/aqueous solution interface. Cholesterol (Chol) purchased from Aldrich Chemical Co. Ltd. (> 99 %) was purified by recrystallization at least twice from ethanol. Purity was checked by gas-liquid chromatography and by the equilibrium interfacial tension value between hexane solution and water phases. Hexane (99 + % grade, Aldrich Chemical Co. Ltd.) was distilled once under atmospheric pressure and water was purified by Millipore Milli-Q system.
Interfacial Tensiometry
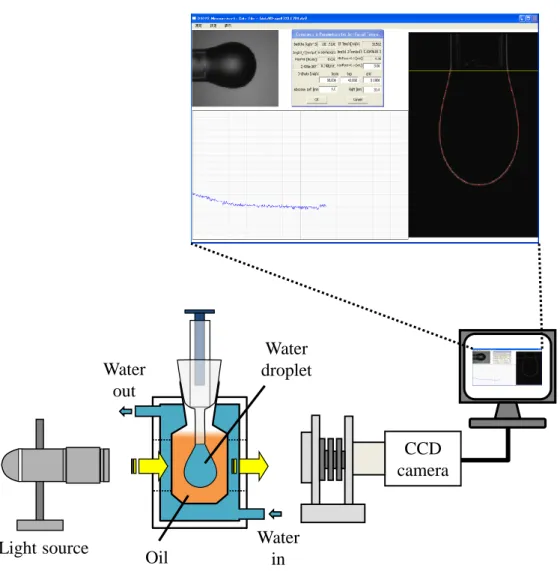
The interfacial tension 𝛾 at the C6/W interface was measured as a function of molality of C14PC in aqueous solution 𝑚PCw and that of Chol in the hexane solution 𝑚Cho at 298.15 K under atmospheric pressure by the pendant drop method demonstrated in Figure 2-1[40]. Before measurements, both solutions at given 𝑚PCw and 𝑚Cho were mixed in a volumetric flask at 298.15 K and then allowed to stand for at least 24 hours to separate two transparent phases. For the calculation of an interfacial tension, densities of pure hexane and water were used instead of those of hexane and aqueous solutions at equilibrium, because both solutions are dilute and their mutual solubility was negligibly small. The experimental error of 𝛾 value was estimated within ±0.05 mN m−1.
11
Figure 2-1. A schematic of the equipment for the pendant drop method.
Light source Oil
CCD camera
Water in Water
out
Water droplet
12
Thermodynamics of Adsorption
Here let us briefly introduce thermodynamic relations used in this study. A total differential of interfacial tension 𝛾 is expressed as functions of temperature 𝑇, pressure 𝑝, 𝑚PCw, and 𝑚Cho by[41,42]
d𝛾 = −Δ𝑠d𝑇 + Δ𝑣d𝑝 − ΓPCH (𝑅𝑇
𝑚PCw ) d𝑚PCw − ΓChH (𝑅𝑇
𝑚Cho ) d𝑚Cho , (2 − 1) where Γ𝑖H (𝑖 = PC, Ch) is the interfacial density of component 𝑖 and Δ𝑦 (Δ𝑦 = 𝑠, 𝑣) is thermodynamic quantity change associated with an adsorption of C14PC and Chol respectively from the aqueous and hexane solutions to the C6/W interface defined by
Δ𝑦 = 𝑦H− ΓPCH𝑦PCw − ΓChH𝑦Cho . (2 − 2) The ΓPCH and ΓChH values were calculated respectively by
ΓPCH = −𝑚PCw 𝑅𝑇 ( 𝜕𝛾
𝜕𝑚PCw )
𝑇,𝑝,𝑚Cho
, (2 − 3)
and
ΓChH = −𝑚Cho 𝑅𝑇 ( 𝜕𝛾
𝜕𝑚Cho )
𝑇,𝑝,𝑚PCw
. (2 − 4)
Then, in order to assign a state of adsorbed film, interfacial pressure 𝜋 versus mean area per molecules 𝐴 curves were drawn by using
𝜋 = 𝛾0− 𝛾 , (2 − 5)
and
𝐴 = 1 𝑁⁄ AΓH , (2 − 6)
where 𝛾0 is the interfacial tension between pure hexane and water, 𝑁A is Avogadro’s number, and ΓH is the total interfacial density calculated by ΓH= ΓPCH + ΓChH.
The mixing of C14PC and Chol molecules in the adsorbed film was examined by evaluating the composition of Chol in the adsorbed film 𝑋ChH defined by
13
𝑋ChH = ΓChH⁄ΓH . (2 − 7) A mutual interaction between C14PC and Chol molecules in the adsorbed film is further evaluated quantitatively by estimating an activity coefficient of component 𝑖 in the adsorbed film at given 𝛾, defined symmetrically as 𝑓𝑖H→ 1 when 𝑋𝑖H→ 1, by using[43]
𝑋𝑖H𝑓𝑖H= 𝑋𝑖𝑚 𝑚⁄ 𝑖0 , (2 − 8) where 𝑚 and 𝑋𝑖 are respectively the total molality and the bulk composition of component 𝑖 defined by
𝑚 = 𝑚PCw + 𝑚Cho , (2 − 9) and
𝑋𝑖 = 𝑚𝑖α⁄ ,𝑚 (𝑖 = PC, Ch , α = w, o) (2 − 10) respectively, and 𝑚𝑖0 is the molality of pure component 𝑖 at given 𝛾.
X-ray Reflectometry
X-ray reflectivity from the adsorbed film at the C6/W interface was measured at the beamline BL37XU in SPring-8 by using liquid surface spectrometer schematically described in Figure 2-2[44]. The X-ray beam introduced into the experimental hutch is diffracted by a Ge(111) crystal in order to select the energy (25 keV) and adjust the incident angle of the beam. A slit placed in front of the sample cell determines the beam size; the slit gaps were 10 μm in vertical and 200 μm in horizontal. The footprint on the interface is around 2 cm along the beam path. A N2 gas ion chamber put between the slit and the sample cell measures the incident X-ray flux. The intensity of reflected beam was detected by two-dimensional pixel detector (PILATUS) combined with a copper-aluminum absorber to reduce the X-ray photons to optimum amounts.
14
Figure 2-2. The schematic of the equipment for X-ray reflectivity measurement at BL 37 XU in SPring-8. The inset demonstrates kinetics of the reflectivity.
Absorber Slit
PILATUS Ge(111)
Ring
Cell Water
Oil
Hydrophobized glass
15
The sample cell is made of stainless steel and equipped with Mylar windows. In specular reflection condition, the scattering vector 𝐐 = 𝐤scat− 𝐤in is only in normal to the interface (z-direction) and given by 𝑄z = (4𝜋 𝜆⁄ ) sin α, where 𝜆 (= 0.496 Å) is the X-ray wavelength used in the present study, and α is the incident angle. The measurement was carried out at given 𝑚PCw and 𝑚Cho under atmospheric pressure.
Temperature was controlled at 298.15 ± 0.1 K by the Peltier device equipped to the cell.
X-ray reflectivity 𝑅(𝑄z) measured as a function of 𝑄z can be interpreted to yield the electron density profile normal to the interface. Under the first Born approximation, 𝑄z is given by[45,46]
𝑅(𝑄z)
𝑅F(𝑄z)≈ | 1
𝜌w− 𝜌h∫d〈𝜌(𝑧)〉
d𝑧 exp(−𝑖Qz𝑧) d𝑧|
2
, (2 − 11)
where 〈ρ(𝑧)〉 is the electron density profile averaged over the interfacial plane along with z-direction which is normal to the interface, 𝜌w and 𝜌h are respectively the electron densities of bulk water and hexane phases, and 𝑅F(𝑄z) is Fresnel reflectivity for an ideally smooth interface expressed as[46,47]
𝑅F(𝑄z) ≈ |𝑄z− 𝑄zT 𝑄z+ 𝑄zT|
2
, (2 − 12)
where 𝑄zT is the z-component of the scattering vector with respect to the lower phase given by
𝑄zT = √𝑄z2− 𝑄c2 , (2 − 13)
where the scattering vector at critical angle 𝑄c is calculated by using the difference of bulk densities Δ𝜌 (= 𝜌w− 𝜌h) as 𝑄c ≈ 4√𝜋Δ𝜌𝑟e, where 𝑟e is the classical electron radius 𝑟e = 2.818 fm.
16
The adsorbed films at the C6/W interface are modeled by 𝑛 slabs. Interfaces at the top and bottom of each slab will be fluctuated with thermally exited capillary waves[48,49], which broaden the interface with an error function of interfacial roughness 𝜎. Thus, the electron density for 𝑛-slab model is given by
〈ρ(𝑧)〉 =1
2(𝜌w+ 𝜌h) +1
2∑(𝜌𝑖− 𝜌𝑖+1)
𝑛
𝑖=0
erf (𝑧 + ∑𝑖𝑗=0𝐿𝑗
√2𝜌 ) (2 − 14) with
erf(𝑧) = 2√𝜋 ∫ 𝑒−𝑡2
𝑧 0
d𝑡 , (2 − 15)
where 𝜌𝑖 and 𝐿𝑖 are the electron density and thickness of slab 𝑖, respectively.
The interfacial roughness 𝜎 is usually considered to be the combination of two different contributions; the intrinsic profile width 𝜎0 and the resolution dependent capillary wave contribution 𝜎cap. In this the hybrid model, 𝜎cap is expressed as
𝜎cap2 ≈𝑘B𝑇 2𝜋𝛾(𝑞max
𝑞min) , (2 − 16)
where 𝛾 is the interfacial tension at the C6/W interface, 𝑘B𝑇 is the Boltzmann constant times temperature, 𝑞min= (2𝜋 𝜆⁄ )Δβ sin α with the angular acceptance of the detector Δβ = 6.37 × 10⁻⁴. 𝑞max is determined by the cut off for the smallest wavelength of capillary waves that the interface can support and given by 𝑞max= 2𝜋 𝑙⁄ Å−1, where 𝑙 is an approximate size of hexane molecule (~5 Å).
In the case of laterally heterogeneous interface consisting of the domain and surrounding phase, another analysis of 𝑅(𝑄z) can be applied. If the domain size is much smaller than the spatial coherent length of the X-ray in the plane of the interface the domain size, the X-ray reflected from the domain and surrounding phase interfere nearly
17
coherently. In this case, the amplitudes of reflected electromagnetic fields should be added, and then, the coherent X-ray reflectivity 𝑅coh(𝑄z) is given by[37]
𝑅coh(𝑄z) = [𝐶XR𝑟1(𝑄z) + (1 − 𝐶XR)𝑟2(𝑄z)]2 (2 − 17) where 𝑟1(𝑄z) and 𝑟2(𝑄z) are the reflection amplitudes of the domain and surrounding phase respectively, and 𝐶XR is the area coverage of domain 1 in the adsorbed film. On the other hand, if the domain size is much larger than the coherent length of X-ray, the interference between neighboring phases is incoherent. Then, incoherent reflectivity 𝑅inc(𝑄z) is provided by[37]
𝑅inc(𝑄z) = 𝐶XR𝑅1(𝑄z) + (1 − 𝐶XR)𝑅2(𝑄z) (2 − 18) where 𝑅1(𝑄z) and 𝑅2(𝑄z) are the X-ray reflectivity from the domain and surrounding phase, respectively.
Brewster Angle Microscopy
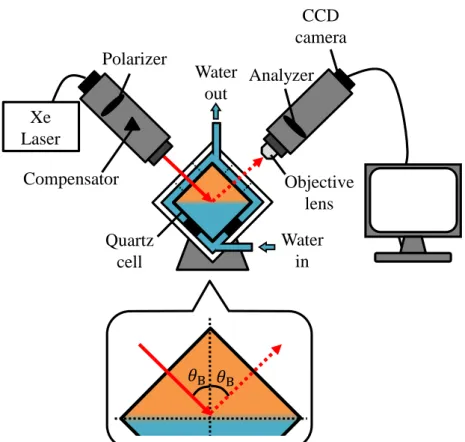
The observation of the adsorbed film at the C6/W interface was performed with using Brewster angle microscope (BAM), Nanofilm EP4 Imaging Ellipsometer (Acurrion, Goettingen, Germany) constructed by Xenon laser at 658 nm, polarizer, compensator, analyzer, and CCD camera, equipped with 10x 0.21 N.A. objective lens (Nikon, Japan).
This setup fixed the pixel size to be ~0.72 μm. Both aqueous and hexane solutions were contained in the rectangular quartz glass cell purchased from Starna Scientific Ltd.
(Hainault, UK). The cell was placed on a stage which align the cell windows to the beam path as shown in Figure 2-3. Temperature was controlled by circulating thermostated water in the jacket around the cell.
Polarizer, analyzer and compensator were respectively adjusted to be 10°, 10°, and 0° with 0.04~0.1 sec. of exposure time, to acquire an image with enough contrast
18
Figure 2-3. The schematic of the equipment of Brewster angle microscope and the optical setup in the inset.
Water in Water
out
CCD camera
Objective lens Xe
Laser
Quartz cell Polarizer
Compensator
Analyzer
19
between two coexisting domains. Brewster angle 𝜃B for pure C6/W interface at 298.15 K, at which no p-polarized light is reflected from the interface, was estimated to be 𝜃B = 44.2° by 𝜃B = arctan(𝑛w⁄𝑛o), where 𝑛w and 𝑛o are respectively the refractive indexes of water and hexane[3,50,51]. Furthermore, in order to ensure equilibrium film state, thermal annealing was carried out before the observation; the cell was heated and cooled few times, and then was turned to 298.15 K over 1 hour. The contrast of the acquired image was enhanced by using Image J software[52].
Line Tension in Monolayer
In the heterogeneous film, the domain line tension is a crucial factor to determine domain morphology. According to theoretical study by McConnell et al.[53], an equilibrium domain size is governed by the line tension 𝜏, which consists of two competitive effects; (i) a contact energy 𝜏0 associated with the contact of a domain with its surrounding phase, which shrinks the total length of domain boundary, and (ii) the dipole – dipole repulsion between neighboring molecules at domain boundary 𝜏el, which extends the length of domain boundary. The 𝜏0 value is roughly evaluated by[38]
𝜏0 ≈ 𝛾DS× ∆𝐿 , (2 − 19)
where 𝛾DS is the interfacial tension between the domain and its surrounding phase and
∆𝐿 is contact length between coexisting phases. For nonpolar compounds, the 𝛾DS value is roughly estimated by using
𝛾DS≈ 𝛾α+ 𝛾β− 2√𝛾α𝛾β , (2 − 20) where 𝛾α and 𝛾β are the surface tensions of component α and β. 𝜏el for an isolated circler domain with a radius 𝑅 is expressed as[54]
𝜏el = 𝑢2
4𝜋𝜀0𝜀ln (𝑒2∆
4𝑅) , (2 − 21)
20
where 𝑢 is a difference of dipole densities perpendicular to the interface between two coexisting phase, 𝜀0 is permittivity in vacuum, 𝜀 is a relative permittivity of medium in which the dipole exists, and ∆ is a cut-off distance between dipoles. Then, the equilibrium domain radius 𝑅eq is given by[48,54];
𝑅eq≈ 5∆ exp (4𝜋𝜀0𝜀𝜏0
𝑢2 ) . (2 − 22)
If 𝜏0 is more dominant than 𝜏el, the formation of large domains is preferable, and if 𝜏el is superior to 𝜏0, the domains with complicated shapes such as stripe and dendritic domains or many tiny domains are favorable.
21
2-3. Results and Discussion on Pure systems State of Adsorbed Films
Figure 2-4 shows the 𝛾 vs. 𝑚PCw and 𝛾 vs. 𝑚Cho curves of pure C14PC and Chol systems. As indicated by an arrow, the curve 1 has a kink point at 𝑚PCw ≈ 0.0017 mmol kg−1 corresponding to a phase transition of adsorbed film. The 𝛾 value decreases steeply with increasing 𝑚PCw , and becomes almost constant above another kink point at 𝑚PCw ≈ 0.11 mmol kg−1, which corresponds to critical micelle concentration (CMC)[2,6,55]. In the previous study on the structure of adsorbed CnPC film at the tetradecane/water (C14/W) and air/water (A/W) interfaces[2,6], the 𝛾 vs. 𝑚PCw curve has an inflection point at 𝑚PCw ≈ 0.08 mmol kg−1 below CMC. From the electron density profile obtained by XR, it was suggested that CnPC molecules form bilayer in which charge-separated phosphocholine groups take upside-down arrangement to interact attractively between their neighbors. At the C6/W interface, the 𝛾 vs. 𝑚PCw curve shows no inflection point even at concentration just below CMC, indicating that bilayer formation does not take place at the interface. The curve of pure Chol system has two distinct kink points at 𝑚Cho = 0.55 and 0.95 mmol kg−1, indicating that the adsorbed Chol film takes three kinds of film sates depending on 𝑚Cho .
To assign state of adsorbed films, the interfacial density ΓH values were calculated by eqs. (2 − 3) and (2 − 4), and then the interfacial pressure 𝜋 vs. mean area per molecule 𝐴 curves were constructed by using eqs. (2 − 5) and (2 − 6). The results are shown in Figures 2-5 and 2-6, respectively. In the pure C14PC system (curve 1), the ΓH value increases with 𝑚PCw and changes discontinuously at the phase transition point.
Above this point, the value converges into about 3.0 μmol m−2. It is seen from the 𝜋 vs.
𝐴 curves that the 𝐴 value decreases steeply with increasing 𝜋 below and changes
22
Figure 2-4. (1) The 𝛾 vs. 𝑚PCw curve in the pure C14PC, and (2) the 𝛾 vs. 𝑚Cho curve in the pure Chol systems. Arrows indicate the kink points corresponding to the phase transition points and CMC. The inset expands the phase transition points on both curves.
0 5 10 15 20
0 5 10 15 20 25 30 35 40 45 50
0 0.02 0.04 0.06 0.08 0.1 0.12 0.14 0.16
(2)
(1)
0 0.5 1 1.5 2
35 40 45 50
0 0.002 0.004
23
Figure 2-5. (1) The ΓH vs. 𝑚PCw curve in the pure C14PC, and (2) ΓH vs. 𝑚Cho one in the pure Chol systems.
(1) (2)
0 5 10 15 20
0 0.5 1 1.5 2 2.5 3 3.5 4 4.5 5
0 0.005 0.01 0.015 0.02 0.025 0.03
24
Figure 2-6. The 𝜋 vs. 𝐴 curves (1) in the pure C14PC and (2) in the pure Chol systems.
(1)
(2)
0 5 10 15 20 25 30 35 40 45 50
0 100 200 300 400 500 600
25
discontinuously at the phase transition point (𝜋eq ≈ 5 mN m−1). Above this point, the 𝜋 value increases gradually with decrease in 𝐴. The limited 𝐴 value (≈ 55 Å2) is larger than the cross-sectional area of C14PC molecule (≈ 35 Å2). Thus, it is assumed that the adsorbed C14PC film shows the phase transition from gaseous (G) to expanded (E) states.
In the pure Chol system (curve 2), the ΓH value changes discontinuously at the phase transition points, and converges into around 4.5 μmol m−2. The 𝜋 vs. 𝐴 curve consists of three parts connected by two discontinuous changes. Above the second transition at 𝜋eq ≈ 3.5 mN m−1, the curve becomes almost vertical with an 𝐴 value of about 37 Å2, which is very close to that observed for the condensed (C) state of Langmuir Chol film (𝐴 = 38 Å2)[56]. Thus, it is suggested that the adsorbed Chol film exhibits the G – E transition at low and E – C phase transitions at high 𝜋, respectively.
Structure of Adsorbed Films
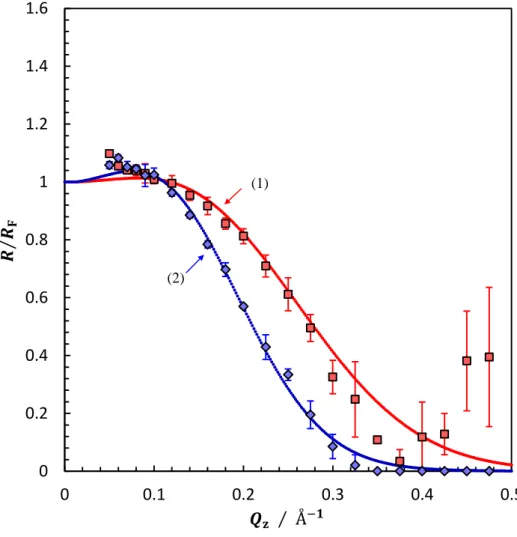
The microscopic structure of the adsorbed film at the C6/W interface was investigated by XR. In Figure 2-7 are shown the 𝑅 𝑅⁄ 𝐹 vs. 𝑄𝑧 plots measured at 𝑚PCw = 0.005 and 0.03 mmol kg−1. Both plots were fitted well by one-slab model, in which the adsorbed film is assumed to consists of one slab with uniform electron density and thickness[37,39]. In this model, the thickness of the slab 1 𝐿1, the electron density normalized by that of pure water 𝜌1⁄𝜌w, the interfacial roughness between the slab 1 and lower water phase 𝜎1, and that between the slab 1 and upper hexane phase 𝜎2 were employed as fitting parameters. The electron density profiles obtained are shown in Figure 2-8, and the fitted parameters are listed in Table 2-1, together with 𝜌1⁄𝜌w and 𝜎𝑖 values estimated by interfacial tension data. It is reasonably assumed that the contrast of electron density between liquid hexane and hydrocarbon chain of C14PC molecule is very
26
Figure 2-7. The 𝑅 𝑅⁄ 𝐹 vs. 𝑄𝑧 plots in the pure C14PC system (1) at 𝑚PCw = 0.005 and (2) at 0.03 mmol kg−1. The dotted lines represent the fitting curves.
0 0.2 0.4 0.6 0.8 1 1.2 1.4 1.6
0 0.1 0.2 0.3 0.4 0.5
(1)
(2)
27
Figure 2-8. The electron density profiles normal to the interface in the pure C14PC system (1) at 𝑚PCw = 0.005 and (2) at 0.03 mmol kg−1.
-40 -30 -20 -10 0 10 20
0.6 0.7 0.8 0.9 1 1.1 1.2
-40 -30 -20 -10 0 10 20
0.6 0.7 0.8 0.9 1 1.1 1.2
28 SystemFilm State
Slab 1Slab 2 Pure C14PC
E E Pure Chol
G E C C
Table2-1.Thefittingparametersfortheslabmodel.Theand()valuewascalculateduand, andwasputintoparentheses.
29
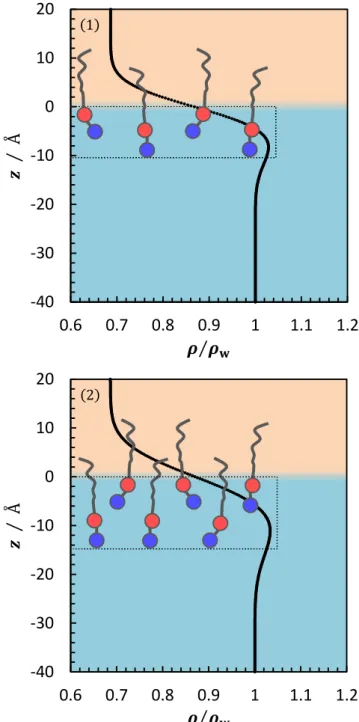
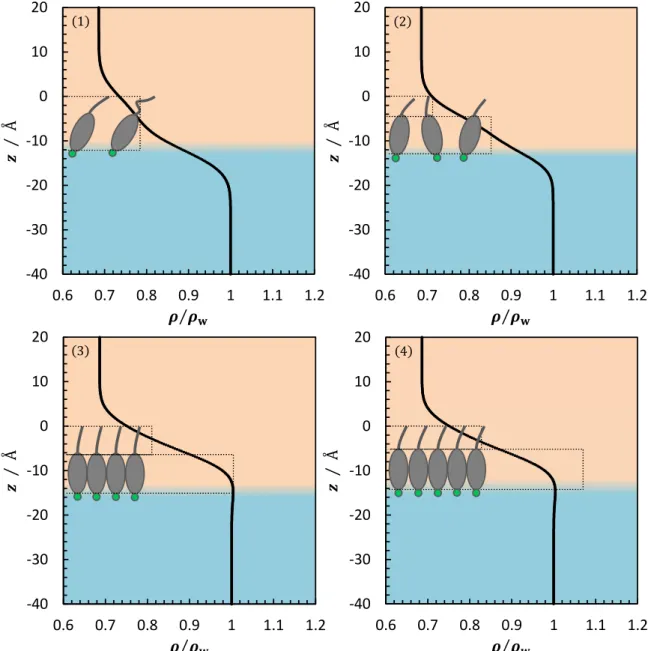
small in the expanded state and thus the slab 1 corresponds to phosphocholine (PC) group of adsorbed C14PC molecules. The 𝐿1 values at both 𝑚PCw are much larger than the length of PC group (~7 Å)[57], indicating that C14PC molecules take staggered arrangement to reduce the electrostatic repulsion between charges-separated head groups, as schematically demonstrated in Figure 2-8. The 𝜌1⁄𝜌w values agree well with the calculated ones by interfacial density (see Table 2-1). Furthermore, it is noted that the 𝐿1 value is smaller at 𝑚PCw = 0.005 than at 0.03 mmol kg−1, suggesting that staggered arrangement become more remarkable with reducing intermolecular distance at high ΓH. In the case of pure Chol system, the 𝑅 𝑅⁄ 𝐹 values measured in the G, E, and C states are plotted against 𝑄𝑧 in Figure 2-9. The solid lines are the fitted curve and the corresponding electron density profiles are shown in Figure 2-10. The fitted parameters are listed in Table 2-1. In the G state at 𝑚Cho = 0.4 mmol kg−1, the 𝑅 𝑅⁄ 𝐹(𝑄𝑧) plots was fitted well by one-slab model. Because the electron density of hydroxyl (OH) group is almost same as that of bulk water phase, it is likely that the slab 1 represents the hydrophobic parts of Chol molecule. The 𝐿1 value (12.3 Å) is smaller than the total lengths of sterol (~9 Å) and tail (~6 Å) parts of molecule[56,58]. The 𝜌1⁄𝜌w value estimated using ΓH is 0.73 consistent with the fitting value (0.78). Thus, Chol molecules are expected to take very loose packing and tilt from interface normal.
For both E and C states, the two-slab model, in which the film is assumed to have a structure consisting of two slabs with uniform thicknesses and electron densities[37,39], gives good fitting to the 𝑅 𝑅⁄ 𝐹(𝑄𝑧) plots. The 𝐿1 and 𝐿2 values are respectively very close to the lengths of sterol and tail parts, suggesting that the Chol molecules are arranged in almost vertical to the interface. The 𝜌1⁄𝜌w and 𝜌2⁄𝜌w values in the E state at 𝑚Cho = 0.85 mmol kg−1 agree well with those estimated for liquid mixture of Chol
30
Figure 2-9. The 𝑅 𝑅⁄ 𝐹(𝑄𝑧) plots in the pure Chol system (1) at 𝑚Cho = 0.4, (2) 0.85, (3) 1.0, and (4) at 2.0 mmol kg−1. The dotted lines represent the best fitting curves. The white triangles demonstrate the 𝑅Coh(𝑄𝑧) plots at 𝐶XR = 0.5.
0 0.2 0.4 0.6 0.8 1 1.2 1.4 1.6
0 0.1 0.2 0.3 0.4 0.5
(1)
(2)
(4)
(3)
31
Figure 2-10. The electron density profiles normal to the interface for the pure Chol system (1) at 𝑚Cho = 0.4, and (2) 0.85, (3) 1.0, and (4) at 2.0 mmol kg−1.
-40 -30 -20 -10 0 10 20
0.6 0.7 0.8 0.9 1 1.1 1.2 -40 -30 -20 -10 0 10 20
0.6 0.7 0.8 0.9 1 1.1 1.2
-40 -30 -20 -10 0 10 20
0.6 0.7 0.8 0.9 1 1.1 1.2 -40 -30 -20 -10 0 10 20
0.6 0.7 0.8 0.9 1 1.1 1.2
32
and hexane. The values in the C state (𝑚Cho = 1.0 and 2.0 mmol kg−1), on the other hand, are very close to those calculated for the solid Chol state. Thus, it is reasonable that in the C film, hydrophobic part of the molecule are densely packed with each other.
The 𝑅 𝑅⁄ 𝐹(𝑄𝑧) values measured at 𝑚Cho = 0.85 and 1.0 mmol kg−1 just below and above the E – C phase transition point take intermediate value between those at 0.4 and 2.0 mmol kg−1. Thus, we tried to fit them by domain models with coherent and incoherent interferences, expressed by eqs. (2 − 17) and (2 − 18), respectively. In these procedures, only the coverage of the C domain 𝐶XR was employed as a fitting parameter, and the reflectivity measured at well below and above the transition point were used as references 𝑅1 (or 𝑟1) and 𝑅2 (or 𝑟2). The 𝑅 𝑅⁄ 𝐹(𝑄𝑧) plots at 𝑚Cho = 1.0 mmol kg−1 was successfully fitted by coherent model using the amplitudes 𝑟𝑖 (𝑖 = 1, 2) at 𝑚Cho = 2.0 and 0.85 mmol kg−1. The results are shown by the white triangles in Figure 2-9, and 𝐶XR = 0.5 was obtained.
The interfacial density can be calculated by
ΓXRH = 𝐶XRΓH,1+ (1 − 𝐶XR)ΓH,2 , (2 − 23) where ΓH,1 and ΓH,2 are respectively the interfacial densities of Chol at 𝑚Cho = 2.0 and 0.85 mmol kg−1, and ΓXRH = 3.2 ± 0.3 μmol m−2 was obtained (see Table 2-2).
This is a little smaller than that evaluated from the interfacial tension data ΓH (3.9 ± 0.1 μmol m−2). Thus, it is highly expected that the condensed state just above the E – C phase transition point is heterogeneous film in which E domains are surrounded by the C region. The morphology of the film is observed by BAM in the latter part of this thesis.
33
Table 2-2.A list of , , and at .
34
Domain Structure of Adsorbed Chol Film
The heterogeneous structure of the adsorbed Chol film was further examined by BAM. In Figure 2-11, typical images observed at 𝑚Cho = 0 , 0.8 , 0.9 and 1.0 mmol kg−1 are shown. Interference patterns in all images indicate the existence of thick particles such as air bubble and artificial granule[59,60].
The images below 𝑚Cho = 0.9 mmol kg−1 are homogeneous within a spatial resolution limited by pixel size of CCD camera (0.72μm). In contrast, the image at 𝑚Cho = 1.0 mmol kg−1 looks heterogeneous and dark circular domains with m size are dispersed. Taking account of that the adsorbed film is in the C state just above the E – C phase transition, the dark domains should be low density E phase surrounded by high density condensed one. The fraction of area covered by bright region 𝐶BAM was estimated by averaging over 10 images and about 0.9~0.95. Furthermore, ΓBAMH value calculated by ΓBAMH = 𝐶BAMΓH,1+ (1 − 𝐶BAM)ΓH,2 was 4.2 ± 0.1 μmol m−2, which is very close to that estimated by interfacial tension data, confirming that the condensed Chol film just above the E – C transition point is heterogeneous; the E domains are dispersed into the C region.
In the previous study on the adsorbed film of FC10OH at the C6/W interface, it was found that the E state is a heterogeneous film in which C domains of FC10OH are surrounded by low density G region. This is mainly driven by weak interaction between FC10OH and hexane molecules[37,38]. In contrast to this, in the present system, a low density E domains are surrounded by C region, i.e., a kind of hole formation was found in the C state just above the E – C transition point. Thus, it is expected that the hole formation is induced by preferable interaction between Chol and hexane molecules at the interface.
35
Figure 2-11. Typical images of adsorbed Chol film (1) at 𝑚Cho = 0 (pure C6/W interface), (2) 0.8, (3) 0.9, and (4) at 1.0 mmol kg−1.
36
Finally, let us briefly mention the line tension of the Chol system. First, a median of domain radius of over 100 domains (7.2 ± 0.5 μm) was calculated based on a domain size distribution in Figure 2-12 and was assigned to equilibrium one 𝑅eq. Using a dipole moment of OH group normal to the interface 𝑢OH (1.4 D), that of terminal-methyl group 𝑢CH3 (0.4 D), relative permittivity of water 𝜀w (80) and hexane 𝜀o (1.9), and the cut – off distance between dipole ∆ (7 Å) into eq. (2 − 21)[3], the dipole – dipole repulsions in water 𝜏elw and in hexane 𝜏elo were separately estimated to be −0.05 and −0.53 pN.
Then, a 𝜏0 value of 0.51 pN was obtained by substituting 𝑅eq and 𝜏el(= 𝜏elw+ 𝜏elo) values into eq. (2 − 22). The 𝜏0 value was also roughly estimated to be 0.21~0.54 pN by eq. (2 − 19), where a thickness mismatch between C and E domains ∆𝐿 of ~1Å and the interfacial tension between the C domain and the surrounding (hexane) 𝛾DS (2.1~5.4 mN m−1). The absolute values of 𝜏0 and 𝜏el is close to each other, which may induce a little amount of small circular E domain formation at the interface.
37
Figure 2-12. Domain radius 𝑅 distribution at 𝑚Cho = 1.0 mmol kg−1 constructed by 100 domains data. This distribution gave us 7.2 ± 0.5 μm of median of domain radius.
0 0.1 0.2 0.3 0.4
38
2-4. Results and Discussion on C14PC – Chol mixed system Film State and Molecular Miscibility
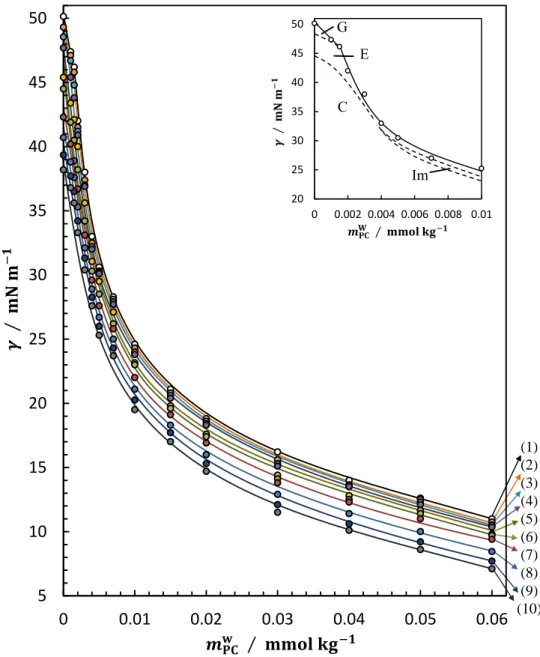
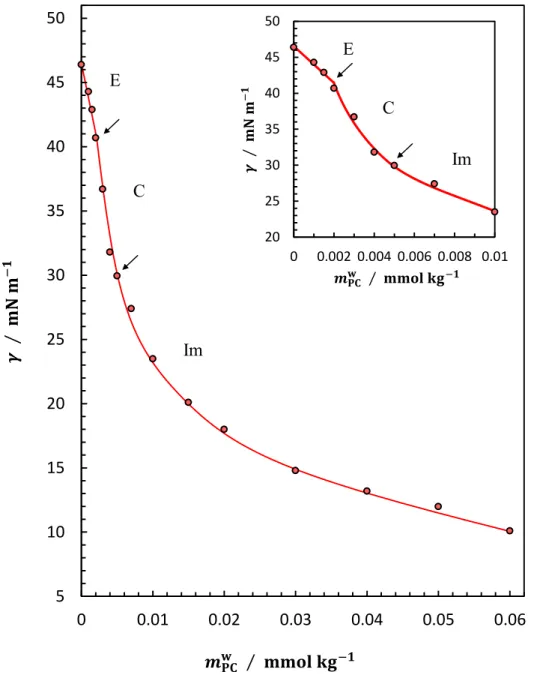
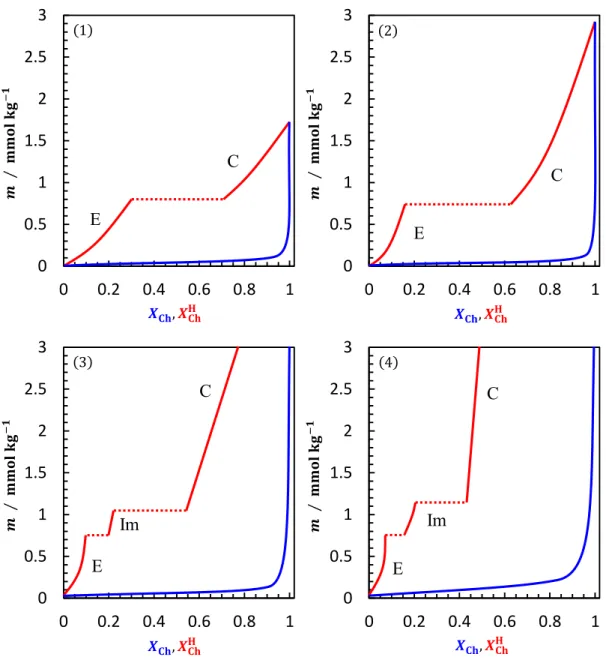
Figure 2-13 shows the 𝛾 vs. 𝑚Cho curves at given 𝑚PCw and 298.15 K under atmospheric pressure. With increasing 𝑚Cho , the 𝛾 value decreases slightly at low and largely at high 𝑚Cho . Each curve has one or two kink points due to the phase transitions in the adsorbed film as connected by dotted lines. It is realized that four kinds of film states denoted by G, E, Im, and C appear depending on 𝑚Cho and 𝑚PCw . Four interfacial states will be assigned later. The 𝛾 value read from the 𝛾 vs. 𝑚Cho curves at given 𝑚Cho are plotted against 𝑚PCw in Figures 2-14-1 and 2-14-2. The 𝛾 value decreases very steeply at low and gradually at high 𝑚PCw with increasing 𝑚PCw. The curve at 𝑚Cho = 0.8 mmol kg−1 in Figure 2-14-2 has a distinct break point of the E – C phase transition at low 𝑚PCw (= 0.002 mmol kg−1), although the kink corresponding to the C – Im transition at high 𝑚PCw , which is appeared on the 𝛾 vs. 𝑚Cho curves, is obscure.
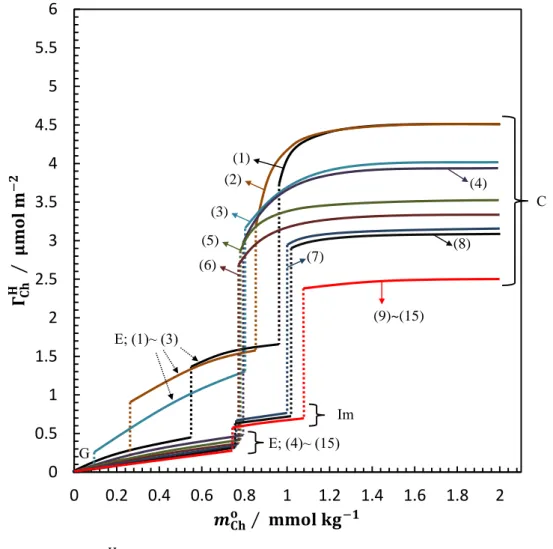
In Figure 2-15 are shown the ΓChH vs. 𝑚Cho curves at constant 𝑚PCw. The ΓChH value increases gradually with increasing 𝑚Cho and changes discontinuously at the phase transition points. Furthermore, the ΓChH value at given 𝑚Cho reduces with increasing 𝑚PCw . The dependence of ΓPCH on 𝑚PCw are clearly shown in Figure 2-16. The ΓPCH value increases steeply at low and converges into around 3.2 μmol m−2 at high 𝑚PCw ; the values at 𝑚PCw = 0.4 and 0.6 mmol kg−1 correspond to E, those at 0.8 and 1.0 mmol kg−1 to Im, and those above 1.2 mmol kg−1 to C state. It should be noted that the ΓPCH value increases continuously even at the C – Im transition (curves 5 and 6), although it changes discontinuously at the G – E (curves 1 ~ 3) and E – C phase transition points (curve 5).
39
Figure 2-13. The 𝛾 vs. 𝑚Cho curves at given (1) 𝑚PCw = 0 (pure Chol system), (2) 0.001, (3) 0.0015, (4) 0.002, (5) 0.003, (6) 0.004, (7) 0.005, (8) 0.007, (9) 0.01, (10) 0.015, (11) 0.02, (12) 0.03, (13) 0.04, (14) 0.05, and (15) at 0.06 mmol kg−1. The dotted lines connect the phase transition points of the film.
G
E
C Im
5 10 15 20 25 30 35 40 45 50
0 0.2 0.4 0.6 0.8 1 1.2 1.4 1.6 1.8 2
(1) (2) (3) (4) (5) (6) (7) (8)
(9) (10) (11) (12) (13) (14) (15)
40
Figure 2-14-1. The 𝛾 vs. 𝑚PCw curves at given (1) 𝑚Cho = 0 (pure C14PC system), (2) 0.2, (3) 0.4, (4) 0.6, (5) 1.0, (6) 1.2, (7) 1.4, (8) 1.6, (9) 1.8, and (10) at 2.0 mmol kg−1. The dotted lines in the inset, dividing the 𝛾 vs. 𝑚PCw graph into four kinds of film state regions, are drawn by tracing the corresponding lines in Figure 2-13.
(1) (2) (3) (4) (5) (6) (7) (8) (9)
5 (10)
10 15 20 25 30 35 40 45 50
0 0.01 0.02 0.03 0.04 0.05 0.06
20 25 30 35 40 45 50
0 0.002 0.004 0.006 0.008 0.01 G
E C
Im