九州大学学術情報リポジトリ
Kyushu University Institutional Repository
MINIMIZING POWER CONSUMPTION OF THE ORGANIC OPTOELECTRONIC PULSE METER
ファハド, エス, エー, エルサムナ
https://doi.org/10.15017/2534467
出版情報:九州大学, 2019, 博士(学術), 課程博士 バージョン:
権利関係:
MINIMIZING POWER CONSUMPTION OF THE ORGANIC OPTOELECTRONIC PULSE METER
BY
FAHED S. A. ELSAMNAH
KYUSHU UNIVERSITY
2019
i
MINIMIZING POWER CONSUMPTION OF THE ORGANIC OPTOELECTRONIC PULSE METER
BY
FAHED S. A. ELSAMNAH
A Thesis Submitted to the Interdisciplinary Graduate School of Engineering Sciences (IGSES) at Kyushu University in Partial
Fulfillment of the Requirements for the Degree of DOCTOR OF PHILOSOPHY
in Engineering
DEPARTMENT OF APPLIED SCIENCE FOR ELECTRONICS AND MATERIALS, INTERDISCIPLINARY GRADUATE SCHOOL OF ENGINEERING SCIENCES,
KYUSHU UNIVERSITY FUKUOKA, JAPAN
2019
ii
MINIMIZING POWER CONSUMPTION OF THE ORGANIC OPTOELECTRONIC PULSE METER
BY
FAHED S. A. ELSAMNAH
A Thesis Submitted to the Interdisciplinary Graduate School of Engineering Sciences (IGSES) at Kyushu University in Partial
Fulfillment of the Requirements for the Degree of
DOCTOR OF PHILOSOPHY in Engineering
Under the Supervision of Prof. Dr. Reiji Hattori
………
Professor
Department of Applied Science for Electronics and Materials Faculty of Engineering Sciences,
Kyushu University
INTERDISCIPLINARY GRADUATE SCHOOL OF ENGINEERING SCIENCES, KYUSHU UNIVERSITY
FUKUOKA, JAPAN
July - 2019
iii
ACKNOWLEDGEMENT
First of all, I would like to express my thankfulness to God for granting me the ability to finish my Ph.D. thesis. My foremost appreciation goes to Prof. Reiji Hattori, my supervisor, for his academic guidance and many other supports throughout my Ph.D.
program. This thesis could not have been completed without his guidance and insightful instructions throughout my research. My special thanks are also due to our team research members; Anubha Bilgaiyan, Chang-Hoon Shim, Hiroshi Ishidai Muhamad Affiq, and Ryutaro Sugawara for their generous input and support during my research.
Also, a special thank goes to my friend Abdul Moudood from Griffith University for his suggestions and comments during my study. I would like to express my acknowledgment for Prof. Yuichi Harada and Prof. Dong Wang for the time and effort to review my thesis and give valuable comments and suggestions which helped to improve the quality of the thesis. I also would like to thank all the colleagues at Hattori Lab who helped me to accomplish my research successfully.
I am very indebted to the Department of Applied Science for Electronics and Materials (ASEM) and to the dean of Interdisciplinary Graduate School of Engineering Sciences (IGSES), Prof. Hideharu Nakashima, for facilitating of my research work.
I would like to thank the International Student and Researcher Support Centre and the Student Affairs Division of Chikushi Campus for their help and support during my study. I also would like to take this opportunity to thank the Japanese Ministry of Education, Culture, Sports, Science, and Technology (MEXT) for granting me a scholarship to support my research.
I am heavily indebted to my wife Noor and my parents, Samy and Nawal, and my brothers and sisters, for their continuous support and concern. My Ph.D. degree would not have been possible without the support of my wife, my parents and other members of my family.
iv
DEDICATION
To my wife Noor and my daughter Yafa and all my family members, my teachers and my friends with gratitude for their inspiration, guidance
and support.
v
ABSTRACT
A pulse oximetry sensor has become essential to medical electronics and wearable health monitoring devices. It is a noninvasive, inexpensive, convenient, and safe device for monitoring a person's health and avoiding any potential illness. The pulse oximeter is used to determine physiological parameters such as heart rate (bpm) and peripheral oxygen saturation (SpO2) of the patient at all times based on the photoplethysmogram (PPG) method. PPG signal is an essential bio-signal that can be used for detecting several heart diseases. It has become fundamental to wearable health monitoring devices. This research aims to minimize the power consumption of the organic optoelectronic pulse meter sensor, develop the driver circuit of the pulse meter, and monitor the PPG waveforms wirelessly. A reflectance type organic optoelectronic pulse meter was proposed to measure the PPG signals. A red (625 nm) organic light-emitting diode (OLED) and an organic photodiode (OPD) sensitive at the aforementioned wavelength were fabricated monolithically on a glass substrate. The external quantum efficiency (EQE) of the OLED and the OPD were 7% and 37%, respectively.
In this research, several design structures were compared for minimizing the power consumption and noise level of the biosensor pulse meter. The comparison was done on two pairs of different shaped structures. In the first pair, one device had a circle- shaped OLED, 0.03 cm2, in the center of the device and was surrounded by the OPD area of 0.16 cm2, while the other device had OPD in the center and surrounded by OLED at same size area. In the second pair, both devices had a circle-shaped OLED in the center of the device and were surrounded by OPD. One device had an OLED area of 0.06 cm2, while the other device had the half area. The gap distance between the OLED and OPD was 1.65 mm for the first device and 2 mm for the second one. Both devices have an OPD area of 0.16 cm2. The power consumption and the signal-to-noise ratio (SNR) were evaluated for all devices’ PPG signals, which were successfully acquired from fingertips and other body parts. Accordingly, the proposed reflectance-based organic pulse meter operated successfully at an ultra-low power consumption of 8 µW at 18 dB SNR and low power consumption of 0.1 mW at 62 dB.
The proposed organic pulse meter was implemented for wireless monitoring of the PPG signal and successfully presented compatible characteristics. Clear PPG waveforms were obtained from the portable pulse meter via Bluetooth low energy (BLE) at 500 SPS and 8-bit resolution on the receiver PC host. The maximum throughput data rate between the chip and the PC host was 256 kbps at the minimum connection interval of 7.5 ms. The proposed pulse meter showed accurate results of about 1.5% error of the pulse rate (PR) compared to the commercially reference we obtained. The SNR of the PPG signals were evaluated and compared for different parts of the body and successfully acquired clear PPG signals at those positions, where the best signal was obtained from the fingertips at an SNR of about 62 dB. Eventually, the proposed organic biosensor reduced the power consumption and improved the capability of the pulse meter for long-term use.
vi
TABLE OF CONTENTS
Acknowledgement ... iii
Dedication ... iv
Abstract ... v
Table of Contents ... vi
List of Tables ... viii
List of Figures ... ix
Lists of Abbreviations ... xi
CHAPTER ONE: INTRODUCTION ... 1
1.1 Overview of Pulse Meters ... 1
1.2 Motivation and Problem Statement ... 3
1.3 Research Objectives ... 4
1.4 Research Methodology... 4
1.5 Thesis Organization ... 6
CHAPTER TWO: LITERATURE REVIEW ... 7
2.1 Introduction ... 7
2.2 PPG Principle ... 7
2.3 Reflective Mode vs Transmissive Mode ... 12
2.4 Related Works on Pulse Oximeters ... 14
2.4.1 Organic Optoelectronics ... 15
2.4.2 Wireless Monitoring ... 17
2.4.3 Digital Filters ... 18
2.5 Summary ... 18
CHAPTER THREE: THE ORGANIC OPTOELECTRONIC DEVICES ... 20
3.1 Introduction ... 20
3.2 Optical Simulation ... 20
3.3 Characterization of the Organic Optoelectronic Devices... 24
3.3.1 OLED Characterization ... 25
3.3.2 OPD Characterization ... 30
3.4 Summary ... 31
CHAPTER FOUR: THE SYSTEM DESIGN ... 32
4.1 Introduction ... 32
4.2 The Driver Circuit ... 32
4.2.1 Transimpedance Stage ... 36
4.2.2 Filtration Stage ... 37
4.2.3 Amplification Stage ... 39
4.2.4 SPICE Simulation ... 42
4.2.5 Microcontroller Unit ... 46
4.2.6 Mechanical Part ... 49
4.3 Digital Filter ... 50
4.4 SNR Measurement ... 52
4.5 Pulse Rates Measurement ... 53
vii
4.6 Summary ... 56
CHAPTER FIVE: RESULTS AND DISCUSSIONS ... 57
5.1 Introduction ... 57
5.2 Comparative Results for Device-A and Device-B ... 57
5.2.1 Results of Device-A on Different Body Parts ... 59
5.3 Comparative Results for Device-A and Device-C ... 61
5.4 Acquiring PPG Signals from BLE ... 65
5.5 Summary ... 67
CHAPTER SIX: CONCLUSIONS AND Future Work ... 68
6.1 Conclusions ... 68
6.2 Contribution of the Thesis ... 72
6.3 Future Work ... 72
REFERENCES ... 74
PUBLICATIONS ... 80
viii
LIST OF TABLES
Table No. Page No.
Table 3.1: Summary of the approximated optical parameters of a human finger. ... 21
Table 5.1: Summary of the PPG signal’s quality for Device-A and Device-B. ... 58
Table 5.2: Summary of the PPG signal’s quality from different parts of the body. ... 61
Table 5.3: Summary of the PPG signal quality for Device-A and Device-C. ... 63
Table 5.4: Comparison table between our device and other devices. ... 65
ix
LIST OF FIGURES
Figure No. Page No.
Figure 1.1: The system structure of the pulse meter device. ... 2
Figure 2.1: Structure of the hemoglobin molecule that exists in the red blood cells, [11] ... 8
Figure 2.2: Light absorbance spectra of oxygenated hemoglobin (HbO2) and deoxygenated hemoglobin (Hb), [13] ... 9
Figure 2.3: The calibration curve for estimating SpO2 [16]. ... 10
Figure 2.4: Acquiring photoplethysmogram (PPG) signal from reflectance mode. ... 11
Figure 2.5: Schematic of light absorption in body tissues. ... 12
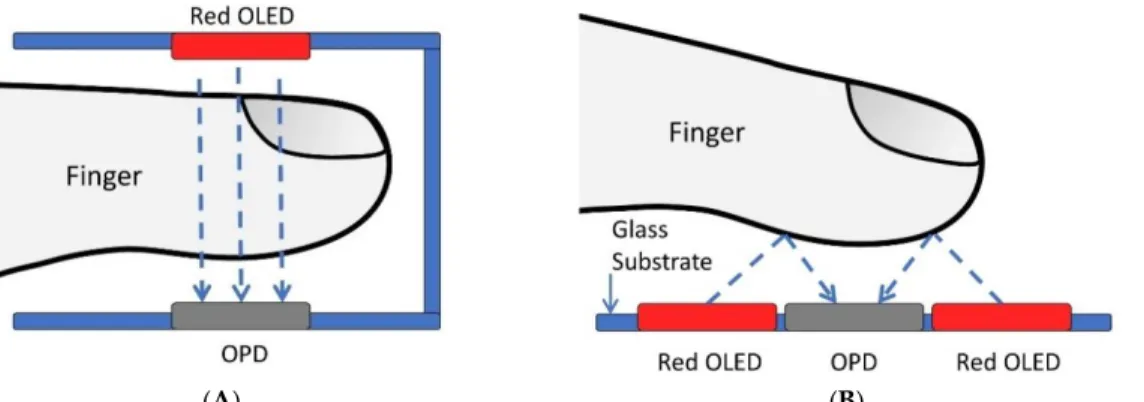
Figure 2.6: Obtaining the PPG signal based on an organic pulse meter: (A) Transmissive mode; (B) Reflective mode. ... 13
Figure 3.1: A simplified finger schematic model with the organic light-emitting diode (OLED) as the light object source and the organic photodiode (OPD) as the surface receiver for (A) Device-A; (B) Device-B and; (C) Device-C. ... 22
Figure 3.2: The optical simulation results at the receiver’s surface in Watt per mm2 and the dimensions of the OLED and OPD design structures for (A) Device-A; (B) Device-B and; (C) Device-C. ... 23
Figure 3.3: (A) The fabricated organic biosensor pulse meter for Device-A, Device-B, and Device-C. (B) A cross-section of the organic material structure of the OLED and OPD for all devices. ... 26
Figure 3.4: The OLED’s electroluminescence spectrum with respect to the wavelength (nm). ... 28
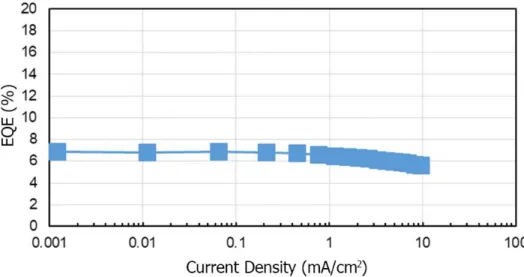
Figure 3.5: EQE of the OLED with respect to the current density (mA/cm2). ... 29
Figure 3.6: The current density (mA/cm2) of the OLED with respect to voltage. ... 29
Figure 3.7: The OPD’s external quantum efficiency (EQE) with respect to the wavelength for Device-A, Device-B, and Device-C. ... 30
Figure 4.1: The system structure of the PPG detector device. ... 32
Figure 4.2: An open-source schematic diagram for the pulse sensor [53]. ... 33
Figure 4.3: Two stages 2nd order bandpass filter (BPF) of Sallen-Key filter topology. ... 33
Figure 4.4: Two stages 2nd order BPF of multiple feedback (MFB) filter topologies. ... 33
Figure 4.5: Typical application circuit for APDS-9008, [54] ... 34
Figure 4.6: Bode Plots of two stages, 2nd order BPF, of MFB filter topology at; (A) 10 dB gain; (B) 50 dB gain. ... 35
Figure 4.7: The pulse meter’s driver circuit structure stages. ... 36
Figure 4.8: Basic transimpedance amplifier (TIA) circuit for a single supply. ... 37
Figure 4.9: Block diagram of an active low pass filter. ... 38
Figure 4.10: Block diagram of an active high pass filter, which acts as a differentiator. ... 39
Figure 4.11: Block diagram of an inverting operational amplifier. ... 39
Figure 4.12: A differentiation PPG signal from the 1st order LPF filter. ... 40
x
Figure 4.13: A PPG signal from the 2nd order LPF filter. ... 40
Figure 4.14: The simplified analog circuit for acquiring the PPG signal from the pulse meter. ... 41
Figure 4.15: The analog circuit for detecting the PPG signal that simulated on Multisim... 43
Figure 4.16: The Bode plot of the bandpass filter circuit. ... 44
Figure 4.17: Amplitude simulation of the circuit from “Vout_1” at “Channel_A” and “Vout_2” at “Channel_B”. ... 44
Figure 4.18: The schematic diagram of the PCB circuit. ... 45
Figure 4.19: The PCB circuit diagram of the pulse meter. ... 45
Figure 4.20: The schematic diagram of PSoC Creator program. ... 46
Figure 4.21: BLE 4.1 link layer PDU structure [59]. ... 48
Figure 4.22: The real measured payload throughput of the BLE module Ver.1 (CYBLE-022001-00). ... 49
Figure 4.23: The real measured payload throughput of the BLE module Ver.2 (CYBLE-214015-01). ... 49
Figure 4.24: The illustration and dimensions of the proposed pulse meter holder that used to fix the parts together. ... 50
Figure 4.25: Digital low-pass filter effect on the PPG signal, where the signal lost its morphological structure if the cut-off frequency (fc) was set very close to the carrier frequency. .. 51
Figure 4.26: Fast Fourier transform waveform to calculate the signal-to-noise ratio (SNR) of the PPG signal. ... 53
Figure 4.27: The algorithm flowchart for estimating the pulse rate average (PRA). ... 55
Figure 5.1: Comparison between the PPG signal from; (A) Device-A without a digital filter; (B) Device-B without a digital filter; (C) Device-A after applying a digital filter; and (D) Device-B after applying a digital filter. ... 58
Figure 5.2: Comparison between the PPG signal on different parts of the body: (A) Index finger; (B) Middle finger; (C) Little finger; (D) The forearm; (E) The wrist; and (F) The forehead. ... 60
Figure 5.3: Obtaining the PPG signal from (A) Device-A at a constant voltage source and (B) Device-C at a constant voltage source... 62
Figure 5.4: Comparison between the PPG signals from Device-A and Device-C at two different current sources for OLED; (A) at 2.4 μA and (B) at 93.6 μA. ... 63
Figure 5.5: Comparison of the signal-to-noise ratio (SNR) of the PPG signals from Device-A and Device-C at different OLED driving currents from 1.2 μA to 93.6 μA. ... 64
Figure 5.6: (A) The C# program shows PPG signal obtained from a universal serial bus (USB) dongle that was connected to the portable pulse meter via BLE; (B) PPG waveform after being recorded from the program as a comma-separated values (CSV) file. ... 67
xi
LISTS OF ABBREVIATIONS
2D two-dimensional AC alternating current
ADC analog-to-digital converter BLE Bluetooth low energy BPF bandpass filter
bpm beats per minute
CRC cyclic redundancy check
dB decibel
DC direct current
DFT discrete Fourier transform DWT discrete wavelet transforms ECG electrocardiogram
EQE external quantum efficiency FFT fast Fourier transform FIR finite impulse response GAP generic access profile GATT generic attribute HPF high pass filter HR heart rate
ICA independent component analysis IPA isopropyl alcohol
ITO indium-tin-oxide
L2CAP logical link control and adaptation layer protocol LED light-emitting diode
LPF low pass filter MCU microcontroller unit
OLED organic light-emitting diode OPD organic photodiode
PD photodiode
PDU protocol data unit
PLED polymer light-emitting diode PPG photoplethysmogram
PR pulse rate
SCB serial communication block SNR signal-to-noise ratio
SpO2 peripheral oxygen saturation SPS sample per second
TF transfer function
TIA transimpedance amplifier
UART universal asynchronous receiver-transmitter
1
CHAPTER ONE:
INTRODUCTION
1.1 OVERVIEW OF PULSE METERS
In general terms, the pulse meter is a device used to measure the rhythmic contraction and expansion of an artery at each beat of the heart based on the photoplethysmogram (PPG) principle. Nowadays, pulse meter can be used as a wearable health-monitoring device which can promote public health by facilitating a person’s health assessment based on their personal vital signs. It is a noninvasive, inexpensive, convenient, and safe device for monitoring a person's health and avoiding any potential illness. Several methods have been developed to measure heart rate, most of which are based on electrocardiogram (ECG), PPG, and the piezoelectric effect [1,2].
However, the ECG and piezoelectric sensors cannot be used to estimate the peripheral oxygen saturation (SpO2). Moreover, the ECG and piezoelectric sensors are very sensitive to any artificial muscle movements which might be unsuitable to be used as wearable devices. While the pulse meter uses one light source to estimate the heart rate (HR) based on the PPG principle, it can estimate the SpO2 by using two different wavelengths of light sources as a pulse oximeter.
The PPG signal is one of the crucial biosignals used for monitoring and evaluating the HR and SpO2 of the patient at all times, [3,4]. Meanwhile, there is a significantly increased concern in monitoring human performance during physical activity to improve the wearable medical devices for home care. Nowadays, pulse oximeters are being developed for continuously monitoring vital human signs, as comfortably and noninvasively. Furthermore, the PPG sensor can be easily embedded into wearable devices such as wristbands, finger clips, and ear clips, [5,6].
2
In recent years, organic pulse oximeters, that depend on the organic light-emitting diode (OELD) and organic photodiodes (OPD), received so much attention from many researchers due to the advantages of the organic optoelectronic devices including the relatively low cost, simple fabrication and ability to be fabricated on flexible substrates for comfortable wearable medical devices. Additionally, the OPD can be easily fabricated on a large size area compared to the restricted size of the general silicon- based photodiode (PD) which makes the OLED and OPD a preferable option for wearable pulse oximeters, [7–9].
The system structure of the PPG signal detector that we proposed in this work for a reflectance-based organic optoelectronic pulse meter device consists of three main parts; organic optoelectronic devices, driver circuit including microcontroller unit (MCU), and a display media; PC or mobile phone, as illustrated in Figure 1.1. The OLED and the OPD are fabricated on the same substrate and fixed with the readout circuit using an aluminum case for easy measuring and more protection from the ambient noise.
Figure 1.1: The system structure of the pulse meter device.
3
This thesis designs and fabricates an organic optoelectronic pulse meter device and evaluates its performance and signal quality. It also addresses the significance of the best designing of the OLEDs and the OPDs for pulse oximeter sensors in terms of power consumption and signal quality. The importance of using optical simulation is shown clearly in comparing the signal quality of an OLED with a high amount of light and an OLED with a low amount of light, and in comparing the signal quality of two devices with different gap distance between the OLED and the OPD. Therefore, designing an optimum OLED/OPD structure guided by optical simulation leads to the best results in terms of power consumption and signal quality.
1.2 MOTIVATION AND PROBLEM STATEMENT
The considerably increased concern for monitoring the vital signs in normal conditions as well as during physical activities has led to an enhancement of wearable medical devices and their performances for personal health care. Therefore, pulse oximeters, as wearable devices, have been developed to constantly monitor human performance both comfortably and noninvasively. Pulse oximeters provide accurate and reliable HR and SpO2 measurements for medical diagnosis and evaluation where medical professionals must have trust and confidence in the results reported by their instruments in order to make an accurate assessment for their patients. Furthermore, the pulse oximeter can be a very useful tool in monitoring and detecting certain disorders such as sleep apnea, which is detected by measuring the SpO2 in the blood.
Currently, there are various kinds of commercial pulse meter and pulse oximeter devices available on the market. However, there are still some issues with these kinds of pulse meters that need to be improved such as power consumption, signal quality, and the flexibility of the devices. Therefore, in order to make a flexible pulse meter, an
4
OLED and OPD are applied with the advantage of their flexibility and design freedom.
Moreover, the relatively low cost, simple fabrication, and lower power consumption of the OLEDs and OPDs make them preferable options for wearable pulse meters.
1.3 RESEARCH OBJECTIVES
This research project aims to contribute to the development of a new organic optoelectronic design structure for minimizing the power consumption of the pulse oximeters. The objectives of this research project can be summarized as follows:
1. To design and fabricate organic optoelectronic devices that are used for developing the pulse meter.
2. To improve the power consumption of the proposed organic optoelectronic device.
3. To develop the driver circuit for the pulse meter with the minimum power consumption and monitor the PPG waveform wirelessly.
4. To evaluate the performance of the proposed portable device in terms of its precision and power consumption.
1.4 RESEARCH METHODOLOGY
This research has been focusing on reducing the power consumption and the noise level of the organic optoelectronic pulse meter device by improving the driving circuit and the design structure of the OLED and OPD with the guidance of optical simulation to get the best results. The methods used for this research are summarized as follows:
1. Performing a detailed investigation of previous and existing works related to developing pulse oximeter devices.
5
2. Conducting performance and characteristic evaluations of the fabricated OLED and OPD devices that guided by optical simulation. If the device does not meet the required characteristics, it will be refabricated.
3. Developing and evaluating the driver circuit for the organic optoelectronic device. If the driver circuit does not meet the specifications, the circuit will be redeveloped.
4. Comparing three different pulse meter design structures in order to improve power consumption and signal quality. One device has a circle-shaped OLED in the center of the device and surrounded by the OPD, while the second one has the opposite structure. The third device has a bigger circle-shaped OLED in the center of the device and surrounded by the OPD with a shorter gap distance between the OLED and the OPD.
5. Measuring the power consumption of the optoelectronic device, and measuring the signal-to-noise ratio (SNR) of the acquired PPG signal using the fast Fourier transform (FFT) technique.
6. Obtaining PPG signals from different parts of the body and evaluating the signal quality among them.
7. Developing a C# program for connecting the proposed potable pulse meter with the PC host via Bluetooth low energy (BLE) module in order to send the PPG waveforms wirelessly, and verifying the performance of the received wireless signal.
8. Publishing two journal papers, two conference papers, and writing the Ph.D.
dissertation.
6 1.5 THESIS ORGANIZATION
This thesis consists of six chapters organized as follows:
Chapter One begins by giving a brief overview of the study, motivation and problem statement, objectives of the research and followed by the research methodology.
Chapter Two comprises literature review and related works, where the previous works on pulse oximeter systems, PPG principle, reflective type, transmissive type, organic optoelectronic, driving circuits, and digital filters are discussed in detail.
Chapter Three discusses the results of the optical simulation that lead to the best design structure in terms of power consumption and signal quality. Following that, the proposed design structure of the organic optoelectronic pulse meter and the characteristics of the device performance are presented.
Chapter Four discusses the system design which developed for the proposed organic pulse meter. The driver circuit and its stages were explained thoroughly. Also, Chapter Four illustrates the approach of measuring the SNR, the algorithm for measuring the heart rates, the data traffic of the BLE, and designing the digital filter that applied to the system.
Chapter Five contains the results of the proposed system’s performance and accuracy. It compares the proposed design structures and discusses the results of the obtained PPG signal from several parts of the body along with comparing the PPG signal that has been acquired wirelessly via BLE.
Chapter Six presents the outcomes of the work presented in this dissertation.
Thesis contribution to the current state of knowledge, recommendations, and future work are also presented.
7
CHAPTER TWO:
LITERATURE REVIEW
2.1 INTRODUCTION
This section presents the literature review and related works of pulse oximeter systems, where the previous works on developing the pulse meters, PPG principle, reflective and transmissive pulse meters, organic optoelectronic devices, wireless pulse meters, and the digital filters are discussed in detail.
2.2 PPG PRINCIPLE
The main function of the human heart is to pump oxygenated blood and nutrients to the body and eliminate carbon dioxide from the body. The order of cycling deoxygenated blood (Hb) over the lungs and pumping afresh oxygenated blood (HbO2) to the body over the aorta is called the cardiac cycle. The HR is the frequency of cardiac cycles, defined as beats per minute (bpm). Any main change in the physical or mental state of a person normally changes the pulse. Thus, HR operates as one of the vital signs in evaluating the physical and mental status of a person. The HR can be measured accurately using electrical, optical, or strain sensors. In the case of electrical measurement, skin electrodes are used to get the depolarization signal from the heart muscles. This method is known as electrocardiography (ECG). On the other hand, in the case of optical measurement, the pulse meter is used to monitor the HR and cardiac cycle [10].
Pulse oximetry is a non-invasive method that allows monitoring the oxygen saturation of a patient’s hemoglobin (Hgb). The Hgb is a protein which exists in the red blood cells, and it is responsible for transferring the oxygen to the whole body and
8
subtracting the carbon dioxide from the human body by transporting it to the lungs for exhalation process. It gives the red blood cells its color. Figure 2.1 shows the structure of Hgb, where each red blood cell contains thousands of Hgb molecules that carry oxygen to the body, [11].
Figure 2.1: Structure of the hemoglobin molecule that exists in the red blood cells, [11]
The main role of red blood cells (erythrocytes) is to deliver oxygen to the body tissues and to bring waste carbon dioxide back to the lungs. Each Hgb molecule is comprised of four polypeptide chains called globins and four organic pigment molecules called hemes. Hence, one Hgb can hold four molecules of oxygen. There is one atom of iron in the center of each heme group, which can combine with one molecule of oxygen in the lungs and release oxygen in the tissues, [12].
There are two types of Hgb in the blood; oxygenated hemoglobin (HbO2) and deoxygenated hemoglobin (Hb). Hgb merges with oxygen (O2) to create HbO2 in the lungs via a loading reaction. The HbO2 is carried to the capillaries of the tissues where it separates to yield Hb and free O2 molecules via an unloading reaction, and oxygen is used in mitochondria, [12]. Hb and HbO2 have different optical absorbance coefficient in light wavelength spectrum, [3]. Therefore, pulse oximetry is mostly based on the absorbance characteristics at two different wavelengths where the oxygen saturation or
9
oxygenation (SpO2) is the concentration of HbO2 in the blood divided by the sum of the concentration of HbO2 and Hb in the blood, which can be defined by Equation 2.1:
𝑆𝑝𝑂2= [𝐻𝑏𝑂2]
[𝐻𝑏𝑂2] + [ 𝐻𝑏]× 100 (%) Equation 2.1
HbO2 and Hb have different absorption spectra, as shown in Figure 2.2, where the plot of absorbance coefficient versus wavelength is based on Beer-Lambert law that related to the concentration of a solute to the intensity of light at a specific wavelength.
In the red-light region, HbO2 absorbs less light than Hb, while in the green-light region the reverse occurs.
Figure 2.2: Light absorbance spectra of oxygenated hemoglobin (HbO2) and deoxygenated hemoglobin (Hb), [13]
Beer-Lambert law stated that the intensity of light traveling through a medium decreases exponentially with distance [14], as described in Equation 2.2:
𝐼𝑇 = 𝐼𝑖× 𝑒−𝜀(𝜆)𝐶𝐷 Equation 2.2
10
where; (IT) is the intensity of transmitted light, (Ii) is the intensity of incident light, (ε(λ)) is the molar absorptivity, (C) is the concentration of the absorbent medium, and (D) is the optical path distance. Nonetheless, it is not easy to verify the exact intensity of the incident light applied. Furthermore, systole and diastole of heart pulse will cause small variations in the distance traveled by the light that is reflected. Therefore, Beer- Lambert’s law needs to be adjusted for pulse oximetry and to apply empirically derived calibration curve. Thus, Equation 2.2 can be simplified to be independent of Ii and ΔD, as shown in Equation 2.3:
𝑅 = 𝛼(𝜆𝑅𝑒𝑑)
𝛼(𝜆𝐺𝑟𝑒𝑒𝑛) = ln(∆𝑇𝑅𝑒𝑑) ln(∆𝑇𝐺𝑟𝑒𝑒𝑛)=
𝑙𝑛 (𝐼2(𝜆𝑅𝑒𝑑) 𝐼1(𝜆𝑅𝑒𝑑)) 𝑙𝑛 (𝐼2(𝜆𝐺𝑟𝑒𝑒𝑛)
𝐼1(𝜆𝐺𝑟𝑒𝑒𝑛))
Equation 2.3
where (R) is the ratio of the absorption ratio that is used to measure the SpO2 on the calibration curve, as shown in Figure 2.3, (∆T) is the change in transmission, (α(𝜆)) is the molar absorptivity as a function of wavelength of red and green, I1(λ) is the peak value received from the photodetector of a single PPG pulse, and I2(λ) is the trough value of that pulse, [15].
Figure 2.3: The calibration curve for estimating SpO2 [16].
11
Depending on the sensing location and method, oxygenation can be categorized into three categories; venous oxygenation (SvO2), tissue oxygenation (StO2), and peripheral oxygenation (SpO2). Among various oxygenation measurements, SpO2
measurement is universal due to its noninvasive type. SpO2 level should be about 95%
in a healthy adult. If it decreases too low, below 80%, good organ function will be harmed, [3,17].
PPG principle consists of a light source and a light detector where the light transmits throughout the body tissues and reflects on the light detector, as shown in Figure 2.4. Apparently, when the heart beats, the blood volume of the arteries changes accordingly and causes variable light absorption, which leads to detect the change of reflected light as a PPG signal. In other words, the reflected or transmitted light from the pulse meter has a small pulsatile component in a pulse waveform, which is a result of the variations in the volume of arterial blood at the sensor site. This will cause changes in the light transmitted throughout the tissues, [4,18].
Figure 2.4: Acquiring photoplethysmogram (PPG) signal from reflectance mode.
The detected PPG signal comprises of an alternating (AC) component, which is due to variable absorption of the pulsatile arterial blood, and a steady-state (DC)
12
component from the venous, capillaries, tissue, bone and other non-pulsatile components, as shown in Figure 2.5, [14]. The AC component is the outcome of the light absorption by the arteries, while the DC component is the outcome of the light absorption by the body tissue and veins. Therefore, the pulsatile effect occurs only in the arteries but not in the veins or other non-pulsatile components, [19,20]. To put that into perspective, a pulse oximeter is based on two physical principles;
spectrophotometric methodology and PPG principle to estimate the SpO2, while the pulse meter relies on the PPG principle only.
Figure 2.5: Schematic of light absorption in body tissues.
2.3 REFLECTIVE MODE VS TRANSMISSIVE MODE
To obtain a PPG signal from a pulse meter, there are two approaches that can be used: a reflective mode or a transmissive mode, as shown in Figure 2.6, which illustrates the differences between the two methods for an organic pulse meter.
13
(A) (B)
Figure 2.6: Obtaining the PPG signal based on an organic pulse meter: (A) Transmissive mode; (B) Reflective mode.
The transmissive mode is based on the tissue transillumination where the light source and the detector are placed on opposite sides to each other, as shown in Figure 2.6A. The light from the OLED goes through the finger and is received on the OPD from the other side. On the other hand, the reflective mode, which is illustrated in Figure 2.6B, uses light reflection instead of tissue transillumination. The light source and the detector are both mounted side-by-side, where the OPD detector obtains the reflected light from the human skin. While the PD in the transmissive mode receives only the light that passes through many blood vessels in the finger, the PD in the reflective mode receives both the light that reflected from some blood vessels in the finger and the direct light from the LED. Consequently, the ratio of AC component to the DC component in the transmissive mode will be bigger than the ratio in the reflective mode, which means that the SpO2 estimation will be more accurate in the transmissive mode. However, the transmissive mode is limited to be applied on terminal body parts such as fingertips, toes, and ear lobes. To overcome this limitation in the transmissive pulse oximeter, the reflective mode is used by taking advantage of the design freedom presented by the organic materials and fabricating it onto a flexible substrate. Therefore, the reflective pulse oximeter can be easily worn or attached to the human body. Several researchers
14
have started to work on the reflectance detection method [21,22], as the transmissive mode has been reported to be uncomfortable with limited usage. Furthermore, it gives inaccurate results if it was used in a cold environment or by a shaking finger. The reflective mode, on the other hand, has several advantages over the transmissive method, as it can be applied to different parts of the body, not only on the fingertips or the thin portion of the ear, to measure the PPG signal. However, in the reflective pulse oximeter, it is difficult to perform accurate oxygen saturation level measurement on several body locations, such as the torso or limbs, using the reflection mode due to the higher density of fat and lower density of blood vessels in those locations, [23].
Therefore, it is recommended to use the reflective pulse oximeter on body locations that have less density of fat such as the fingertips, wrist, arms, neck, and forehead.
2.4 RELATED WORKS ON PULSE OXIMETERS
Wearable medical devices require miniaturized, portable, and accurate healthcare monitoring devices to be compatible with the conventional one, which will lead to reducing healthcare expenditures and increasing the simplicity of health monitoring.
Although the minimal functionality desired from pulse oximeter devices is the monitoring of vital signs, seemingly, they still require more reliability, rigidity, and accuracy in its sensitivity, circuit-board, power consumption and signal quality due to imperfect and varied skin structures from one person to another, noise and motion artifacts and the need for using the device for a long time, [24]. In that regard, several studies have been conducted in order to overcome these problems by proposing propitious solutions.
15 2.4.1 Organic Optoelectronics
One of the best advantages of the organic optoelectronic devices is the freedom of design, where the design engineer can make the best match between the OLED and OPD for improving the power consumption and the PPG signal quality. There are several proposed design structures in the literature. In [25], separated two square-shaped OLED devices and one rectangular-shaped OPD device were proposed as a transmissive mode pulse oximeter, while the authors of [26] proposed a monolithic device of array square-shaped OLEDs and OPDs for measuring the oxygen saturation and creating two- dimensional (2D) oxygenation maps. The configuration of an annularly-shaped photodiode (PD) ring and light-emitting diode (LED) located in the center was first proposed by the authors in [23] for improving the battery longevity of the inorganic reflective pulse oximeter. In [27], a circular-shaped OPD in the center of half-ring- shaped of red polymer light-emitting diode (PLED) and the second half-ring for green PLED design was proposed for the flexible reflective pulse oximeter. Also, a ring- shaped OPD surrounding a circular-shaped OLED was proposed by the authors in [28]
for a flexible pulse oximetry sensor. They employed an optical simulation for deciding the best dimension area and the shortest gap between the OLED and the OPD where the relationship between the received radiant power with the gap distance was discussed without taking into consideration the DC noise. However, the PPG signal quality has not been adequately addressed in the previously proposed designs. Moreover, the dimension design, the material structure, and the characteristics of the OLED and OPD in this work are different than those in previous works. Consequently, this thesis proposed and compared different dimensions and material structures based on our works in [29–32] to improve the power consumption and the signal quality of portable
16
pulse meters, and highlighted the significance of the optical simulation in designing the OLED and the OPD devices.
There are several studies that have been carried out in the literature to improve the power consumption of the pulse meter. In [33], the study proposed a reflective pulse meter prototype with a total power of 40 mW, with the LED driving current between 17.4 ~ 50 mA. In contrast, the authors of [34] proposed an analog single-chip pulse oximeter that was implemented with 4.8 mW of total power consumption required of the LED power and the processing power chips. A fully integrated pulse oximeter front- end with about 1 mW of total power consumption, 0.31 mW for the LEDs, and 0.53 mW for the front-end was proposed in [35]. For improving the flexible pulse oximeter, a promising result of the average OLED’s power consumption of 0.097 mW, at a full- duty cycle, was reported in [28]. While this thesis presenting the power consumption of the previous works on the pulse oximeter, which requires two light sources, it is worth mentioning that the proposed pulse meter in this work requires a single light source that leads to half the power consumption of two light sources when they operate at the same time with a full-duty cycle.
The organic pulse meter would be able to reduce the power consumption, while the inorganic pulse meter would not because it uses an inorganic PD which has a small rigid detection area and if the PD region area increased, the pulse meter would be uncomfortable for use. For that reason, the light intensity of the LED should be increased instead of increasing the area of the PD, which means more current consumption is needed. Furthermore, the PD requires a bias to work, which means more power will be consumed. Whereas in the organic materials, the surface area of the OPD can be increased at a zero-bias condition and collect many reflected photons from the
17
skin on the OPD. Moreover, the organic material can be deposited on a flexible substrate for a comfortable wearable pulse meter device.
2.4.2 Wireless Monitoring
Monitoring the PPG signal wirelessly requires considering the reduction of the wireless pulse meters device’s power consumption, which is battery operated. That is to say, the size and weight of the device are predominantly determined by the size and weight of the battery. Therefore, decreasing power consumption is the top priority in developing wireless pulse meters.
In the literature, there are several studies that have attempted to develop a wireless monitoring pulse meter and solve several problems associated with it, such as signal quality and power consumption. In [36], the study proposed a compact portable module composed of photodetectors array, which was distributed radially around LEDs and sent the PPG signal via the Zigbee protocol wireless module. The chip consumed 38 mA for transmitting data and 37 mA for receiving data. The LEDs consumed about 38 mW in red LED, and 26 mW in IR LED. A wireless PR and SpO2 monitoring system presented by the study in [37], where the proposed system connected to a local wireless network through Wi-Fi technology and the information was transmitted in real-time to a webpage for remote monitoring. The current consumption of that wireless MCU chip was 229 mA for TX traffic and 59 mA for RX traffic. Other researchers proposed wireless pulse oximeters but without mentioning the power consumption of the proposed device such as the study in [38] where authors proposed a wireless ring-type pulse oximeter with multi-detectors for sending the signal to the host system via Bluetooth, while the authors of [39] proposed a PPG wireless monitoring devices embedded in hat and glove and send the signal via Bluetooth. However, monitoring the
18
PPG signal wirelessly was not adequately addressed in the previous researches and prototypes for the signal quality. Moreover, the previously proposed devices for wireless monitoring still impractical for long term use. Therefore, the pulse meters, as wearable medical devices, are required to be miniaturized, portable and monitored wirelessly in order to provide more freedom and to be more comfortable and compatible with the conventional one, which will lead to increasing the simplicity of health monitoring.
2.4.3 Digital Filters
The PPG signal can be contaminated by noises from different kinds of sources such as motion artifacts, electronic noises, and high-frequency noises from the ambient light fixture and appliances. Consequently, extensive works have been done on denoising the PPG signals with several noise reduction techniques such as discrete wavelet transform (DWT) [40], independent component analysis (ICA) [41], and morphological characteristics comparison [42]. In [43], sporadic noise was reduced from a continuous periodic signal after applying a cluster analysis for picking similar replications or pulses from a periodic signal, while in [44], a pattern recognition filtering system for PPG and ECG signals was proposed. However, it is difficult to implement these methods into wearable devices due to their requirements and complexity. In this work, we implemented a finite impulse response (FIR) digital filter in order to improve the signal’s quality because of its efficacy in the embedded systems.
2.5 SUMMARY
This chapter has discussed in detail the related works on the pulse oximeter systems, spectrophotometric methodology, PPG principle, reflective and transmissive
19
mode, organic optoelectronic, wireless pulse meters, and the digital filters. It summarized the previous works and contributions on developing the pulse meters.
20
CHAPTER THREE:
THE ORGANIC OPTOELECTRONIC DEVICES
3.1 INTRODUCTION
This section describes the optical simulation used for the design structure and defines the characteristics of the organic optoelectronic device, and lastly explains the driving circuit for the proposed device.
Three different design structures were fabricated and named as Device-A, Device-B, and Device-C. In Device-A, a circle-shaped red OLED was set in the center of the pulse meter with a total emitting area of 0.03 cm2 and surrounded by a ring- shaped OPD with a surface area 0.16 cm2, whereas in Device-B, a circle-shaped OPD was set in the center and surrounded by a ring-shaped red OLED with areas of 0.03 cm2 and 0.16 cm2, respectively. Device-C had a circle-shaped OLED, 0.06 cm2, at the center and was surrounded by a ring-shaped OPD area of 0.16 cm2. The gap distance between the OLED and OPD was 2 mm, 2 mm and 1.65 mm for Device-A, Device-B and Device-C, respectively. The rationale behind the use of the ring-shaped OPD structure that surrounds the OLED was to allow the OPD to collect the reflected photons from the skin efficiently.
3.2 OPTICAL SIMULATION
In order to get the best OLED and OPD design for improving the power consumption and quality of the PPG signal, a simplified finger model and OLED/OPD model were simulated optically by LightTools software (Synopsys, Inc., California, USA). The simulator traces the light rays using the ray-tracing method in combination with the Monte Carlo method, where three different design structures of the pulse meter
21
were simulated: Device-A, Device-B, and Device-C. The finger model was simplified into a four-layer structure of the skin, subcutaneous adipose tissue, muscle, and bone.
The optical parameters of these layers were approximated from the literature in [45–
48], and are shown in Table 3.1 where the refractive index of the material describes how fast light propagates through the material. The Henyey–Greenstein function was used to approximate the angular scattering dependence of single scattering events in biological tissues. The thickness of each layer was approximately assumed as 2 mm, 2.5 mm, 3 mm and 6 mm, respectively. The distribution of the light rays from the OLED into the human body and the reflection on the OPD were illustrated in Figure 3.1. In the model, the arterial blood vessels were assumed to be included in the skin and the subcutaneous adipose tissue for simplicity. The pulse meter model was composed of a light object source (625 nm) that represented the red OLED, and a surface receiver that represented the OPD. The dimensions of the OLEDs and OPDs design structures for all devices are illustrated in Figure 3.2, which demonstrates that Device-A was designed to be opposite of Device-B, and the area of the OLED in Device-C was designed to be double the size of that in Device-A in order to evaluate the effect of increasing the light source and decreasing the gap distance between the OLED and the OPD.
Table 3.1: Summary of the approximated optical parameters of a human finger.
Tissue Wavelength (nm)
Index of refraction
(n)
Henyey- Greenstein
(g)
Absorption Coefficient
(Ua) in mm-1
Scatter Coefficient
(Us) in mm-1
Thick ness (mm)
Human skin 625 1.55 0.81 0.27 18.7 2
Subcutaneous fat 625 1.44 0.9 1.14 12.8 2.5
Muscle 625 1.37 0.9 0.56 64.7 3
Bone 625 1.37 0.9 0.04 19.5 6
22
Figure 3.1: A simplified finger schematic model with the organic light-emitting diode (OLED) as the light object source and the organic photodiode (OPD) as the surface receiver for (A) Device-A;
(B) Device-B and; (C) Device-C.
23
Figure 3.2: The optical simulation results at the receiver’s surface in Watt per mm2 and the dimensions of the OLED and OPD design structures for (A) Device-A; (B) Device-B and; (C) Device-C.
The light ray’s energy is determined, in the optical simulation, by the source’s power and the number of rays emitted. The radiant powers of the light object source of Device-A, Device-B and Device-C were assumed, based on our OLED device (625 nm) measurements, to be 1.4 μW, 7.5 μW, and 2.8 μW, respectively. The simulation traced
24
one million rays in each device. According to the simulation results in Figure 3.2, the maximum estimated irradiance on the OPD area of Device-A, Device-B and Device-C were 3.7 × 10⁻¹⁰ W/mm2, 2 × 10⁻⁹ W/mm2 and 9.8 × 10⁻¹⁰ W/mm2, respectively. While the simulation presented an unequal irradiance distribution due to the spline effect of the ray simulation, we assumed the maximum irradiance was distributed equally.
Therefore, the total power received of Device-A, Device-B and Device-C will be 5.9 × 10⁻⁹ W, 6 × 10⁻⁹ W and 15.6 × 10⁻⁹ W, respectively, which is expected to provide closer values of the PPG amplitude from the OPD devices. To put that into perspective, 0.42% of total light rays reflected on the OPD of Device-A, and just 0.1% of the total light rays reflected on the OPD of Device-B, while Device-C received the highest percentage of 0.55% from the total light rays on the OPD. In these simulation results, when the gap between the OLED and the OPD was decreased from 2 mm in Device-A to 1.62 mm in Device-C, the total power increased to more than double, which means that the amplitude of the PPG in Device-C was expected to be bigger than the amplitude in Device-A and Device-B. Therefore, from these three design structures, we conducted a comparison in order to choose the best one in terms of power consumption and signal quality.
3.3 CHARACTERIZATION OF THE ORGANIC OPTOELECTRONIC DEVICES
The good characteristics of the organic optoelectronic device improve the signal’s quality of the pulse meter device, which in turn will provide accurate measurements in the medical examinations. As a monolithic device, the OLED and the OPD were deposited onto the same 0.7 mm thick glass substrate. For simplicity of the structure of the device and future fabrication, identical red OLED and OPD structures, shown in
25
Figure 3.3A, were fabricated on the same substrate. The organic material structure of the OLEDs and OPDs were the same for Device-A, Device-B, and Device-C, as shown in Figure 3.3B.
3.3.1 OLED Characterization
Organic LEDs have many advantages over LEDs, despite the fact that they have a shorter lifetime. OLEDs are relatively easy to produce, flexible, foldable, transparent, and capable of fast switching. The very thin organic and flat layer of the OLED device, compared to the LED, makes it applicable for fabrication onto a flexible substrate, which will be comfortable when placed on the human skin. OLED provides a suitable light intensity which will help in acquiring an accurate and strong signal due to the large reflective area of the OPD. Moreover, they are lower cost and consume less power. This has made organic light-emitting diodes (OLEDs) and OPDs preferable for use in wearable pulse oximeters [7–9].
In this work, three different pattern monolithic devices, Device-A, Device-B, and Device-C, were fabricated. The red OLED and the OPD were placed on the same 0.7 mm thick glass substrate, as shown in Figure 3.3A. The red OLED was adopted in this work due to its advantages over other OLEDs colors including the green OLED and near-infrared (NIR) OLED. In the case of green OLED, the green light has a shorter wavelength that is efficiently absorbed through the skin, which leads to producing a higher SNR level than the red OLED. However, absorbing more light through the skin, especially darker skin where the shorter wavelengths of light are strongly absorbed by melanin [49], limits the depth that light can pass through, hence, weakens the strength of the PPG signal [50]. Based on that, green OLEDs will face some challenges when they are used as a light source for wearable pulse oximeters. In the case of the NIR
26
OLED, the NIR region of the spectrum has a longer wavelength, which leads to increasing the penetration depth of the light in the human body. However, the external quantum efficiency (EQE) in this region is significantly lower than the OLED in the visible region. Moreover, fabricating NIR OLED/OPD device is difficult and still under research and development due to instability issues and unavailability of appropriate materials. The NIR OLED/OPD materials are less stable than the red OLED/OPD materials. Also, it is difficult to synthesize low bandgap material that is required for OLED and OPD [51,52].
Figure 3.3: (A) The fabricated organic biosensor pulse meter for Device-A, Device-B, and Device-C.
(B) A cross-section of the organic material structure of the OLED and OPD for all devices.
27
The performance of the OLED device is essential to the quality of the pulse meter measurements. The same material structures of the OLED/OPD were used in Device-A, Device-B, and Device-C. The fabrication process of the organic pulse meter sensor started with the preparation of 2.5 cm × 2.5 cm glass substrates that were coated with indium-tin-oxide (ITO) and cleaned via sonication in detergent, deionized (DI) water, acetone, and isopropyl alcohol (IPA). Next, the substrates were boiled in IPA for 10 minutes and subjected to UV-ozone treatment for 15 minutes. Then, the samples were loaded into an evaporator chamber where the organic and metal layers were deposited with proper shadow mask patterns for the OLED, followed by the OPD. The shadow masks were designed in a way to prevent the issue of misalignment in the multi- mask processing of monolithic device fabrication. After the evaporation processes, the samples were encapsulated without exposure to air in a glove box by glass lids using UV curable epoxy resin. Thereafter, the samples were used for evaluating the performance of the pulse meter sensor. Figure 3.3B illustrates the structure of the OLED and OPD used in Device-A, Device-B, and Device-C. The OLED device structure consisted of ITO (110 nm), a transparent anode that allowed the generated light to be emitted from the glass panel, HAT-CN (10 nm) as the hole injection layer, Tris-PCz (60 nm) as the hole transport layer, mCBP:10 wt.% Ir(piq)3 + (30 nm) as the emissive layer where the holes and electrons recombined to emit light, T2T (10 nm) as the electron blocking layer, Bpy-TP2 (70 nm) as the electron transport layer, LiF (0.8 nm) as the electron injection layer, and Al (100 nm) as the cathode for the OLED.
28
Figure 3.4: The OLED’s electroluminescence spectrum with respect to the wavelength (nm).
The current density-voltage (JV)-luminance characteristics were evaluated using a Keithley 2400 source meter and an absolute external quantum efficiency (EQE) measurement system (C9920-12, Hamamatsu Photonics, Japan). The OLED was mounted to the entrance port of the measurement system’s integrating sphere to collect the photons emitted from the front face of the devices. Each electroluminescence (EL) spectrum was collected by an optical fiber connected to a spectrometer (PMA-12, Hamamatsu Photonics). All measurements were performed in the ambient atmosphere at room temperature. The emission spectra in Figure 3.4 shows the EL characteristic of the OLED with respect to the wavelength, where the maximum intensity of light is at 625 nm. The slight difference in the EL spectrum of devices was due to the micro-cavity effects with different doping ratio or thickness variation where the devices were not fabricated at the same time.
29
Figure 3.5: EQE of the OLED with respect to the current density (mA/cm2).
Figure 3.5 shows the EQE with respect to the current density (mA/cm2) where OLED device showed a low level of leakage current. The EQE of the OLED was measured about 7% at 1 mA/cm−2 current density. The current density in Figure 3.6 indicates a good OLED characteristic of, approximately, 10 mA/cm2 at 5V. Eventually, we have been able to improve the OLED characteristics where the OLED host dopant ratio in the emissive layer and the thickness of hole/injection transport and injection layers were optimized in order to achieve high OLED EQE.
Figure 3.6: The current density (mA/cm2) of the OLED with respect to voltage.
30 3.3.2 OPD Characterization
Measuring the amount of the reflected light from the skin layers and blood vessels on the large area of the OPD, compared to the PD, gives a better and stronger signal due to the high-detectivity of the OPD on a large detective area. As a result, the pulse meter device gives a better diagnosis of the PPG signal of the patient’s condition. In the detecting circuit, we used no bias for the OPD sensor, which is a special characteristic of OPD over the silicon photodiode. The OPD structure consisted of ITO (110 nm), with MoOx (10 nm) as the hole injection layer, DBP (10 nm), DBP:C60 (50 nm), and C60 (20 nm) combined in the device active layer, BCP (8 nm) as the electron transport layer, and Al (100 nm) as the cathode, as shown in Figure 3.3B.
The EQE spectra were collected using Bunkoukeiki SM-250GDP spectral response measurement system. The EQE of the OPD device at 625 nm, of a zero-bias condition for all devices, was about 37%, which overlapped with the EL spectrum of the red OLED wavelength, as shown in Figure 3.7. The slight difference in the characteristics of Device-A, Device-B, and Device-C was due to difference doping ratio or thickness variation because the devices were not fabricated at the same time.
Figure 3.7: The OPD’s external quantum efficiency (EQE) with respect to the wavelength for Device-A, Device-B, and Device-C.
31
The OPD can be fabricated to cover more wavelength spectrum, but in this work, we selected the DBP and C60 device structure because we were using red OLED and this OPD device configuration gave the best performance in the OLED wavelength region. In the case of fabricating a NIR OPD, the materials that used to fabricate the device are unstable, and it is difficult to synthesize low bandgap material that is required for NIR OPD device.
Eventually, the OPD characteristics have been improved. The donor/acceptor ratio and the buffer layer thickness have been optimized. In addition, the charge blocking/injection layers were improved to reduce the reverse dark current density of vacuum processed DBP:C60 and enhance the EQE of the OPD.
3.4 SUMMARY
As a summary, this chapter has discussed the results of the optical simulation that lead to the best design structure in terms of power consumption and signal quality.
Additionally, it elaborated the proposed design structure of the organic optoelectronic pulse meter, fabrication, and characteristics of the optoelectronic devices.
32
CHAPTER FOUR:
THE SYSTEM DESIGN
4.1 INTRODUCTION
The system structure of the proposed pulse meter is composed of three parts:
optoelectronic devices, an analog circuit, and a microcontroller unit (MCU), as illustrated in Figure 4.1.
Figure 4.1: The system structure of the PPG detector device.
4.2 THE DRIVER CIRCUIT
There are different circuit topologies used for PPG acquisition systems such as the open-source schematic diagram shown in Figure 4.2, the Sallen-Key filter topology in Figure 4.3, and the multiple feedback (MFB) filter topology as shown in Figure 4.4.
33
Figure 4.2: An open-source schematic diagram for the pulse sensor [53].
Figure 4.3: Two stages 2nd order bandpass filter (BPF) of Sallen-Key filter topology.
Figure 4.4: Two stages 2nd order BPF of multiple feedback (MFB) filter topologies.
The readout circuit in Figure 4.2, which is an open-source circuit for a commercialized pulse sensor, contains a miniature surface-mount (MSM) ambient light photosensor (APDS-9008, Broadcom Inc., San Jose, CA, USA) which includes a PD and operational amplifier (op-amp) inside the chip, as shown in Figure 4.5. This MSM ambient light photosensor outputs a voltage PPG signal which needs to be amplified
34
and filtered out from the noise in the following bandpass filter (BPF) of the circuit. VIN+
is connected with the voltage reference (Vref), which is equal to Vdd/2. C4 is connected with the Vref in order to minimize the noise to the lowest level by taking advantage of the common-mode rejection ratio (CMRR) of the op-amp. With this configuration circuit, the output PPG signal will be differentiated and amplified between 0 to Vdd volt, which is suitable for LED and PD pulse oximeter. However, this configuration circuit is not proper for OLED and OPD pulse oximeter, where the OPD generates current instead of voltage. Therefore, a transimpedance stage is needed in order to convert the current signal into a voltage signal.
Figure 4.5: Typical application circuit for APDS-9008, [54]
In Figure 4.3, a pulse oximeter schematic diagram consists of TIA stage and two stages 2nd order bandpass filter (BPF) of Sallen-Key filter topology with a high gain.
The first stage is necessary and effective, while the second stages of BPF are challenging where the op-amps must be a dual supplied in order to amplify the positive and negative signals. Whereas in the single supply op-amp, it will only amplify the positive signal which is not suitable for our circuit. Moreover, the circuit contains three
35
active components and 16 passive components, which indicates more power will be consumed, and many components will be packed in a small size PCB, which may affect the output signal. On the other hand, the circuit diagram in Figure 4.4 consists of TIA stage and two stages of 2nd order BPF of multiple feedback (MFB) filter topologies. It overcomes the limitation of amplifying the negative signal by connecting a Vref on the VIN+ of the op-amp in order to shift the negative signal to the positive level. However, the circuit has a limitation on the gain. When the gain increases, the Q-factor increases as well and results in not flat magnitude response in the passband, which will cause an unstable output signal, as shown in Figure 4.6.
(A) (B)
Figure 4.6: Bode Plots of two stages, 2nd order BPF, of MFB filter topology at; (A) 10 dB gain; (B) 50 dB gain.
Eventually, in order to miniaturize the PCB size and reduce the power consumption in the circuit while maintaining the best performance for the pulse meter, we chose to reduce the passive components and simplify the driving circuit into three main stages; transimpedance stage, filtration stage, and amplification stage, as shown in Figure 4.7.
![Figure 2.1: Structure of the hemoglobin molecule that exists in the red blood cells, [11]](https://thumb-ap.123doks.com/thumbv2/123deta/9840115.1895455/21.893.243.688.300.504/figure-structure-hemoglobin-molecule-exists-red-blood-cells.webp)


![Figure 4.2: An open-source schematic diagram for the pulse sensor [53].](https://thumb-ap.123doks.com/thumbv2/123deta/9840115.1895455/46.893.167.796.109.299/figure-open-source-schematic-diagram-pulse-sensor.webp)
