Association of Gene Polymorphism of the Fat Mass and
Obesity Associated Gene with Metabolic Syndrome:
A Retrospective Cohort Study in Japanese Workers
Tomoka Kawajiri, Yoneatsu Osaki and Takuji Kishimoto
Division of Environmental and Preventive Medicine, Department of Social Medicine, School of
Med-icine, Tottori University Faculty of MedMed-icine, Yonago 683-8503, Japan
To investigate whether gene polymorphism of the fat mass and obesity associated gene
(FTO) is associated with metabolic syndrome (MS), we used two MS criteria, the National
Cholesterol Education Program-Adult Treatment panel III (NCEP-ATPIII) definition in
2003 and the Japanese definition in 2005. Subjects were respectively 859 and 865 Japanese
workers at a company in Shimane Prefecture, Japan. They were non-MS individuals in
1998 and had regular health checkups between 1998 and 2006. The Cox proportional
haz-ard regression was used to predict MS. Three SNPs in the FTO, rs9939609, rs1121980 and
rs1558902, were genotyped by the TaqMan PCR assay and a retrospective study was
per-formed. The three SNPs in the FTO were significantly associated with body mass index,
and rs1121980 and rs1558902 were associated with fasting plasma glucose. MS defined
by the NCEP-ATPIII definition was significantly associated with additive and dominant
models of rs9939609 and rs1121980, and the dominant model of rs1558902, even after
ad-justing for confounding factors such as age, sex and lifestyle. MS defined by the Japanese
definition was significantly associated with the additive model of rs1121980 and additive
and dominant models of rs1558902 in multivariate analysis. These results suggested that
FTO gene polymorphisms, rs9939609, rs1121980 and rs1558902, were associated with an
increased risk of MS among Japanese workers.
Key words: cohort study; fat mass and obesity associated gene; Japanese worker; metabolic
syn-drome; single nucleotide polymorphism
Abbreviations:
BMI, body mass index; BP, blood pressure; FPG, fasting plasma glucose; FTO, fat mass and obesity associat-ed gene; HDL, high density lipoprotein; MS, metabolic syndrome; NCEP-ATPIII, National Cholesterol Education Program-Adult Treatment panel III; SNP, single nucleotide polymorphism; T2DM, type 2 diabetes mellitus.Metabolic syndrome (MS) is a cluster of risk factors
for developing cardiovascular disease such as type
2 diabetes mellitus (T2DM), consisting of central
obesity, high blood pressure, abnormal glucose
tolerance and abnormal lipid profiles (Eckel et al.,
2005; Grundy et al., 2005). The prevalence of
MS
has become increasingly common not only in Japan,
but also in the world.
It is because environmental
fac-tors contribute to the increased prevalence of MS,
namely lifestyles (Fappa et al., 2008), and genetic
factors are also related (Groop, 2000; Eckel et al.,
2005).
Recently, part of a genome-wide association
study found that several single nucleotide
poly-morphisms (SNPs) of the fat mass and obesity
as-sociated gene (FTO) were strongly asas-sociated with
obesity and T2DM (Hinney et al., 2007; Scuteri et
al., 2007).
The human FTO is located on chromosome no.16
(16q12.2), which consists of 9 exons with an entire
length of 410 kb (410,507 bp). The FTO encodes a
2-oxoglutarate-dependent nucleic acid demethylase
and is widely expressed in many tissues, especially
in the hypothalamus, which controls energy balance
(Dina et al., 2007; Frayling et al., 2007). Studies in
mice indicated that FTO mRNA levels were
regu-lated by feeding and fasting (Gerken et al., 2007),
and FTO knockout mice had postnatal growth
delays, increased energy consumption and skinny
body shapes (Fischer et al., 2009). Thus, the FTO
may play an important role in controlling energy
expenditure and may also be involved in energy
homeostasis, but the exact function of the FTO and
the mechanisms by which the FTO involves
biologi-cal pathways remain unknown.
In previous genetic analyses, SNPs rs9939609,
rs1121980 and rs1558902, located in intron1 of the
FTO were strongly associated with obesity, BMI
and MS in Caucasians and Hispanic Americans
(Dina et al., 2007; Frayling et al., 2007; Hinney
et al., 2007; Scuteri et al., 2007; Al-Attar et al.,
2008; Andreasen et al., 2008; Sjögren et al., 2008;
González-Sánchez et al., 2009), but not in African
American, Oceanic or Chinese populations (Ohashi
et al., 2007; Scuteri et al., 2007; Li et al., 2008).
These reports suggest that the FTO is a race-specific
gene. Studies in the Japanese failed to establish
con-sistency in the association between FTO SNPs and
obesity (Horikoshi et al., 2007; Omori et al., 2008;
Hotta et al., 2010; Karasawa et al., 2010; Shimaoka
et al., 2010). Concerning the Japanese, few reports
indicated the association of FTO SNPs with MS,
and some denied (Tabara et al., 2009; Shimaoka et
al., 2010).
Therefore, in the present study, we analyzed
the relationship between FTO SNPs, rs9939609,
rs1121980 and rs1558902, and MS diagnosed by
the NCEP-ATPIII and Japanese definitions among
Japanese workers. To investigate the association in
a more detailed manner than previous reports, a
ret-rospective cohort study enrolling lifestyle factors as
considerable variables was performed.
Materials and Methods
Subjects
Subjects consisted of 859 persons (486 males and
373 females) and 865 persons (498 males and 367
females) under the NCEP-ATPIII and Japanese
definitions for MS, respectively. They were
employ-ees of an industry in the Izumo region of Shimane
Prefecture in Japan who had consistently undergone
health check-ups between 1998 and 2006 and were
non-MS individuals in 1998. The average age (±
SD) was 37.69 ± 8.74 years for the subjects under
NCEP-ATPIII and 37.75 ± 8.72 years for those
un-der the Japanese definition. A retrospective cohort
study of the relationship between FTO
polymor-phism and the prevalence of MS for the period
be-tween 1998 and 2006 was performed. All subjects
gave written informed consent to participate in the
study. The study protocol was approved by the
Eth-ics Committee of Tottori University (permission
number, G63).
Subjects completed health check-ups
consist-ing of measurements of the height, weight, body
mass index (BMI), blood pressure (BP) and
his-tory taking (drinking, smoking, eating, exercise
and sleeping habits). The BMI was calculated as
the weight in kilogram divided by the square of
the height in meter. Obesity was defined as a BMI
≥ 25.0 kg/m
2, as defined by the Japan Society of
Obesity. Blood pressure was measured once on the
health-check day in a sitting position with a
stan-dard sphygmomanometer. The first and fifth
Ko-rotkoff sounds were used to determine systolic BP
and diastolic BP, respectively. Blood tests included
high-density lipoprotein (HDL) cholesterol,
triglyc-erides and fasting plasma glucose (FPG). Plasma
glucose levels were determined by the
hexokinase-G-6-PDH method (Wako, Tokyo, Japan.) We
in-vestigated lifestyles, alcohol drinking habits (no
drinking, occasionally, nearly every day), cigarette
smoking habits (no smoking, quit, smoking), eating
habits (eat various food, consider balance slightly,
rarely consider balance), exercise habits (frequently,
sometimes, no exercise) and sleeping habits
(suffi-ciency, usual, insufficiency).
Definition of metabolic syndrome
The NCEP-ATP III definition includes the presence
of three or more of the following five criteria:
cen-tral obesity (waist circumference ≥ 90 cm for males,
≥ 80 cm for females), elevated BP (systolic ≥ 130
mmHg or diastolic ≥ 85 mmHg), elevated
triglycer-ides (≥ 150 mg/dL), reduced HDL cholesterol (< 40
mg/dL for males, < 50 mg/dL for females), and
el-evated FPG (≥ 110 mg/dL). However, in this study,
central obesity was defined as a BMI > 25 kg/m
2, as
defined by the Japan Society of Obesity. A previous
diagnosis of T2DM was considered to be evidence
of an elevated FPG.
The Japanese definition includes the same five
criteria as the NCEP-ATPIII definition, but raised
triglycerides and/or reduced HDL cholesterol levels
are regarded as a single dyslipidemia criterion. In
addition, central obesity must be present as well as
two or more of the other four factors. The Japanese
definition includes: waist circumference ≥ 85 cm for
males and ≥ 90 cm for females; systolic BP ≥ 130
mmHg or diastolic BP ≥ 85 mmHg; triglycerides
≥ 150 mg/dL or HDL < 40 mg/dL in males and
< 50 mg/dL in females; FPG ≥ 100 mg/dL. Central
obesity was defined as a BMI > 25 kg/m
2, similar
to the NCEP-ATP III definition. Furthermore, the
Japanese definition stipulates that all subjects
re-ceiving pharmacological treatment for hypertension
were considered to have elevated BP, all subjects
receiving fibrates were considered to have elevated
triglycerides levels, and all subjects previously
diag-nosed with T2DM were considered to have raised
FPG.
Identification of FTO polymorphism
Peripheral blood samples, which had been collected
for the health check-up in 1998 and remained
af-ter blood tests, were used for the identification of
three SNPs rs9939609, rs1121980 and rs1558902
in the FTO. Genomic DNA was extracted from
these samples using a QIAamp DNA Blood Kit
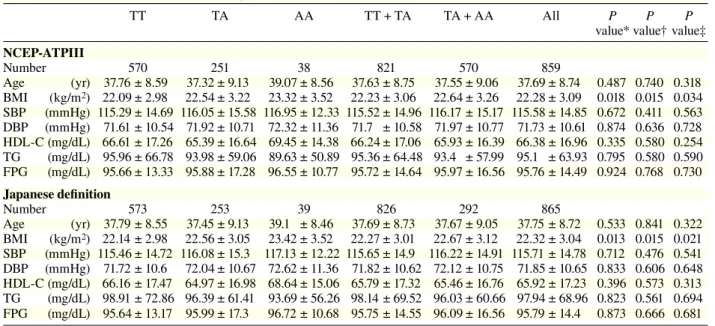
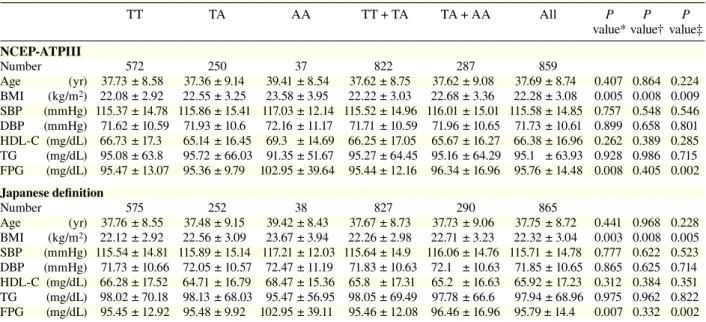
Table 1a. Clinical characteristics per genotype in rs9939609TT TA AA TT + TA TA + AA All P P P
value* value† value‡
NCEP-ATPIII Number 570 251 38 821 570 859 Age (yr) 37.76 ± 8.59 37.32 ± 9.13 39.07 ± 8.56 37.63 ± 8.75 37.55 ± 9.06 37.69 ± 8.74 0.487 0.740 0.318 BMI (kg/m2) 22.09 ± 2.98 22.54 ± 3.22 23.32 ± 3.52 22.23 ± 3.06 22.64 ± 3.26 22.28 ± 3.09 0.018 0.015 0.034 SBP (mmHg) 115.29 ± 14.69 116.05 ± 15.58 116.95 ± 12.33 115.52 ± 14.96 116.17 ± 15.17 115.58 ± 14.85 0.672 0.411 0.563 DBP (mmHg) 71.61 ± 10.54 71.92 ± 10.71 72.32 ± 11.36 71.7 ± 10.58 71.97 ± 10.77 71.73 ± 10.61 0.874 0.636 0.728 HDL-C (mg/dL) 66.61 ± 17.26 65.39 ± 16.64 69.45 ± 14.38 66.24 ± 17.06 65.93 ± 16.39 66.38 ± 16.96 0.335 0.580 0.254 TG (mg/dL) 95.96 ± 66.78 93.98 ± 59.06 89.63 ± 50.89 95.36 ± 64.48 93.4 ± 57.99 95.1 ± 63.93 0.795 0.580 0.590 FPG (mg/dL) 95.66 ± 13.33 95.88 ± 17.28 96.55 ± 10.77 95.72 ± 14.64 95.97 ± 16.56 95.76 ± 14.49 0.924 0.768 0.730 Japanese definition Number 573 253 39 826 292 865 Age (yr) 37.79 ± 8.55 37.45 ± 9.13 39.1 ± 8.46 37.69 ± 8.73 37.67 ± 9.05 37.75 ± 8.72 0.533 0.841 0.322 BMI (kg/m2) 22.14 ± 2.98 22.56 ± 3.05 23.42 ± 3.52 22.27 ± 3.01 22.67 ± 3.12 22.32 ± 3.04 0.013 0.015 0.021 SBP (mmHg) 115.46 ± 14.72 116.08 ± 15.3 117.13 ± 12.22 115.65 ± 14.9 116.22 ± 14.91 115.71 ± 14.78 0.712 0.476 0.541 DBP (mmHg) 71.72 ± 10.6 72.04 ± 10.67 72.62 ± 11.36 71.82 ± 10.62 72.12 ± 10.75 71.85 ± 10.65 0.833 0.606 0.648 HDL-C (mg/dL) 66.16 ± 17.47 64.97 ± 16.98 68.64 ± 15.06 65.79 ± 17.32 65.46 ± 16.76 65.92 ± 17.23 0.396 0.573 0.313 TG (mg/dL) 98.91 ± 72.86 96.39 ± 61.41 93.69 ± 56.26 98.14 ± 69.52 96.03 ± 60.66 97.94 ± 68.96 0.823 0.561 0.694 FPG (mg/dL) 95.64 ± 13.17 95.99 ± 17.3 96.72 ± 10.68 95.75 ± 14.55 96.09 ± 16.56 95.79 ± 14.4 0.873 0.666 0.681 Data are numbers of subjects, divided into genotype groups, and values are mean ± SD.
BMI, body mass index; DBP, diastolic blood pressure; FPG, fasting plasma glucose; HDL-C, high density lipoprotein-cholesterol; NCEP-ATPIII, National Cholesterol Education Program-Adult Treatment panel III; SBP, systolic blood pressure; TG, triglyceride. * Additive model (analysis of variance): comparison among 3 groups (TT versus TA versus AA).
† Dominant model (t-test): comparison of TT + TA with AA. ‡ Recessive model (t-test): comparison of TT with TA + AA.
(Qiagen, Hilden, Germany). These SNPs were
genotyped using TaqMan PCR methods with the
following probes: C_30090620_10 for rs9939609,
C_2031261_10 for rs1121980 and C_891711_10 for
rs1558902 (Applied Biosystems, Foster City, CA).
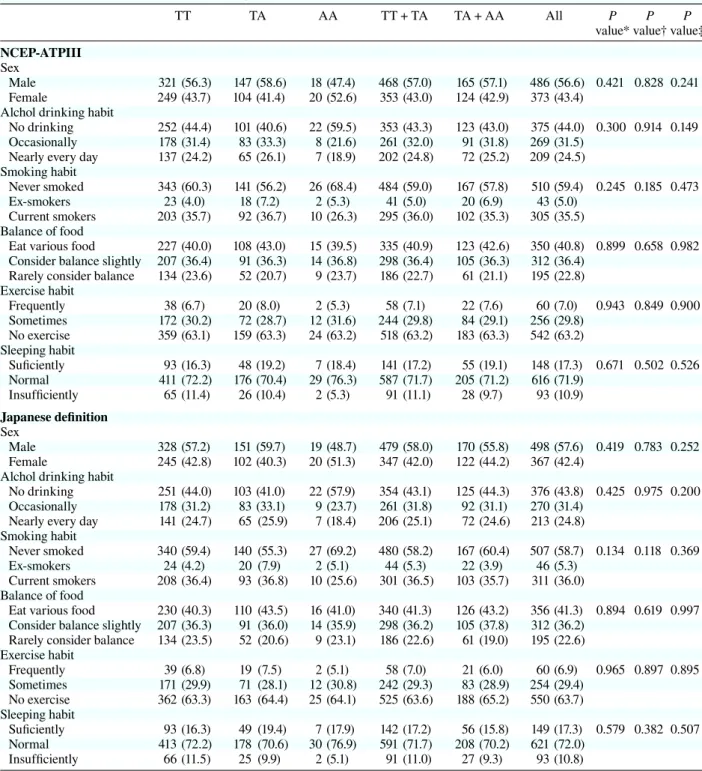
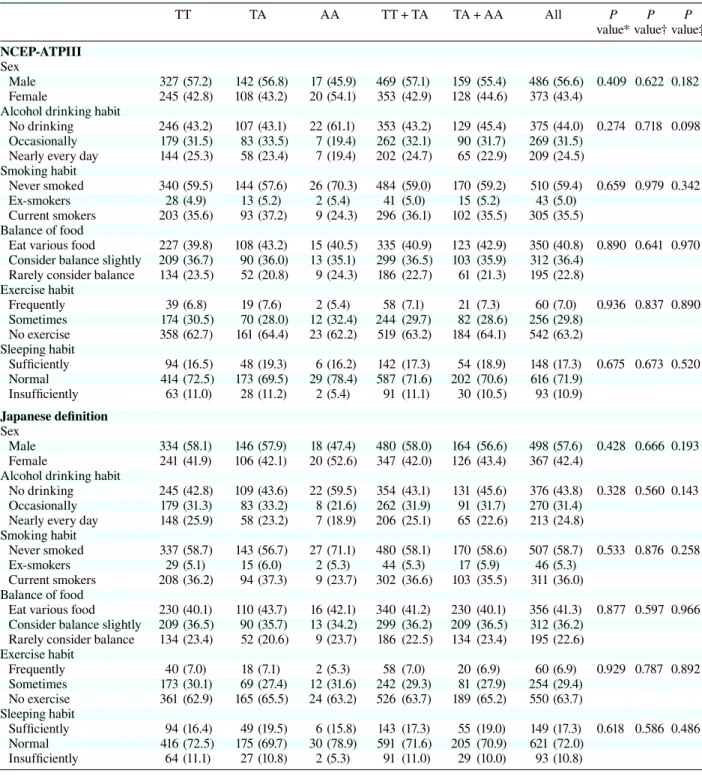
Table 1b. Lifestyle characteristics per genotypes in rs9939609TT TA AA TT + TA TA + AA All P P P
value* value† value‡
NCEP-ATPIII Sex
Male 321 (56.3) 147 (58.6) 18 (47.4) 468 (57.0) 165 (57.1) 486 (56.6) 0.421 0.828 0.241 Female 249 (43.7) 104 (41.4) 20 (52.6) 353 (43.0) 124 (42.9) 373 (43.4)
Alchol drinking habit
No drinking 252 (44.4) 101 (40.6) 22 (59.5) 353 (43.3) 123 (43.0) 375 (44.0) 0.300 0.914 0.149 Occasionally 178 (31.4) 83 (33.3) 8 (21.6) 261 (32.0) 91 (31.8) 269 (31.5)
Nearly every day 137 (24.2) 65 (26.1) 7 (18.9) 202 (24.8) 72 (25.2) 209 (24.5) Smoking habit
Never smoked 343 (60.3) 141 (56.2) 26 (68.4) 484 (59.0) 167 (57.8) 510 (59.4) 0.245 0.185 0.473 Ex-smokers 23 (4.0) 18 (7.2) 2 (5.3) 41 (5.0) 20 (6.9) 43 (5.0)
Current smokers 203 (35.7) 92 (36.7) 10 (26.3) 295 (36.0) 102 (35.3) 305 (35.5) Balance of food
Eat various food 227 (40.0) 108 (43.0) 15 (39.5) 335 (40.9) 123 (42.6) 350 (40.8) 0.899 0.658 0.982 Consider balance slightly 207 (36.4) 91 (36.3) 14 (36.8) 298 (36.4) 105 (36.3) 312 (36.4)
Rarely consider balance 134 (23.6) 52 (20.7) 9 (23.7) 186 (22.7) 61 (21.1) 195 (22.8) Exercise habit Frequently 38 (6.7) 20 (8.0) 2 (5.3) 58 (7.1) 22 (7.6) 60 (7.0) 0.943 0.849 0.900 Sometimes 172 (30.2) 72 (28.7) 12 (31.6) 244 (29.8) 84 (29.1) 256 (29.8) No exercise 359 (63.1) 159 (63.3) 24 (63.2) 518 (63.2) 183 (63.3) 542 (63.2) Sleeping habit Suficiently 93 (16.3) 48 (19.2) 7 (18.4) 141 (17.2) 55 (19.1) 148 (17.3) 0.671 0.502 0.526 Normal 411 (72.2) 176 (70.4) 29 (76.3) 587 (71.7) 205 (71.2) 616 (71.9) Insufficiently 65 (11.4) 26 (10.4) 2 (5.3) 91 (11.1) 28 (9.7) 93 (10.9) Japanese definition Sex Male 328 (57.2) 151 (59.7) 19 (48.7) 479 (58.0) 170 (55.8) 498 (57.6) 0.419 0.783 0.252 Female 245 (42.8) 102 (40.3) 20 (51.3) 347 (42.0) 122 (44.2) 367 (42.4)
Alchol drinking habit
No drinking 251 (44.0) 103 (41.0) 22 (57.9) 354 (43.1) 125 (44.3) 376 (43.8) 0.425 0.975 0.200 Occasionally 178 (31.2) 83 (33.1) 9 (23.7) 261 (31.8) 92 (31.1) 270 (31.4)
Nearly every day 141 (24.7) 65 (25.9) 7 (18.4) 206 (25.1) 72 (24.6) 213 (24.8) Smoking habit
Never smoked 340 (59.4) 140 (55.3) 27 (69.2) 480 (58.2) 167 (60.4) 507 (58.7) 0.134 0.118 0.369 Ex-smokers 24 (4.2) 20 (7.9) 2 (5.1) 44 (5.3) 22 (3.9) 46 (5.3)
Current smokers 208 (36.4) 93 (36.8) 10 (25.6) 301 (36.5) 103 (35.7) 311 (36.0) Balance of food
Eat various food 230 (40.3) 110 (43.5) 16 (41.0) 340 (41.3) 126 (43.2) 356 (41.3) 0.894 0.619 0.997 Consider balance slightly 207 (36.3) 91 (36.0) 14 (35.9) 298 (36.2) 105 (37.8) 312 (36.2)
Rarely consider balance 134 (23.5) 52 (20.6) 9 (23.1) 186 (22.6) 61 (19.0) 195 (22.6) Exercise habit Frequently 39 (6.8) 19 (7.5) 2 (5.1) 58 (7.0) 21 (6.0) 60 (6.9) 0.965 0.897 0.895 Sometimes 171 (29.9) 71 (28.1) 12 (30.8) 242 (29.3) 83 (28.9) 254 (29.4) No exercise 362 (63.3) 163 (64.4) 25 (64.1) 525 (63.6) 188 (65.2) 550 (63.7) Sleeping habit Suficiently 93 (16.3) 49 (19.4) 7 (17.9) 142 (17.2) 56 (15.8) 149 (17.3) 0.579 0.382 0.507 Normal 413 (72.2) 178 (70.6) 30 (76.9) 591 (71.7) 208 (70.2) 621 (72.0) Insufficiently 66 (11.5) 25 (9.9) 2 (5.1) 91 (11.0) 27 (9.3) 93 (10.8) ( ), %.
NCEP-ATPIII, National Cholesterol Education Program-Adult Treatment panel III. * Additive model.
† Dominant model. ‡ Recessive model (c2 test).
Statistical analysis
We used Student’s t-test and analysis of variance
to compare continuous variables and the c
2test to
compare categorical variables. Quantitative
vari-ables were expressed as the mean ± SD. The hazard
ratio and 95% confidence interval of each factor
for incidence of MS were estimated by univariate
and multivariate Cox proportional-hazards models
adjusted for sex, age, smoking, drinking, exercise,
eating and sleeping habits. The onset of metabolic
syndrome was defined as the day of health
check-up when an employee had a diagnosis of metabolic
syndrome. Analysis was performed using PASW
Statistics 18 (SPSS Japan, Tokyo). The significance
level was set to P values of less than 0.05.
Results
The distributions of genotype and characteristics
of study subjects are shown in Tables 1 to 3. The
relative frequencies of TT homozygote, TA
het-erozygote and AA homozygote in rs9939609 were
66.4%, 29.2%, 4.4% and 66.2%, 29.3%, 4.5%
ac-cording to the NCEP-ATP III and Japanese
defini-tions, respectively. Those of GG, GA and AA in
rs1121980 were 60.0%, 34.6%, 5.4% and 59.8%,
34.7%, 5.5% according to the NCEP-ATP III and
Japanese definitions, respectively. Those of TT, TA
and AA in rs1558902 were 66.6%, 29.1%, 4.3% and
66.5%, 29.1%, 4.4% according to the NCEP-ATP III
and Japanese definitions, respectively.
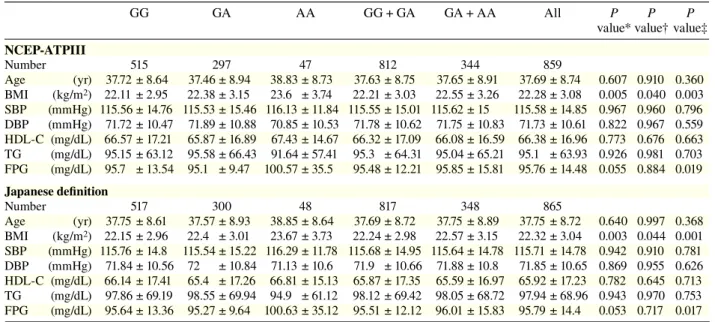
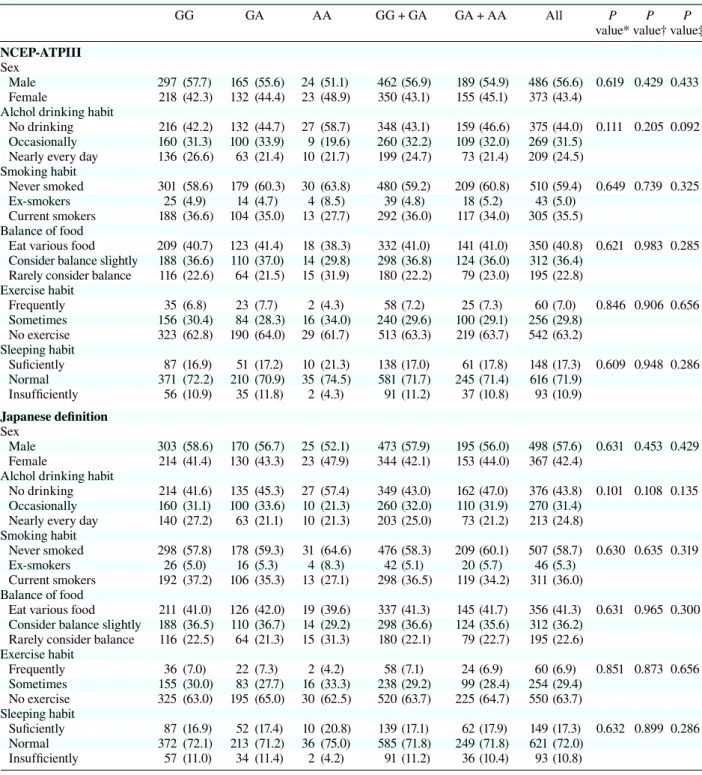
In both the NCEP-ATP III and Japanese
defi-nitions, the three SNPs, rs9939609, rs1121980 and
rs1558902, were significantly associated with the
BMI, as shown in Tables 1a, 2a and 3a, but there
was no association between genotypes and
life-styles, such as drinking, smoking, eating, exercise
and sleeping habits. Moreover, for rs1121980 and
rs1558902, there were significant differences on
FPG.
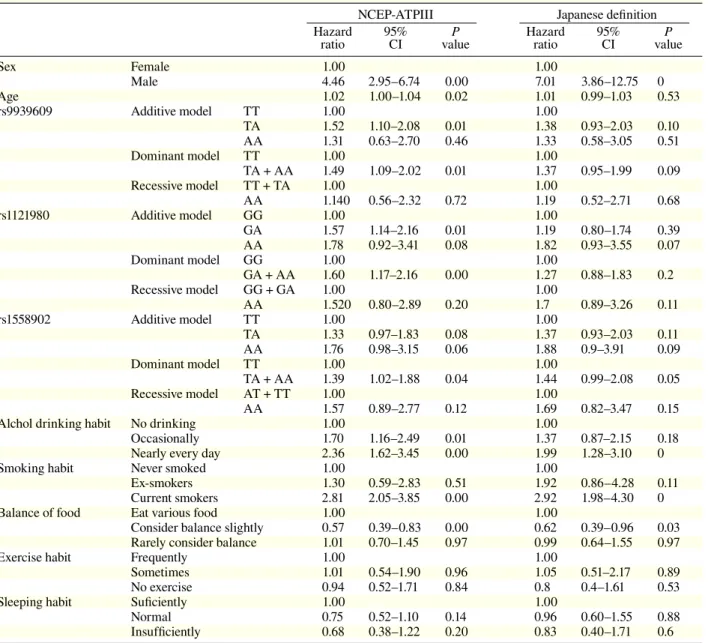
Results of univariate analyses of the hazard
ratios for MS of gene polymorphism and the indices
are shown in Table 4. According to the NCEP-ATP
III definition, the hazard ratios of sex, age, additive
Table 2a. Clinical characteristics per genotype in rs1121980GG GA AA GG + GA GA + AA All P P P
value* value† value‡
NCEP-ATPIII Number 515 297 47 812 344 859 Age (yr) 37.72 ± 8.64 37.46 ± 8.94 38.83 ± 8.73 37.63 ± 8.75 37.65 ± 8.91 37.69 ± 8.74 0.607 0.910 0.360 BMI (kg/m2) 22.11 ± 2.95 22.38 ± 3.15 23.6 ± 3.74 22.21 ± 3.03 22.55 ± 3.26 22.28 ± 3.08 0.005 0.040 0.003 SBP (mmHg) 115.56 ± 14.76 115.53 ± 15.46 116.13 ± 11.84 115.55 ± 15.01 115.62 ± 15 115.58 ± 14.85 0.967 0.960 0.796 DBP (mmHg) 71.72 ± 10.47 71.89 ± 10.88 70.85 ± 10.53 71.78 ± 10.62 71.75 ± 10.83 71.73 ± 10.61 0.822 0.967 0.559 HDL-C (mg/dL) 66.57 ± 17.21 65.87 ± 16.89 67.43 ± 14.67 66.32 ± 17.09 66.08 ± 16.59 66.38 ± 16.96 0.773 0.676 0.663 TG (mg/dL) 95.15 ± 63.12 95.58 ± 66.43 91.64 ± 57.41 95.3 ± 64.31 95.04 ± 65.21 95.1 ± 63.93 0.926 0.981 0.703 FPG (mg/dL) 95.7 ± 13.54 95.1 ± 9.47 100.57 ± 35.5 95.48 ± 12.21 95.85 ± 15.81 95.76 ± 14.48 0.055 0.884 0.019 Japanese definition Number 517 300 48 817 348 865 Age (yr) 37.75 ± 8.61 37.57 ± 8.93 38.85 ± 8.64 37.69 ± 8.72 37.75 ± 8.89 37.75 ± 8.72 0.640 0.997 0.368 BMI (kg/m2) 22.15 ± 2.96 22.4 ± 3.01 23.67 ± 3.73 22.24 ± 2.98 22.57 ± 3.15 22.32 ± 3.04 0.003 0.044 0.001 SBP (mmHg) 115.76 ± 14.8 115.54 ± 15.22 116.29 ± 11.78 115.68 ± 14.95 115.64 ± 14.78 115.71 ± 14.78 0.942 0.910 0.781 DBP (mmHg) 71.84 ± 10.56 72 ± 10.84 71.13 ± 10.6 71.9 ± 10.66 71.88 ± 10.8 71.85 ± 10.65 0.869 0.955 0.626 HDL-C (mg/dL) 66.14 ± 17.41 65.4 ± 17.26 66.81 ± 15.13 65.87 ± 17.35 65.59 ± 16.97 65.92 ± 17.23 0.782 0.645 0.713 TG (mg/dL) 97.86 ± 69.19 98.55 ± 69.94 94.9 ± 61.12 98.12 ± 69.42 98.05 ± 68.72 97.94 ± 68.96 0.943 0.970 0.753 FPG (mg/dL) 95.64 ± 13.36 95.27 ± 9.64 100.63 ± 35.12 95.51 ± 12.12 96.01 ± 15.83 95.79 ± 14.4 0.053 0.717 0.017
Data are numbers of subjects, divided into genotype groups, and values are mean ± SD.
BMI, body mass index; DBP, diastolic blood pressure; FPG, fasting plasma glucose; HDL-C, high density lipoprotein-cholesterol; NCEP-ATPIII, National Cholesterol Education Program-Adult Treatment panel III; SBP, systolic blood pressure; TG, triglyceride. * Additive model (analysis of variance): comparison among 3 groups (GG versus GA versus AA).
† Dominant model (t-test): comparison of GG + GA with AA. ‡ Recessive model (t-test): comparison of GG with GA + AA.
Table 2b. Lifestyle characteristics per genotypes in rs1121980
GG GA AA GG + GA GA + AA All P P P
value* value† value‡
NCEP-ATPIII Sex
Male 297 (57.7) 165 (55.6) 24 (51.1) 462 (56.9) 189 (54.9) 486 (56.6) 0.619 0.429 0.433 Female 218 (42.3) 132 (44.4) 23 (48.9) 350 (43.1) 155 (45.1) 373 (43.4)
Alchol drinking habit
No drinking 216 (42.2) 132 (44.7) 27 (58.7) 348 (43.1) 159 (46.6) 375 (44.0) 0.111 0.205 0.092 Occasionally 160 (31.3) 100 (33.9) 9 (19.6) 260 (32.2) 109 (32.0) 269 (31.5)
Nearly every day 136 (26.6) 63 (21.4) 10 (21.7) 199 (24.7) 73 (21.4) 209 (24.5) Smoking habit
Never smoked 301 (58.6) 179 (60.3) 30 (63.8) 480 (59.2) 209 (60.8) 510 (59.4) 0.649 0.739 0.325 Ex-smokers 25 (4.9) 14 (4.7) 4 (8.5) 39 (4.8) 18 (5.2) 43 (5.0)
Current smokers 188 (36.6) 104 (35.0) 13 (27.7) 292 (36.0) 117 (34.0) 305 (35.5) Balance of food
Eat various food 209 (40.7) 123 (41.4) 18 (38.3) 332 (41.0) 141 (41.0) 350 (40.8) 0.621 0.983 0.285 Consider balance slightly 188 (36.6) 110 (37.0) 14 (29.8) 298 (36.8) 124 (36.0) 312 (36.4)
Rarely consider balance 116 (22.6) 64 (21.5) 15 (31.9) 180 (22.2) 79 (23.0) 195 (22.8) Exercise habit Frequently 35 (6.8) 23 (7.7) 2 (4.3) 58 (7.2) 25 (7.3) 60 (7.0) 0.846 0.906 0.656 Sometimes 156 (30.4) 84 (28.3) 16 (34.0) 240 (29.6) 100 (29.1) 256 (29.8) No exercise 323 (62.8) 190 (64.0) 29 (61.7) 513 (63.3) 219 (63.7) 542 (63.2) Sleeping habit Suficiently 87 (16.9) 51 (17.2) 10 (21.3) 138 (17.0) 61 (17.8) 148 (17.3) 0.609 0.948 0.286 Normal 371 (72.2) 210 (70.9) 35 (74.5) 581 (71.7) 245 (71.4) 616 (71.9) Insufficiently 56 (10.9) 35 (11.8) 2 (4.3) 91 (11.2) 37 (10.8) 93 (10.9) Japanese definition Sex Male 303 (58.6) 170 (56.7) 25 (52.1) 473 (57.9) 195 (56.0) 498 (57.6) 0.631 0.453 0.429 Female 214 (41.4) 130 (43.3) 23 (47.9) 344 (42.1) 153 (44.0) 367 (42.4)
Alchol drinking habit
No drinking 214 (41.6) 135 (45.3) 27 (57.4) 349 (43.0) 162 (47.0) 376 (43.8) 0.101 0.108 0.135 Occasionally 160 (31.1) 100 (33.6) 10 (21.3) 260 (32.0) 110 (31.9) 270 (31.4)
Nearly every day 140 (27.2) 63 (21.1) 10 (21.3) 203 (25.0) 73 (21.2) 213 (24.8) Smoking habit
Never smoked 298 (57.8) 178 (59.3) 31 (64.6) 476 (58.3) 209 (60.1) 507 (58.7) 0.630 0.635 0.319 Ex-smokers 26 (5.0) 16 (5.3) 4 (8.3) 42 (5.1) 20 (5.7) 46 (5.3)
Current smokers 192 (37.2) 106 (35.3) 13 (27.1) 298 (36.5) 119 (34.2) 311 (36.0) Balance of food
Eat various food 211 (41.0) 126 (42.0) 19 (39.6) 337 (41.3) 145 (41.7) 356 (41.3) 0.631 0.965 0.300 Consider balance slightly 188 (36.5) 110 (36.7) 14 (29.2) 298 (36.6) 124 (35.6) 312 (36.2)
Rarely consider balance 116 (22.5) 64 (21.3) 15 (31.3) 180 (22.1) 79 (22.7) 195 (22.6) Exercise habit Frequently 36 (7.0) 22 (7.3) 2 (4.2) 58 (7.1) 24 (6.9) 60 (6.9) 0.851 0.873 0.656 Sometimes 155 (30.0) 83 (27.7) 16 (33.3) 238 (29.2) 99 (28.4) 254 (29.4) No exercise 325 (63.0) 195 (65.0) 30 (62.5) 520 (63.7) 225 (64.7) 550 (63.7) Sleeping habit Suficiently 87 (16.9) 52 (17.4) 10 (20.8) 139 (17.1) 62 (17.9) 149 (17.3) 0.632 0.899 0.286 Normal 372 (72.1) 213 (71.2) 36 (75.0) 585 (71.8) 249 (71.8) 621 (72.0) Insufficiently 57 (11.0) 34 (11.4) 2 (4.2) 91 (11.2) 36 (10.4) 93 (10.8) ( ), %.
NCEP-ATPIII, National Cholesterol Education Program-Adult Treatment panel III. * Additive model.
† Dominant model. ‡ Recessive model (c2 test).
and dominant models of rs9939609 and rs1121980
and the dominant model of rs1558902 were
signifi-cantly high. According to the Japanese definition,
that of only sex was significantly high. In both
defi-nitions, drinking and smoking habits showed
sig-nificantly high risks, but regarding balance of food,
considering balance showed a significantly low risk.
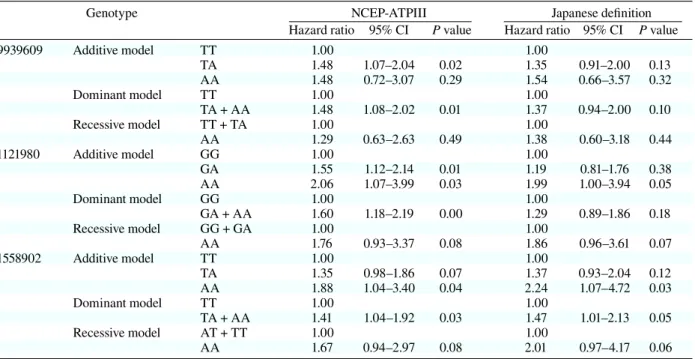
After adjusting for age, sex and lifestyle
(drinking, smoking, eating, exercise and sleeping
habit), results of multivariate analysis are shown in
Table 5. According to the NCEP-ATP III definition,
results were almost the same as single variant
anal-ysis. But the hazard ratio was significantly higher
in the additive model of rs1558902. In the Japanese
definition, the additive model of rs1558902 was a
significant high risk for MS.
Discussion
In the present study, a retrospective cohort study
over 9 years was performed in Japanese
work-ers to investigate the association of three SNPs,
rs9939609, rs1121980 and rs1558902, in the FTO
with the incidence of MS diagnosed by the
NCEP-ATPIII and Japanese definitions.
The frequencies of genotypes and alleles in the
FTO were similar to those in other studies in
Japa-nese (Hotta et al., 2008; Shimaoka et al., 2010). In
contrast, those of genotypes and alleles in other
eth-nic groups were remarkably different from those in
Japanese. By the HapMap database (http://hapmap.
ncbi.nlm.nih.gov/), the frequencies of the rs9939609
A allele were 0.14 in Chinese and Japanese, 0.45 in
CEPH Europeans and 0.52 in Yorubans. Therefore,
the effect and importance of genetic factors makes
differences among ethnic groups.
According to the NCEP-ATPIII definition, the
three SNPs in the FTO were significantly associated
with BMI. Moreover, rs1121980 and rs1558902 were
associated with FPG. These results were consistent
with previous studies (Horikoshi et al., 2007; Hotta
et al., 2008; Tabara et al., 2009; Hotta et al., 2010;
Shimaoka et al., 2010). However, in both the
NCEP-ATPIII and Japanese definitions, none of the three
SNPs were associated with sex and lifestyle
(drink-ing, smok(drink-ing, eat(drink-ing, exercise and sleeping habit).
The three SNPs clarified by not only univariate, but
also multivariate analysis adjusting for age, sex and
lifestyle were significantly associated with the
inci-dence of MS diagnosed by the NCEP-ATPIII
defi-nition. By the Japanese definition, only rs1558902
Table 3a. Clinical characteristics per genotype in rs1558902TT TA AA TT + TA TA + AA All P P P
value* value† value‡
NCEP-ATPIII Number 572 250 37 822 287 859 Age (yr) 37.73 ± 8.58 37.36 ± 9.14 39.41 ± 8.54 37.62 ± 8.75 37.62 ± 9.08 37.69 ± 8.74 0.407 0.864 0.224 BMI (kg/m2) 22.08 ± 2.92 22.55 ± 3.25 23.58 ± 3.95 22.22 ± 3.03 22.68 ± 3.36 22.28 ± 3.08 0.005 0.008 0.009 SBP (mmHg) 115.37 ± 14.78 115.86 ± 15.41 117.03 ± 12.14 115.52 ± 14.96 116.01 ± 15.01 115.58 ± 14.85 0.757 0.548 0.546 DBP (mmHg) 71.62 ± 10.59 71.93 ± 10.6 72.16 ± 11.17 71.71 ± 10.59 71.96 ± 10.65 71.73 ± 10.61 0.899 0.658 0.801 HDL-C (mg/dL) 66.73 ± 17.3 65.14 ± 16.45 69.3 ± 14.69 66.25 ± 17.05 65.67 ± 16.27 66.38 ± 16.96 0.262 0.389 0.285 TG (mg/dL) 95.08 ± 63.8 95.72 ± 66.03 91.35 ± 51.67 95.27 ± 64.45 95.16 ± 64.29 95.1 ± 63.93 0.928 0.986 0.715 FPG (mg/dL) 95.47 ± 13.07 95.36 ± 9.79 102.95 ± 39.64 95.44 ± 12.16 96.34 ± 16.96 95.76 ± 14.48 0.008 0.405 0.002 Japanese definition Number 575 252 38 827 290 865 Age (yr) 37.76 ± 8.55 37.48 ± 9.15 39.42 ± 8.43 37.67 ± 8.73 37.73 ± 9.06 37.75 ± 8.72 0.441 0.968 0.228 BMI (kg/m2) 22.12 ± 2.92 22.56 ± 3.09 23.67 ± 3.94 22.26 ± 2.98 22.71 ± 3.23 22.32 ± 3.04 0.003 0.008 0.005 SBP (mmHg) 115.54 ± 14.81 115.89 ± 15.14 117.21 ± 12.03 115.64 ± 14.9 116.06 ± 14.76 115.71 ± 14.78 0.777 0.622 0.523 DBP (mmHg) 71.73 ± 10.66 72.05 ± 10.57 72.47 ± 11.19 71.83 ± 10.63 72.1 ± 10.63 71.85 ± 10.65 0.865 0.625 0.714 HDL-C (mg/dL) 66.28 ± 17.52 64.71 ± 16.79 68.47 ± 15.36 65.8 ± 17.31 65.2 ± 16.63 65.92 ± 17.23 0.312 0.384 0.351 TG (mg/dL) 98.02 ± 70.18 98.13 ± 68.03 95.47 ± 56.95 98.05 ± 69.49 97.78 ± 66.6 97.94 ± 68.96 0.975 0.962 0.822 FPG (mg/dL) 95.45 ± 12.92 95.48 ± 9.92 102.95 ± 39.11 95.46 ± 12.08 96.46 ± 16.96 95.79 ± 14.4 0.007 0.332 0.002
Data are numbers of subjects, divided into genotype groups, and values are mean ± SD.
BMI, body mass index; DBP, diastolic blood pressure; FPG, fasting plasma glucose; HDL-C, high density lipoprotein-cholesterol; NCEP-ATPIII, National Cholesterol Education Program-Adult Treatment panel III; SBP, systolic blood pressure; TG, triglyceride. * Additive model (analysis of variance): comparison among 3 groups (TT versus TA versus AA).
† Dominant model (t-test): comparison of TT + TA with AA. ‡ Recessive model (t-test): comparison of TT with TA + AA.
was significantly associated with MS. Moreover, in
rs1121980 and rs1558902, the hazard ratio for MS
by the NCEP-ATPIII definition became higher as
the number of risk alleles increased. Thus, it was
suggested that the A allele at three SNPs is a risk
allele and is at substantially increased risk of MS.
Table 3b. Lifestyle characteristics per genotypes in rs1558902TT TA AA TT + TA TA + AA All P P P
value* value† value‡
NCEP-ATPIII Sex
Male 327 (57.2) 142 (56.8) 17 (45.9) 469 (57.1) 159 (55.4) 486 (56.6) 0.409 0.622 0.182 Female 245 (42.8) 108 (43.2) 20 (54.1) 353 (42.9) 128 (44.6) 373 (43.4)
Alcohol drinking habit
No drinking 246 (43.2) 107 (43.1) 22 (61.1) 353 (43.2) 129 (45.4) 375 (44.0) 0.274 0.718 0.098 Occasionally 179 (31.5) 83 (33.5) 7 (19.4) 262 (32.1) 90 (31.7) 269 (31.5)
Nearly every day 144 (25.3) 58 (23.4) 7 (19.4) 202 (24.7) 65 (22.9) 209 (24.5) Smoking habit
Never smoked 340 (59.5) 144 (57.6) 26 (70.3) 484 (59.0) 170 (59.2) 510 (59.4) 0.659 0.979 0.342 Ex-smokers 28 (4.9) 13 (5.2) 2 (5.4) 41 (5.0) 15 (5.2) 43 (5.0)
Current smokers 203 (35.6) 93 (37.2) 9 (24.3) 296 (36.1) 102 (35.5) 305 (35.5) Balance of food
Eat various food 227 (39.8) 108 (43.2) 15 (40.5) 335 (40.9) 123 (42.9) 350 (40.8) 0.890 0.641 0.970 Consider balance slightly 209 (36.7) 90 (36.0) 13 (35.1) 299 (36.5) 103 (35.9) 312 (36.4)
Rarely consider balance 134 (23.5) 52 (20.8) 9 (24.3) 186 (22.7) 61 (21.3) 195 (22.8) Exercise habit Frequently 39 (6.8) 19 (7.6) 2 (5.4) 58 (7.1) 21 (7.3) 60 (7.0) 0.936 0.837 0.890 Sometimes 174 (30.5) 70 (28.0) 12 (32.4) 244 (29.7) 82 (28.6) 256 (29.8) No exercise 358 (62.7) 161 (64.4) 23 (62.2) 519 (63.2) 184 (64.1) 542 (63.2) Sleeping habit Sufficiently 94 (16.5) 48 (19.3) 6 (16.2) 142 (17.3) 54 (18.9) 148 (17.3) 0.675 0.673 0.520 Normal 414 (72.5) 173 (69.5) 29 (78.4) 587 (71.6) 202 (70.6) 616 (71.9) Insufficiently 63 (11.0) 28 (11.2) 2 (5.4) 91 (11.1) 30 (10.5) 93 (10.9) Japanese definition Sex Male 334 (58.1) 146 (57.9) 18 (47.4) 480 (58.0) 164 (56.6) 498 (57.6) 0.428 0.666 0.193 Female 241 (41.9) 106 (42.1) 20 (52.6) 347 (42.0) 126 (43.4) 367 (42.4)
Alcohol drinking habit
No drinking 245 (42.8) 109 (43.6) 22 (59.5) 354 (43.1) 131 (45.6) 376 (43.8) 0.328 0.560 0.143 Occasionally 179 (31.3) 83 (33.2) 8 (21.6) 262 (31.9) 91 (31.7) 270 (31.4)
Nearly every day 148 (25.9) 58 (23.2) 7 (18.9) 206 (25.1) 65 (22.6) 213 (24.8) Smoking habit
Never smoked 337 (58.7) 143 (56.7) 27 (71.1) 480 (58.1) 170 (58.6) 507 (58.7) 0.533 0.876 0.258 Ex-smokers 29 (5.1) 15 (6.0) 2 (5.3) 44 (5.3) 17 (5.9) 46 (5.3)
Current smokers 208 (36.2) 94 (37.3) 9 (23.7) 302 (36.6) 103 (35.5) 311 (36.0) Balance of food
Eat various food 230 (40.1) 110 (43.7) 16 (42.1) 340 (41.2) 230 (40.1) 356 (41.3) 0.877 0.597 0.966 Consider balance slightly 209 (36.5) 90 (35.7) 13 (34.2) 299 (36.2) 209 (36.5) 312 (36.2)
Rarely consider balance 134 (23.4) 52 (20.6) 9 (23.7) 186 (22.5) 134 (23.4) 195 (22.6) Exercise habit Frequently 40 (7.0) 18 (7.1) 2 (5.3) 58 (7.0) 20 (6.9) 60 (6.9) 0.929 0.787 0.892 Sometimes 173 (30.1) 69 (27.4) 12 (31.6) 242 (29.3) 81 (27.9) 254 (29.4) No exercise 361 (62.9) 165 (65.5) 24 (63.2) 526 (63.7) 189 (65.2) 550 (63.7) Sleeping habit Sufficiently 94 (16.4) 49 (19.5) 6 (15.8) 143 (17.3) 55 (19.0) 149 (17.3) 0.618 0.586 0.486 Normal 416 (72.5) 175 (69.7) 30 (78.9) 591 (71.6) 205 (70.9) 621 (72.0) Insufficiently 64 (11.1) 27 (10.8) 2 (5.3) 91 (11.0) 29 (10.0) 93 (10.8) ( ), %.
NCEP-ATPIII, National Cholesterol Education Program-Adult Treatment panel III. * Additive model.
† Dominant model. ‡ Recessive model (c2 test).
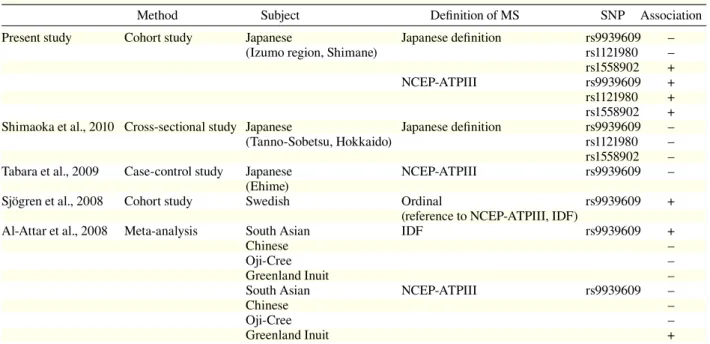
In the present study, we showed an
associa-tion between SNPs FTO and MS diagnosed by
the NCEP-ATP III and Japanese definitions which
disagreed with the results of Shimaoka et al. (2010)
and Tabara et al. (2009). However, according to the
NCEP-ATP III definition used internationally, this
study were consistent with the results of Sjögren
et al. (2008) and Al-Attar et al. (2008) in Swedish,
French, Inuit, and Chinese specific ethnic groups
(Table 6). To investigate the importance of FTO
SNPs in Japanese populations, further studies should
be carried out in more extensive Japanese subjects.
The average of BMI in subjects was 22.3 ±
3.1 kg/m
2, which is close to the Japanese average of
around 30 years of age. The hazard ratios of
life-style for MS in univariate analysis were not
signifi-cantly associated with food, exercise and sleeping
habits. Lifestyle is known as a risk factor of MS,
but an association with these habits was not found;
however, we performed the investigation in 1998
and as for these lifestyles, we speculate the index
easily changed during the 9 years between 1998 and
Table 4. Hazard ratios of gender, age and lifestyle for MS by genotype (univariate analysis)NCEP-ATPIII Japanese definition Hazard 95% P Hazard 95% P
ratio CI value ratio CI value
Sex Female 1.00 1.00 Male 4.46 2.95–6.74 0.00 7.01 3.86–12.75 0 Age 1.02 1.00–1.04 0.02 1.01 0.99–1.03 0.53 rs9939609 Additive model TT 1.00 1.00 TA 1.52 1.10–2.08 0.01 1.38 0.93–2.03 0.10 AA 1.31 0.63–2.70 0.46 1.33 0.58–3.05 0.51 Dominant model TT 1.00 1.00 TA + AA 1.49 1.09–2.02 0.01 1.37 0.95–1.99 0.09 Recessive model TT + TA 1.00 1.00 AA 1.140 0.56–2.32 0.72 1.19 0.52–2.71 0.68 rs1121980 Additive model GG 1.00 1.00 GA 1.57 1.14–2.16 0.01 1.19 0.80–1.74 0.39 AA 1.78 0.92–3.41 0.08 1.82 0.93–3.55 0.07 Dominant model GG 1.00 1.00 GA + AA 1.60 1.17–2.16 0.00 1.27 0.88–1.83 0.2 Recessive model GG + GA 1.00 1.00 AA 1.520 0.80–2.89 0.20 1.7 0.89–3.26 0.11 rs1558902 Additive model TT 1.00 1.00 TA 1.33 0.97–1.83 0.08 1.37 0.93–2.03 0.11 AA 1.76 0.98–3.15 0.06 1.88 0.9–3.91 0.09 Dominant model TT 1.00 1.00 TA + AA 1.39 1.02–1.88 0.04 1.44 0.99–2.08 0.05 Recessive model AT + TT 1.00 1.00 AA 1.57 0.89–2.77 0.12 1.69 0.82–3.47 0.15 Alchol drinking habit No drinking 1.00 1.00
Occasionally 1.70 1.16–2.49 0.01 1.37 0.87–2.15 0.18 Nearly every day 2.36 1.62–3.45 0.00 1.99 1.28–3.10 0
Smoking habit Never smoked 1.00 1.00
Ex-smokers 1.30 0.59–2.83 0.51 1.92 0.86–4.28 0.11 Current smokers 2.81 2.05–3.85 0.00 2.92 1.98–4.30 0 Balance of food Eat various food 1.00 1.00
Consider balance slightly 0.57 0.39–0.83 0.00 0.62 0.39–0.96 0.03 Rarely consider balance 1.01 0.70–1.45 0.97 0.99 0.64–1.55 0.97
Exercise habit Frequently 1.00 1.00
Sometimes 1.01 0.54–1.90 0.96 1.05 0.51–2.17 0.89 No exercise 0.94 0.52–1.71 0.84 0.8 0.4–1.61 0.53
Sleeping habit Suficiently 1.00 1.00
Normal 0.75 0.52–1.10 0.14 0.96 0.60–1.55 0.88 Insufficiently 0.68 0.38–1.22 0.20 0.83 0.40–1.71 0.6 CI, confidence interval; MS, metabolic syndrome; NCEP-ATPIII, National Cholesterol Education Program-Adult Treatment panel III.
Table 5. Hazard ratios of gender, age and lifestyle for MS by genotype (multivariate analysis)
Genotype NCEP-ATPIII Japanese definition Hazard ratio 95% CI P value Hazard ratio 95% CI P value
rs9939609 Additive model TT 1.00 1.00 TA 1.48 1.07–2.04 0.02 1.35 0.91–2.00 0.13 AA 1.48 0.72–3.07 0.29 1.54 0.66–3.57 0.32 Dominant model TT 1.00 1.00 TA + AA 1.48 1.08–2.02 0.01 1.37 0.94–2.00 0.10 Recessive model TT + TA 1.00 1.00 AA 1.29 0.63–2.63 0.49 1.38 0.60–3.18 0.44 rs1121980 Additive model GG 1.00 1.00 GA 1.55 1.12–2.14 0.01 1.19 0.81–1.76 0.38 AA 2.06 1.07–3.99 0.03 1.99 1.00–3.94 0.05 Dominant model GG 1.00 1.00 GA + AA 1.60 1.18–2.19 0.00 1.29 0.89–1.86 0.18 Recessive model GG + GA 1.00 1.00 AA 1.76 0.93–3.37 0.08 1.86 0.96–3.61 0.07 rs1558902 Additive model TT 1.00 1.00 TA 1.35 0.98–1.86 0.07 1.37 0.93–2.04 0.12 AA 1.88 1.04–3.40 0.04 2.24 1.07–4.72 0.03 Dominant model TT 1.00 1.00 TA + AA 1.41 1.04–1.92 0.03 1.47 1.01–2.13 0.05 Recessive model AT + TT 1.00 1.00 AA 1.67 0.94–2.97 0.08 2.01 0.97–4.17 0.06 Adjusted for sex, age and lifestyle (drinking, smoking, eating, exercise and sleeping habits).
CI, confidence interval; MS, metabolic syndrome; NCEP-ATPIII, National Cholesterol Education Program-Adult Treatment panel III.
2006. Thus, lifestyles varied with the incidence of
MS. According to alcohol and smoking habits, there
were significant associations with MS. Lifestyle is
the factor that is hard to be changed and it strongly
affects the onset of MS.
It was reported that risk allele carriers were 3 kg
heavier than non-carriers (Dina et al., 2007; Frayling
et al., 2007). It has been reported that lifestyle
altera-tions can reduce the risk of MS (Fappa et al., 2008),
even in individuals carrying the MS-susceptibility
variant of FTO. Therefore, genotyping SNPs of FTO
in an individual may be effective for personalized
preventive medicine in Japanese populations.
In the present study, we could not determine
the mechanism of FTO SNPs affecting the
preva-lence of MS. So far, the function of the FTO was
revealed gradually, and there was evidence that
the FTO was involved in the development of
obe-sity. FTO mRNA was widely expressed in fetal
and adult tissues, especially in the brain, and in
particular the hypothalamus, which is involved in
energy balance (Dina et al., 2007; Frayling et al.,
2007; Gerken et al., 2007). Moreover, several
stud-ies suggested that risk-allele carriers had greater
food intake in human subjects (Cecil et al., 2008;
Speakman et al., 2008), but not all (Tanofsky-Kraff
et al., 2009). The risk-allele in human FTO may
enhance the expression and/or activity of the FTO
(Church et al., 2010). Thus, overexpression of the
FTO may lead to increased food intake, resulting
in obesity. However, the precise mechanism of how
the FTO affects obesity and MS is not clear yet.
Most reports which have studied the
relation-ship between polymorphism in the FTO and MS
were analyzed using case-control or cross-sectional
studies (Al-Attar et al., 2008; Tabara et al., 2009;
Shimaoka et al., 2010) (Table 6). A retrospective
co-hort study among workers, not hospital-based, was
employed in the present study. Although a cohort
study was employed to reduce the effect of biases
compared to the case-control study, some limitations
remain. First, the relatively young subject population
and healthy-worker effect due to selection of subjects
after medical checkups at the time of employment
may have decreased subjects with MS and affected
the results of the study. Second, regarding the
sam-Table 6. Association of FTO genotype with MS
Method Subject Definition of MS SNP Association Present study Cohort study Japanese Japanese definition rs9939609 –
(Izumo region, Shimane) rs1121980 – rs1558902 + NCEP-ATPIII rs9939609 + rs1121980 + rs1558902 + Shimaoka et al., 2010 Cross-sectional study Japanese Japanese definition rs9939609 – (Tanno-Sobetsu, Hokkaido) rs1121980 – rs1558902 – Tabara et al., 2009 Case-control study Japanese NCEP-ATPIII rs9939609 – (Ehime)
Sjögren et al., 2008 Cohort study Swedish Ordinal rs9939609 + (reference to NCEP-ATPIII, IDF)
Al-Attar et al., 2008 Meta-analysis South Asian IDF rs9939609 +
Chinese –
Oji-Cree –
Greenland Inuit –
South Asian NCEP-ATPIII rs9939609 –
Chinese –
Oji-Cree –
Greenland Inuit +
FTO, fat mass and obesity associated gene; IDF, International Diabetes Federation; MS, metabolic syndrome; NCEP-ATPIII, National Cholesterol Education Program-Adult Treatment panel III; SNP, single nucleotide polymorphism.
ple size, we could not recruit enough numbers of the
risk A-allele homozygous genotype. Results
present-ed above nepresent-ed to be further verifipresent-ed with increaspresent-ed
numbers. Because we did not have the data of
ab-dominal circumference of subjects, we used BMI
for classification of Japanese metabolic syndrome
in substitution for abdominal circumference. Since
BMI ≥ 25 is a good surrogate measure of abdominal
obesity among the Japanese population (Otsuka and
Kawada, 2010), the effect of misclassification of the
abdominal obesity to the study results is considered
small.
In our results, we indicated that rs9939609,
rs1121980 and rs1558902 in the FTO may be
sig-nificantly associated with the incidence of MS
di-agnosed by the NCEP-ATP III in Japanese subjects,
and by the Japanese definition the association
ap-plied to rs1558902. It is considered that there is the
linkage disequilibrium between three SNPs assessed
in the present study; however, we did not assessed
statistically. SNPs may be an important risk
fac-tor for the future incidence of MS in the Japanese.
Therefore, knowing earlier whether individuals are
risk allele carriers may be useful in preventing MS
References
1 Al-Attar SA, Pollex RL, Ban MR, Young TK, Bjerregaard P, Anand SS, et al. Association between the FTO rs9939609 polymorphism and the metabolic syndrome in a non-Caucasian multi-ethnic sample. Car-diovasc Diabetol 2008;7:5.
2 Andreasen CH, Stender-Petersen KL, Mogensen MS, Torekov SS, Wegner L, Andersen G, et al. Low physi-cal activity accentuates the effect of the FTO rs9939609 polymorphism on body fat accumulation. Diabetes 2008;57:95–101.
3 Cecil JE, Tavendale R, Watt P, Hetherington MM, Palmer CNA. An obesity-associated FTO gene variant and increased energy intake in children. N Engl J Med 2008;359:2558–2566.
4 Church C, Moir L, McMurray F, Girard C, Banks GT, Teboul L, et al. Overexpression of Fto leads to increased food intake and results in obesity. Nat Genet 2010;42:1086–1093.
5 Dina C, Meyre D, Gallina S, Durand E, Körner A, Jacobson P, et al. Variation in FTO contributes to childhood obesity and severe adult obesity. Nat Genet 2007;39:724–726.
6 Eckel RH, Grundy SM, Zimmet PZ. The metabolic syndrome. Lancet 2005;365:1415–1428.
7 Fappa E, Yannakoulia M, Pitsavos C, Skoumas I, Valourdou S, Stefanadis C. Lifestyle intervention in the management of metabolic syndrome: could we improve
8 Fischer J, Koch L, Emmerling C, Vierkotten J, Peters T, Brüning JC, Rüther U. Inactivation of the Fto gene pro-tects from obesity. Nature 2009;458:894–898.
9 Frayling TM, Timpson NJ, Weedon MN, Zeggini E, Freathy RM, Lindgren CM, et al. A common variant in the FTO gene is associated with body mass index and predisposes to childhood and adult obesity. Science 2007;316:889–894.
10 Gerken T, Girard CA, Tung YC, Webby CJ, Saudek V, Hewitson KS, et al. The obesity-associated FTO gene encodes a 2-oxoglutarate-dependent nucleic acid de-methylase. Science 2007;318:1469–1472.
11 González-Sánchez, JL, Zabena C, Martínez-Larrad MT, Martínez-Calatrava MJ, Pérez-Barba M, Serrano-Ríos M. Variant rs9939609 in the FTO gene is associated with obesity in an adult population from Spain. Clin En-docrinol 2009;70:390–393.
12 Groop L. Genetics of the metabolic syndrome. Br J Nutr 2000;83(Suppl 1):S39–S48.
13 Grundy SM, Cleeman JI, Daniels SR, Donato KA, Eckel RH, Franklin BA, et al. Diagnosis and manage-ment of the metabolic syndrome. An American Heart Association/National Heart, Lung, and Blood Institute Scientific Statement. Circulation 2005;112:2735–2752. 14 Hinney A, Nguyen TT, Scherag A, Friedel S, Brönner
G, Müller TD, et al. Genome wide association (GWA) study for early onset extreme obesity supports the role of fat mass and obesity associated gene (FTO) variants. PLoS One 2007;2:e1361.
15 Horikoshi M, Hara K, Ito C, Shojima N, Nagai R, Ueki K, et al. Variations in the HHEX gene are associated with increased risk of type 2 diabetes in the Japanese population. Diabetologia 2007;50:2461–2466.
16 Hotta K, Nakamura M, Nakamura T, Matsuo T, Nakata Y, Kamohara S, et al. Polymorphisms in NRXN3, TFAP2B, MSRA, LYPLAL1, FTO and MC4R and their effect on visceral fat area in the Japanese popula-tion. J Hum Genet 2010;55:738–742.
17 Hotta K, Nakata Y, Matsuko T, Kamohara S, Kotani K, Komatsu R, Itoh N, et al. Variations in the FTO gene are associated with severe obesity in the Japanese. J Hum Genet 2008;53:546–553.
18 Karasawa S, Daimon K, Sasaki S, Toriyama S, Oizumi T, Susa S, et al. Association of the common fat mass and obesity associated (FTO) gene polymorphism with
obe-sity in a Japanese population. Endocr J 2010;57:293–301. 19 Li H, Wu Y, Loos RJ, Hu FB, Liu Y, Wang J, et al. Vari-ants in the fat mass- and obesity-associated (FTO) gene are not associated with obesity in a Chinese Han popu-lation. Diabetes 2008;57:264–268.
20 Ohashi J, Naka I, Kimura R, Natsuhara K, Yamaguchi T, Furusawa T, et al. FTO polymorphism in oceanic popu-lations. J Hum Genet 2007;52:1031–1035.
21 Omori S, Tanaka Y, Takahashi A, Hirose H, Kashiwagi A, Kaku K, et al. Association of CDKAL1, IGF2BP2, CDKN2A/B, HHEX, SLC30A8, and KCNJ11 with sus-ceptibility to type 2 diabetes in a Japanese population. Diabetes 2008;57:791–795.
22 Otsuka T, Kawada T. Validity of using body mass index as a surrogate measure of abdominal obesity. Circ J 2010;74:383.
23 Scuteri A, Sanna S, Chen WM, Uda M, Albai G, Strait J, et al. Genome-wide association scan shows genetic vari-ants in the FTO gene are associated with obesity-related traits. PLoS Genet 2007;3:e115.
24 Shimaoka I, Kamide K, Ohishi M, Katsuya T, Akasaka H, Saitoh S, et al. Association of gene polymorphism of the fat-mass and obesity-associated gene with insulin resistance in Japanese. Hyperten Res 2010;33:214–218. 25 Sjögren M, Lyssenko V, Jonsson A, Berglund G,
Nilsson P, Groop L, Orho-Melander M. The search for putative unifying genetic factors for components of the metabolic syndrome. Diabetologia 2008;51:2242–2251. 26 Speakman JR, Rance KA, Johnstone AM.
Polymor-phisms of the FTO gene are associated with variation in energy intake, but not energy expenditure. Obesity 2008;16:1961–1965.
27 Tabara Y, Osawa H, Guo H, Kawamoto R, Onuma H, Shimizu I, et al. Prognostic significance of FTO geno-type in the development of obesity in Japanese: the J-SHIPP study. Int J Obes 2009;33:1243–1248.
28 Tanofsky-Kraff M, Han JC, Anandalingam K, Shomaker LB, Columbo KM, Wolkoff LE, et al. The FTO gene rs9939609 obesity-risk allele and loss of con-trol over eating. Am J Clin Nurtr 2009;90:1483–1488.
Received March 23, 2012; accepted May 7, 2012 Corresponding author: Yoneatsu Osaki, MD, PhD