Title
Pressure-Controlled On-column Injection Method for
Microcolumn Liquid Chromatography( 本文(Fulltext) )
Author(s)
TAKEUCHI, Toyohide; KIMURA, Takuya; JIN, Ji-Ye;
FUJIMOTO, Chuzo; OHTA, Kazutoku; LEE, Kwang-Pill;
RYOO, Je-Jeong; CHOI, Seong-Ho
Citation
[Analytical sciences : the international journal of the Japan
Society for Analytical Chemistry] vol.[19] no.[9]
p.[1265]-[1267]
Issue Date
2003-09-10
Rights
The Japan Society for Analytical Chemistry (日本分析化学会)
Version
出版社版 (publisher version) postprint
URL
http://hdl.handle.net/20.500.12099/27148
Introduction
Microcolumn liquid chromatography (µLC) has been investigated for the last quarter century, and its features and advantages of downsizing the separation columns have been demonstrated.1–11 Generally, a small volume of the sample solution must be loaded onto separation columns so as not to cause any deterioration of the column efficiency in µLC. Such a small volume injection has been done by direct injection using microvalve injectors or split injection. In order to increase the injection volume, i.e., to improve the concentration sensitivity, precolumn and on-column enrichment methods have also been proposed in µLC.12–19 However, in µLC with a mechanically-driven pump the flow rate of the mobile phase is likely to decrease when the sample valve is switched. This is especially apparent for large-volume loop injection because of a decrease in the inlet pressure. This drawback can be overcome when a pressure-driven flow system is used.
The injection volume is changed by the volume of the loop or the ditch (or hole) of the microvalve injectors, whereas it is changed by the split ratio for split injection. However, it is not easy to change the injection volume for both the microvalve and split-injection methods. It is convenient if the injection volume can be altered for each analysis in µLC.
The present paper describes an on-column injection method for µLC. The injection volume can be controlled by the applied pressure and the loading time. The proposed injection system will allow us to alter the injection volume using a single system.
Experimental
ApparatusAn on-column injection system was assembled from a Model M-445 Six-Way Micro Selection Valve (Upchurch Scientific, Oak Harbor, WA, USA), a laboratory-made anion-exchange separation column (100 ×0.32 mm i.d.), and a UV-970 UV-Vis detector (Jasco, Tokyo, Japan), as shown in Fig. 1. The eluent was supplied from a 0.8-mL loop attached to a six-way micro selection valve under constant pressure. The pressure was supplied from an argon cylinder, and was regulated by using a Model 26-1014-24 pressure regulator (Tescom, Minneapolis, MN, USA). On the contrary, the sample was loaded from a 0.2-mL loop attached to a six-way micro selection valve at constant pressure. The pressure was supplied from a nitrogen cylinder, and was regulated by a Model CFC14PP flow controller (Shimadzu, Kyoto, Japan). The detector was operated at 210 nm, and the data were collected by a C-R4AX Chromatopac data processor (Shimadzu). In addition, the dead volume, viz., the volume of the ditch, of the six-way micro selection valve was around 50 nl.
A laboratory-made separation column was prepared by using fused-silica tubing, as reported previously.20 TSKgel IC-Anion-SW (5 µm; Tosoh, Tokyo, Japan) was selected as the packing material and operated in an anexchange mode with an ion-exchange capacity of ca. 0.40 mequiv g–1.
On-column injection method
The eluent was supplied to the separation column when the position of the six-way micro selection valve was switched to A, as shown in Fig. 1. After the column was equilibrated with an eluent supplied at an argon pressure of 30 kgf/cm2, the position of the selection valve was switched to between A and
1265 ANALYTICAL SCIENCES SEPTEMBER 2003, VOL. 19
2003 © The Japan Society for Analytical Chemistry
Pressure-Controlled On-column Injection Method for
Microcolumn Liquid Chromatography
Toyohide T
AKEUCHI,*
1†Takuya K
IMURA,*
1Ji-Ye J
IN,*
2Chuzo F
UJIMOTO,*
3Kazutoku O
HTA,*
4Kwang-Pill L
EE,*
5Je-Jeong R
YOO,*
5and Seong-Ho C
HOI*5*1 Department of Chemistry, Faculty of Engineering, Gifu University, 1-1 Yanagido, Gifu 501–1193, Japan
*2 Instrumental Analysis Center, Gifu University, 1-1 Yanagido, Gifu 501–1193, Japan
*3 Department of Chemistry, Hamamatsu University School of Medicine, Hamamatsu 431–3192, Japan
*4 Ceramics Research Institute, National Institute of Advanced Industrial Science and Technology,
2266-98 Anagahora, Simoshidami, Moriyama-ku, Nagoya 463–8560, Japan
*5 Department of Chemistry Education, Kyungpook National University, Sangeok-Dong, Taegu 702-701, Korea
A pressure-controlled on-column injection method was developed for microcolumn liquid chromatography. The system was assembled from a syringe pump, a Model M-445 Six-Way Micro Selection Valve, a separation column and a UV detector. The injection volume could be regulated by changing the applied pressure and/or the sample loading time. The system was evaluated in the ion-exchange mode. The system was applied to the determination of anions in river-water samples.
(Received February 5, 2003; Accepted July 14, 2003)
†To whom correspondence should be addressed.
B, where the pressure kept in the separation column was released. The position of the selection valve was then switched to B in order to completely release the pressure in the column. Otherwise, a quick drop in the pressure would deteriorate the column efficiency. The sample was loaded when the position of the selection valve was switched to C. The volume could be regulated by the applied pressure and the loading time. The position of the selection valve was finally switched to A to start the separation. In addition, river-water samples were filtered by a 0.45-µm membrane filter before the analysis.
Reagents
All reagents were obtained from Nacalai Tesque (Kyoto, Japan), and were used as received without any further treatment. Purified water was produced in the laboratory by using a GS-590 water-distillation system (Advantec, Tokyo, Japan).
Results and Discussion
Effect of the applied pressure and loading time
Figure 2 shows the effect of the applied pressure on the peak area of the analyte, where the loading time was kept constant for 60 s and the eluent was supplied by argon gas at 30 kgf/cm2. A linear relationship between the two parameters was observed. The result shows that the injection volume can be regulated by the pressure. It can be seen that the applied pressure should exceed 0.8 kgf/cm2to load the sample. In addition, it should be noted that the loaded volume was 0.23 – 0.25 µL when the applied pressure was kept at 3.0 kgf/cm2under the conditions given in Fig. 2.
The effect of the sample loading time on the signal intensity is shown in Fig. 3, where the applied pressure for sample loading was kept at 3.0 kgf/cm2. It can be seen that the peak area is almost linear to the sample loading time under the conditions given in Fig. 3. It can be concluded that the sample injection volume can be controlled by both the applied pressure and the sample loading time.
In Figs. 2 and 3, the peak area is plotted against the applied pressure or the sample loading time, respectively. It should be noted that plotting the peak height against the applied pressure or the sample loading time also gave linear relationships. This
means that band broadening caused by large-volume injection is negligible under the conditions given in Figs. 2 and 3.
Reproducibility, linearity and detection limits
The reproducibility of the retention time, the peak height and the peak area was measured by conducting six successive measurements under the same conditions as in Fig. 2, except for the applied pressure for sample loading, 3.0 kgf/cm2. The relative standard deviation (RSD) values for nitrite and nitrate are given in Table 1. It can be seen that the present determination method is reproducible for nitrite and nitrate.
The peak height and peak area were linear up to 1.0 mM for nitrite and nitrate under the conditions given in Table 1. The detection limits at S/N = 3 under the conditions in Table 1 were 0.33 ppm (7.2 µM) and 0.38 ppm (6.1 µM) for nitrite and nitrate, respectively. The detection limits could be improved by increasing the sample loading time and/or the applied pressure for sample loading. For example, the detection limits were improved by a factor of ten when the loading time was 600 s. Separation of nitrite and nitrate
Figure 4 demonstrates the separation of 50 µM each of iodate, nitrite and nitrate in the ion-exchange mode. It is found that the
1266 ANALYTICAL SCIENCES SEPTEMBER 2003, VOL. 19
Fig. 1 Diagram of the on-column injection system. 1, Gas cylinder (argon); 2, gas cylinder (nitrogen); 3, pressure regulator; 4, pressure regulator; 5, loop for eluent; 6, loop for sample; 7, six-way selection valve; 8, separation column; 9, UV detector; 10, data processor.
Fig. 2 Effect of the applied pressure on the signal intensity. Column, TSKgel IC-Anion-SW, 100 ×0.32 mm i.d.; eluent, 15 mM sodium sulfate; applied pressure for the eluent, 30 kgf/cm2; applied
pressure for sample loading, as indicated; sample loading time, 60 s; sample, 1 mM sodium nitrite; wavelength of UV detection, 210 nm.
Fig. 3 Effect of the sample loading time on the signal intensity. Applied pressure for sample loading, 3.0 kgf/cm2; sample loading
time, as indicated; sample, 1 mM sodium nitrate; other operating conditions as in Fig. 2.
analytes were well separated in 10 min. The sample was loaded at 3.0 kgf/cm2for 600 s, where around 2.5 µL of the sample is expected to be loaded onto the separation column. For an accurate determination of nitrite and nitrate, iodate was added as an internal standard. The detection limits at S/N = 3 under the conditions given in Fig. 4 were 33 ppb (0.72 µM) and 38 ppb (0.61 µM) for nitrite and nitrate, respectively. In addition, a ghost peak eluted in 1 – 2 min was due to impurities contained in the sample solution. The ghost peak was not retained on the column, but about a one-minute band width of the peak is due to the fact that the loaded impurities traveled through the column during the loading for 600 s at 3.0 kgf/cm2. On the contrary, the analyte anions were focused on the head of the separation column during the loading for 600 s because the sample solution had a weaker solvent strength than the eluent.
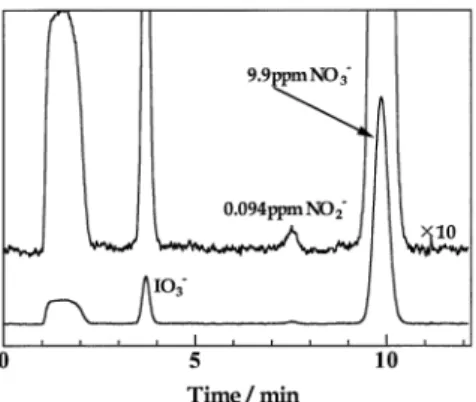
The present system could be applied to the determination of nitrite and nitrate in water samples. Figure 5 demonstrates the chromatogram for an Ijira River water sample. Only nitrite and nitrate can be clearly identified in the sample. The concentrations of nitrite and nitrate in the river water, as calculated according to the peak area, were determined to be 0.094 ppm and 9.9 ppm, respectively.
Conclusions
The injection volume could be controlled by the sample loading
time and/or the applied pressure for sample loading in µLC. The present sample-loading method is convenient for altering the injection volume. An increase in the injection volume could improve the sensitivity. The present injection system will also be applicable to capillary columns with smaller inner diameters.
Acknowledgements
The authors gratefully acknowledge the Takeda Foundation for financial support. The authors also wish to thank Japan Society for Promotion of Science for support under the Japan-Korea Basic Scientific Cooperation Program (2001 – 2002).
References
1. D. Ishii, Jasco Report, 1974, 11(6), 1.
2. R. P. W. Scott and P. Kucera, J. Chromatogr., 1976, 125, 251.
3. K. Hibi, D. Ishii, I. Fujishima, T. Takeuchi, and T. Nakanishi, J. High Resolut. Chromatogr. Chromatogr. Commun., 1978, 1, 21.
4. T. Tsuda and M. V. Novotny, Anal. Chem., 1978, 50, 632. 5. J. W. Jorgenson and E. J. Guthrie, J. Chromatogr., 1983,
255, 335.
6. K. Jinno, Chromatographia, 1988, 25, 1004.
7. J. E. MacNair, K. C. Lewis, and J. W. Jorgenson, Anal. Chem., 1997, 69, 983.
8. T. F. Hooker and J. W. Jorgenson, Anal. Chem., 1997, 69, 4134.
9. F. E. Regnier, J. High Resolut. Chromatogr., 2000, 23, 19. 10. N. Tanaka, H. Nagayama, H. Kobayashi, T. Ikegami, K.
Hosoya, N. Ishizuka, H. Minakuchi, K. Nakanishi, K. Cabrera, and D. Lubda, J. High Resolut. Chromatogr.,
2000, 23, 111.
11. T. Takeuchi, J. Anal. Bioanal. Chem., 2003, 375, 25. 12. T. Takeuchi and D. Ishii, J. Chromatogr., 1981, 218, 199. 13. H. Terada, M. Asanoma, and Y. Sakabe, J. Chromatogr.,
1985, 318, 299.
14. T. Takeuchi, Y. Jin, and D. Ishii, J. Chromatogr., 1985, 321, 159.
15. H. W. Mueller and J. Eitel, J. Chromatogr. B, 1996, 678, 137.
16. M. A. Rezai, G. Famiglini, and A. Cappiello, J. Chromatogr. A, 1996, 742, 69.
17. A. Cappiello, G. Famiglini, and A. Berloni, J. Chromatogr. A, 1997, 768, 215.
18. M. D. Foster, M. A. Arnold, J. A. Nichols, and S. R. Bakalyar, J. Chromatogr. A, 2000, 869, 231.
19. L. Lim, T. Miwa, and T. Takeuchi, Anal. Sci., 2001, 17, i887.
20. T. Takeuchi and D. Ishii, J. Chromatogr., 1981, 213, 25.
1267 ANALYTICAL SCIENCES SEPTEMBER 2003, VOL. 19
Table 1 RSD values for nitrite and nitrate
Nitrite 0.58 1.4 2.0
Nitrate 0.67 1.4 2.1
Analyte
RSD (%) for six successive measurements Retention time Peak height Peak area
The operating conditions were as given in Fig. 2, except for the applied pressure for sample loading, 3.0 kgf/cm2.
Fig. 4 Separation of a standard mixture of inorganic anions. Applied pressure for sample loading, 3.0 kgf/cm2; sample loading
time, 600 s; sample, sodium iodate, sodium nitrite and sodium nitrate, 50 µM each; other operating conditions as in Fig. 2.
Fig. 5 Separation of inorganic anions in river water. Applied pressure for sample loading, 3.0 kgf/cm2; sample loading time, 600 s;
sample, river water spiked with 50 µM sodium iodate; other operating conditions as in Fig. 2.