Quality Changes of Labor Input in Japan
著者
Imamura Hajime
雑誌名
経済論集
巻
11
号
1
ページ
p369-402
発行年
1986-01
URL
http://id.nii.ac.jp/1060/00005477/
Creative Commons : 表示 - 非営利 - 改変禁止 http://creativecommons.org/licenses/by-nc-nd/3.0/deed.ja369
Q
u
a
l
i
t
y
Changes o
f
Labor I
n
p
u
t
i
n
J
a
p
a
n
Hajime Imamura
ABSTRACT
This paper analyzes the characteristics of Japanese economic development by focusing on quality change in labor inputs. For that purpose, we investigate the changes of labor input in agriculture, manufacturing (including construction and mining) and service sectors, and we also analyze the sources of quality change in labor inputs in manufacturing and service sectors. Decomposition of quality change was made using the Divisia indices of labor input, which is consistent with a transcendentallogarithmic aggregator function.
A
comparison between Japan and the U. S. was made by citing some U. S. results from a comparable framework.The empirical results show that quality changes in labor inputs in Japan were positive through 1960-1979, and the sources of these quality changes were mainly an age effect, an education effect and the interactive effects of education-age and education-occupation. During this time, the Japanese economy was catching up with the
*
This is a preliminary paper in the co-research project“Energy and Economic Growth in the United States and Japan", which is in progress between Keio Econo-mic Observatory and Harvard University. This is a rivised version of which the author earlier published in Keio Economic Studies.370
techno1ogy of the U. S. and Western Europe. The resu1ts of this paper concerning the quality changes in 1abor inputs are consistent with this catch-up process. This is because the more the techno1ogy 1eve1 is enhanced through the deve10pment of origina1 techno1ogy, the more the quality change in 1abor input is required.
On the other hand, the comparison between the U. S. and Japan shows that qua1ity change in 1abor input in the U. S. was apparent-1y small compared to that of Japan, especially in terms of the sex and age effects. On1y the education effect turned out to have a significantly positive va1ue; however, its impact is reduced when as adjustment for occupation is made. These comparative results、
show that quality change in 1abor input has not been a contributing
-factor for productivity change in the U. S., whi1e it contributed significantly in Japan.
1. Introduction
The purpose of this paper is to ana1yze the characteristics of Japanese economic deve10pment by focusing on quality change in labor input. We decomposed quality change in labor input. One is; a demographic factor which is basically exogenous and determines the endowment of the heterogeneous labor input, and the other is an economic factor inc1uding techno1ogica1 conditions and market conditions of the economy. Therefore, quality change in labor input can be defined as the result of rationa1 behavior among economic entities under given market conditions, a given techno10gy and fixed factor endowment.
A framework which treats the above factors as endogenous vari -ab1e is the most preferab1e, but unfortunate1y we 1ack precise facts as to what is the dominant factor affecting quality change in 1abor input which of course depends on the stages of economic deve1op -ment. A1so we do not have many insights into the re1ationship.
Quality Changes of Labor Input in Japan 371
between economic growth and quality change caused by heteroge -neous labor. This paper represents a first step towards accurate understanding of the interdependent economic mechanism behind quality change in labor input.
1n addition, a comparative analysis between U. S. and Japan is made to investigate how the quality change in labor input differs between these two countries which have had different patterns of economic development.
Under the assumption of weak separability between labor inputs and other factor inputs, we can assume the existence of an aggre -gator function of heterogeneous labor inputs. This enables us to analyze the sources of quality change in labor input independently from other factor inputs. In aggregating labor inputs, we utilize
Divisia indices which are consistent with transcendentallogarithmic aggregator functions. Thus, our analysis is based on the neoclassical theory of production, and we assume labor quality under the pre -mise of equality between wage rates and the value of marginal prod ucti vi ties.
At first, let us briefly review previous research work on quality change in labor input in Japan.
The representative researches in the measurement of quality change in labor input in Japan are Watanabe~Egaizu (1968),
Deni-son~Chung (1976) and Tachibanaki (1973).
Watanabe~Egaizu measured quality change in labor input for 1951 -1964, and compared it with results for other developed countries. Quality change in labor input in Japan was relatively low, which they explained was the consequence of an imitation-lag in technical progress. That is to say, they considered that technical change at that time was embodied in imported capital goods. So, there was little need for highly qualified workers to be employed in devel -oping original technology. This resulted in a low level of quality
372
change in labor input. Finally they forecasted the characteristics of quality change in labor inputs which would occur after the end of the 1960's. Their prediction was that there would be high qual -ity change in labor input in the process of technological catch-up with the U. S. and Western Europe. The reason for this was high quality change in labor input is necessary for original technological developmen t.
On the other hand, the assertion made by Denison=Chung about quality change in labor input especially for the effect of education was opposite to the results of Watanabe=Egaizu. According to the estimation made by Denison for the period of 1953-1971, the con・
tribution of the education effect to economic growth (10. 4 percent per annum) was 0.41 percent per annum, while in Watanabe=Egaizu it was 0.06-0.18 percent.
Denison=Chung have some problem in their framework. They used the data cross-classified only by the age and sex. Education was not cross-classified. This imposes the strong restriction that the education effect was almost the same in all of age-sex categories.
We should draw on Tachibanaki(1973), who measured the quality change in labor input for 1956-1970. He found that the major source of quality change was education and especially experience.日owever, we have to point out that his framework of analysis treats the number of employees of a company as one of the measure of quality of labor, and that he measured labor input only by the numbers of persons, assuming hours were constant throughout the obser -vation period.
The contribution of this paper for the research in quality change in labor input is, at first, we measured quality change in labor input in 29 industries using Divisia index which is consistent with neoclassical theory of production under some necessary assump-tions. Not only singleベ:!imensional effects, but we analyzed all
Quality Changes of Labor Input in Japan 373
order of multi-dimensional effects which enables us to understand the quality change in labor input more systematically than any other previous researches. Secondly, we compiled huge amount of data for labor inputs cross-classified into age, sex, education, occupation and industry. Such kinds of data have not yet been developed consistently in time-series. Thirdly we compared quality change in labor inputs between U. S. and Japan in a more decom-posed manner than any other previous researches. And we look for the causes of difference in productivity change between U. S. and Japan more precisely.
2. Theoretical Framework for Measuring Labor Input 2.1 Measurement of Total Factor Productivity and the Divisia Index Let us consider the i-thindustrial sector, where the social account ing identity exists as follows:
(1) qiZi= ρ午X+ ρ~Ki+P~Li
where Zirepresents gross output of the i-thindustry, X interme-diate input, Ki capital input, Lilabor input, and qi, p~ , ρ~ , p~ , represent their respective prices. Defining total factor productivityP白 as (2) p;ニZ;jli where Zirepresents gross output, Iitotal factor input, ferentiating (1) logarithmically with respect to time, growth rate of total factor productivity: then dif -we get the (3) PPi Z=~J_ i TV~ r'X
J
:
-
ri T,_ V~ .LT:"- V~ ri K,
Tri"L ';' i -Zi ' X Xi ' K Ki ' L Liwhere V~ , V~ , V ~ are the value share of intermediate, and labor inputs in the total factor input respectively.
capital Equation (3) was introduced from the social accounting identity. On the other hand, the same equation can be introduced from the production function. Let us assume perfect competition in the
374
market, and that producers behave under the profit maximization principle. Further, suppose that there exists a production function with constant returns to sca1e:
(4) Zi=Fi(X, K;, Li, t)
Differenciating(4)10garithmically with respect to time we obtain
d1nZi o1nZi d1nXi , o1nZid1nKi , o1nZ; d1nLi ,δ1nZi
- 一 一 一 一 一 一 一 一 一 一 一
dt -o1nX dt I o1nKi dt I o1nLi dt ot
output e1asticity is equa1 to the va1ue (5)
Under perIect competition, share of each factor:
where V; =o1nZi(X, K;, Li' t)/ot, that is, we do not assume any specific neutrality of technica1 change in this framework
Each factor inputs appearing on the right hand side of equations (5) and (6) and a1so be disaggregated into more decomposed e1ements, when we define the constant returns to sca1e aggregator function under the assumption of separability of each factor input.
Xi = Xi (X1i, X2i,……, Xni)
Ki =Ki (Kli, K2i,……, Kpi)
Li=Li(Lli, L2i,……, Lqi)
Under the assumption of perfect competition in factor markets, differenciating (7) 10garithmically with respect to time, we obtain バ1nZ・ id1nXi , TTi d1nKi , TTi d1nL 一:~'=Vdt -. X d
ー
:
;
.
,
t+
V ~ ~'';:.'+
V ~一一一三 +V; l ' K dt " L dt (6) (7) X"i) 担旦主立ーもが担竺主立 dt 一声i. Xj dt d1nX-点 。1nX(Xli,……, dt 針 。1nXji (8) d1nK ; も o1nK;(Kli,……,Kpi) d1nK・ 一 一
ki よ TTi d1nKki dt 一 台i
o1nKki 守 dt 一 作i.
Kk dt Lqi) d1nLσ i d1nL1i ヲf=EVL27
「 these are the growth rates of Divisia indices of intermediate, capita1 and 1abor inputs respective1y.Here, we shou1d comment on the data. The discussion above was
q
Z
同 L ﹁ 'h
z
, G 一Quality Changes of Labor Input in ]apan 375
made in the wor1d of continuous data, but data in the real world can only be obtained as discrete form. To cope with a discrete data system, discrete approximation is needed. Equations (6)and (8)and be rewritten as follows (9) lnZ
,
(t)-lnZ,
(t-1) = V~(lnX(t) -lnXi(t-1))+
Vk(lnK;(t)-lnK;(t-1))+
V ~ (lnLi (t) -lnLi (t-1))+
V; where V〉= t〈 Vk以以
ω(οωtの)+V~μ
山(οt一札
VL=t (V九k(削 Vkμ
山(οt一1))Vi=き (V~
(tの
)
+
V~(οt一 1)).
V: =言
(
σ
V;(tの
)
+
V; ο(t-1) 一目 (ωlnX; (t)-lnX; (t-1) =L
J
V ~j (lnXji (t) -lnXji (t-1)) whereV~j = すく V~j 伽 V~j(t-1))
lnK; (t) -lnK,
(t-1)=
L
J
V ~(k (lnKki (t) -lnKk' (t-1)) whereV~j
=古 川 伽Vkj
(t ユ)) lnL,
(t) -lnLベ
t-1)=土
V
~,
(lnL" (t)一lnL,,(t-1) whereV~, す (V~, (t) 十 V~,
(t-1))These discrete type Divisia indices are in fact exact and superative index numbers of a translog aggregator function. Proof for this approximation given by Diewert (1976).
2.2 Measurement of the Quality Change in Labor Input
-376
geneity of labor input, we use equation(8)of(10)(discrete approx-imation of(8)).Then, we divide the index into a man-hour index and a quality index. Further we can decompose the quality index with respect to quality factors.
Let us assume there are only four quality factors of labor input, sex(s), oc氾upation(o), education(e) and age(a). We can define the
growth rate of the Divisia index of labor input employed in the i-th industry as follows. L 一 L Y
2
a
2
C
2 υ
2
s
.
ι
一 7 M where 行 列'sol!a.itLso何 臼 u 一 一Y"阿山 -~2J2J2J W,o山, L…,it
W
,
O叫 i,;
hourly wage rates of the soea-th labor input of thei-th industry
Lsocω ; quantity of labor input in terms of man-hours of the i-th industry
The quantity of labor input(L,oco,u) can be rewritten as the
product of total man-hours worked in the i-th industry(Mi,Hi,) and the proportion of man-hours worked by the soea-th type of labor input in the i-th industry(d,,,,,u).
。
2) Lsoeatit=
=
dsoea,itMitHitdifferenciating同 logarithmicallywith respect to time and substi -tuting into(11)yields (d,,,^,.u, Mi', Hu¥ 岬 z;;t=22F5252F:och訂版;二i' 十五十耳~) ''', fMi"Hit¥
=手平手手 V…,it宏之 +lEt+瓦~)
.
手
手
戸
手
V-ι
瓦+
・ M m 一M m+
一
川
v l2
a
2
e
2
0
2
s
Quality Changes of Labor Input in Japan 377 sum of quality change and growth rates in hours of work. The first term of the right hand side of (13) accounts for the quality change in labor input, and the second term accounts for the growth rate in hours of work of labor
By using discrete approximation, equation ωcan be rewritten as follows ( 1必 lnL;(t)-lnL; (t-1) = (lnM;(t) -lnM;(t-1))
+
(lnH;(t) -lnH;(t-1)) +2J平2
記t
(
χ九九o阿山山e刊 叫ω a川向a吋バ
;(,バベ
i(tωの)+t 九χ九叫山e剖Q,;(t . (lnd"" (,;t)-lnd",",; (t-1)) 2.3 Decomposition of Quality Change in Labor InputThe Divisia index of labor input increases through upward move-ment of quality change even though there is no increases in total hours worked. In reality, heterogeneity of labor input should be expressed not by one dimension, for example, education, but by multiple dimensions, education, sex, age and occupation, because, if individuals with a given educational attainment must either male or female and of a certain age. We cannot treat those measures of quality independently.
Let us call the quality change calculated from the single dimen-sion aggregator function as the main effect, and the difference between the multi-dimensional quality change as interactive effect.
To explain these two effects more precisely, we use a four dimensional classification of labor, sex(s), occupation(o), education (e) and age (a). We define the following five types of growth rates of Divisia indices
(15) Divisia growth rate of man-hour labor input lllnMH=L11n2J2J2J2J(MH)山 a
378
where s: sex classification (ma1e
&
fema1e)。:occupation (b1ue & white collar)
e
:
education(junior high school, senior high school, junior college and university graduates) α: age (1ess than 17, 18-19, 20-24, 25-29, 30-34, 35-39,40-44, 45-49, 54-50, 55-59, 60-64, and more than 65 years old)
'(16) First order Divisia growth rate of 1abor input A1nLi= 2JV;111n2J2J2J(MH);jkl
z=s, 0, e, a
j, k, l=s, 0, e, a (j, k, 1手i)
仕切 Second order Divisia growth rate of 1abor input
AlnLij= 2J2JVijA 1n2J2J(MH)ij
ム
j=s,0, e, a (i手j) k,l=s, 0, e,α(k,lチi,j) (18) Third order Divisia growth rate of 1abor input !1lnL;jk= 2J2J2JV,jk111n2J(MH)ijkl i, j, k=s, 0, e, a (i手j手k) l=s, 0, e, a (l手i,j, k) '(19) Fourth orderDivisia growth rate of 1abor input !1lnLiikl= 2J2J2J2JVijkl111n(MH);jkl 人j,k, l=s, 0, e,α(i手jチh手1)where V represents the va1ue share of the period, and 11 denotes the first difference operator.
Using these growth rates of Divisia indices, we define the main
・effectsand interactive effects for the quality change in 1abor in
-puts
.(21) Main effects for sex, occupation, education and age
Quality Changes of Labor Input in Japan 379
(22) First order interactive effects for quality change
qo;=d.lnLij-d. lnMH-qi-q j (i, j =s, 0, e, a) (iチj)
倒 Secondorder interactive effects for quality change qijk=d.lnLijk-Ll lnMH-qi-qjーの -qij-qik-qjk
(i, j, k=s, 0, e and a)
ωThird order interactive effects for quality change qi}kl=d.lnL;jkl-d.lnMH-qi-qj-qk-q
,
-qij-qik-qil-qjk-qjl-qkl-qijk-q ikl-qij
,
-qikl(i, j, k,l =s, 0, e and a) 制 Totalquality change in labor inputs lnL;jkl-LllnMH
=Main effects(qi十qj+q,,+ql)
+First order interactive effects(qij+qik+q, +qjk, 十qjl+qkl) +Second order interactive effects(qijk+qikl十qμ
,
+qijl)+Third order interactive effect(qijkl)
And, also we can define the marginal effects for each category as the eIfect of the n-th factor added to(n-1) factor of labor quality. (26) 乱1:arginaleffects for labor quality change
Sex : q,+q",十q, +q, .,十q",+q"" +q, +q,,,, oea
Occupation : q 0 +q" +q" +q 00 +q;oc +q "" +q""十q"日
Education : qι+q"十q"十q,,,斗q,ο,+q""+q'"a +q""
Age : q。十q何十q"a+q叫 +q""+q,a+q , '-i+q,叫
3. Data Compilation
The data source fer full四tIlneemployed workers in non-agricul
-tural industries was primarily the Basic Wage Structure Survey (BWSS). We obtained data for the numbers of employees, average hours worked, wages and bonuses cross classified by sex, occupa -tion, education and age. Industries for which data were available were Mining, Construction, 20 two digit level Manufacturing indus -tries and 6 twc-digit level service industries. Also, we obtained sub-aggregated BWSS data for Motor and Vehicles, so the total
380
number of industries available was 29. Data for Agriculture,
forestry and fishery are available from another source, Labor Force
Survey (LFS) , which was only classified by sex. The time period
for index construction was 1960-1979
W e should make a note here about the definition of a ful1-time
employee in BWSS. First, we begin with the definition of an
employee in BWSS.
(i) Workers employed with no particular contract with respect
to period of employment.
(ii) Workers employed with contracts for more than three
mon-ths
(iii) Temporary and daily workers employed in the same
enter-prise for more than 18 days in the preceeding 2 months respectively.
This category of employee is divided into full-time employees and
part-time employees. Full-time employees are defined as those employees whose hours of work are the usual daily contractual
hours, while part-time employees work less than that. As
part-time employees are not cross classified by sex, occupation,
educa-tion, age and industry, our analysis mainly focuses on ful1-time
employees.
According to the classification described in equation (16), we basi
-cally obtained data for 2 x 2 x 4 x 12= 192 categories of heterogeneous
labor for each of the 29 industries. However, in the process of data
construction, BWSS made a few estimates using LFS and Ma側
-fαcturing Census.
4. Empirical Results
In what follows, the magnitude of the contribution of quality change in labor input to economic growth is discussed, and the changes of labor input in agriculture, manufacturing and service sectors are analyzed. In addition, decomposition of quality change
Quality Changes of Labor Input in Japan 381
in labor input will be made with special references to sectoral changes in labor input. On the basis of these results, we will examine the relationship between quality change and the patterns of economic development in the Japanese economy.
Finally, characteristics of quality change in labor input in Japan
will be further clarified by a comparative analysis between the U. S. and Japan.
4.1 Sources of Economic Growth in Japan
Figure 1 and Table 1 show the time-series trend of economic growth and its sources during the period1960-1979 in Japan.V stands for the aggregate index of real domestic product.K' and L' repre -sent the Divisia index of capital and labor service inputs. L"''' denotes the simple adding-up index of man-hour labor input. K denotes the simple adding-up index of capital stock. The differences between L' and L"'''and between K' and K represent volume of quality changes of each input respectively. T. F. P. is an aggregate index of total factor productivity. T. F. P. 1 represents an index of total factor productivity, in which labor and capital input indices are evaluated by each Divisia index of input services, L' and K'. Contrary, T. F. P. 2 is an index of total factor productivity, in which labor and capital inputs are evaluated by each simple ad -ding-up index, L"'''and K.
Divisia index of labor service ioput, L' shows average annual growth rate of 3. 22 percent during the period1960-1979. On the other hand, man-hour index of labor input shows only 2.45 percent growth annually. This implies that quality change of labor input has been accomplished by around 1 percent annually. Quality change of capital input, which is shown in the difference between K and K', was significant in the Japanese economy. Rate of quality change in capital input has accomplished 11lore than 3 percent annually.
Quality Changes of Labor Input in Japan 383
Ifw e ignore such kinds of quality change in labor input and ιcapital inputs, almost 50 percent of economic growth in the Japanese economy should be due to the technical progress, which is shown in the index of total factor productivity, T. F. P.2. However, if w e can evaluate quality changes of labor and capital inputs accurately,
contribution of technical progress is evaluated as 25 percent, which is a half of the percentage in the previous evaluation.
4.2 Annual Growth of Sectoral Labor Input
Next, w e shal1highlight some of the main features of our results which are presented in tables 2 through 4.
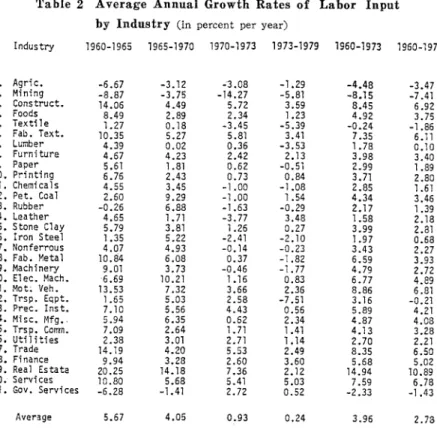
Table 2 Average Annual Growth Rates of Labor Input by Industry (in percent per year) lndustry 1960-1965 1965-1970 1970-1973 1973・1979 1960・1973 1960-1ヲ79 1. Aョric. -6.67 -3.12 -3.08 司1.2ヨ -4.48 -3.47 2. Mining -8.87 -3.75 -14.27 -5.81 -8.15 -7.41 3. Cons truct. 14.06 4.49 5.72 3.59 8.45 6.92 4. Foods 8.49 2.89 2.34 1.23 4.92 3.75 5. Texti 1 e l.27 0.18 -3.45 -5.3ヲ -0.24 -1.86 6. Fab. Text. 10.35 5.27 5.81 3.41 7.35 6.11 7. Lumber 4.3ヲ 0.02 0.36 -3.53 1.78 0.10 8. Furniture 4.67 4.23 2.42 2.13 3.98 3.40 ヲ. Paper 5.61 l.81 0.62 -0.51 2.99 1.89 10. Printing 6.76 2.43 0.73 0.84 3.71 2.80 11. Chemica1s 4.55 3.45 開1.00 -1.08 2.85 1.61 12. Pet. Coa1 2.60 9.29 -1.00 1.54 4.34 3.46 13. Rubber -0.26 6.88 -1.63 -0.29 2.17 1.39 14. Leather 4.65 1.71 -3.77 3.48 1.58 2.18 15. Stone C1ay 5.7ヨ 3.81 1.26 0.27 3.99 2.81 16. lron Stee1 1.35 5.22 -2.41 -2.10 1.97 0.68 17. Nonferγous 4.07 4.93 -0.14 -0.23 3.43 2.27 18. Fab. Meta1 10.84 6.08 0.37 -1.82 6.59 3.93 19. Machinery 9.01 3.73 -0.46 -1.77 4.79 2.72 20. E1ec. Mach. 6.69 10.21 1.16 0.83 6.77 4.89 21. Mot; Veh. 13.53 7.32 3.66 2.36 8.86 6.81 22. Trsp. Eqpt. 1.65 5.03 2.58 -7.51 3.16 -0.21 23. Prec. lnst. 7.10 5.56 4.43 0.56 5.8雪 4.21 24. Misc. Mfg. 5.94 6.35 0.62 2.34 4.87 4.08 25. Trsp. Corrl'n. 7.09 2.64 1. 71 1.41 4.13 3.28 26. Uti1ities 2.38 3.01 2.71 1.14 2.70 2.21 27. Trade 14.19 4.20 5.53 2.49 8.35 6.50 28. Finance 9.94 3.28 2.60 3.60 5.68 5.02 29. Rea1 Estata 20.25 14.18 7.36 2.12 14.94 10.8ヨ 30. Services 10.80 5.68 5.41 5.03 7.59 6.78 31. Gov. Servi ces -6.28 -1.41 2.72 0.52 -2.33 ー1.43 Average 5.67 4.05 0.93 0.24 3.96 2.73
384
Table 3 Average AnnuaI Growth Rates of Labor Quality by Industry (in percent per year) Industry 1960-1965 1965-1970 1970-1973 1973-1ヲ79 1960-1973 1960・1979 -1. Aョric. -0.10 0.31 3.39 1.00 0.87 O.雪O 2. Mininヨ 0.45 0.5ヲ -0.10 0.1宮 0.37 0.32 3. Construct. 0.64 0.39 0.59 0.82 0.53 0.63 4. Foods 0.03 1.51 0.58 0.70 0.72 0.72 5. Texti1e 0.22 1.68 1.54 0.98 1.08 1.05 6. Fab. Text. -0.17 1.48 0.06 0.47 0.52 0.51 7. Lumber -0.5自 0.23 0.66 0.28 0.02 0.10 8. Furniture -0.32 0.53 0.71 1.14 0.24 0.53 9. Paper 0.30 1.64 1.02 1.04 0.98 1.00 10. Printinョ 0.21 1.77 1.94 1.26 1.20 1.23 11. Chemi ca 1 s -0.02 1.51 1.19 1.57 0.85 1.07 12. Pet. Coa1 0.83 1.35 0.14 1.42 0.87 1.04 13. Rubber 2.70 1.21 1.68 1.37 1.89 1.73 14. Leather -0.52 0.78 1.11 0.37 0.36 0.36 15.3tone C1aey1 0.06 1.16 0.67 0.87 0.62 0.70 16. Iron Ste 0.45 0.95 1.17 1.11 0.81 0.90 17. Nonferrous -0.07 1.35 1.18 1.07 0.76 0.86 18. Fab. Meta1 0.85 1.30 1.24 0.69 1.12 0.98 19. Machinery 0.41 1.26 1.21 1.27 0.92 1.02 20. E1ec. Mach. 0.52 0.86 1.21 1.86 0.81 1.14 21.問。t.Veh. -0.83 1.51 1.67 1.41 0.64 0.88 22. Trsp. Eqpt. 0.19 0.82 -1.20 0.57 0.11 0.25 23. Prec. Inst. 0.02 1.62 0.92 1.24 0.84 O.ヨ7 24. Misc. Mfョ. 0.90 2.11 1.48 0.9ヲ 1.4ヲ 1.34 25. Trsp. Comm. 0.09 0.71 1.07 0.91 0.55 0.67 26. Uti 1 iti es 1.08 0.61 0.11 0.25 0.68 0.54 27. Trade 1.07 1.10 2.14 1.29 1.33 1.32 28. Finance -0.77 0.94 0.44 0.79 0.17 0.36 29. Rea1 Estate 0.86 1.25 0.91 0.56 1.02 0.88. 30. Servi ces -0.35 1.47 0.65 0.35 0.58 0.51 31. Gov. Services 0.44 -0.12 0.62 -0.05 0.27 0.17 Average 0.28 1.09 0.97 0.90 0.75 0.80
As should be expected for Japan, w e observe negative average annual growth rate of labor input for the following two “declining仲
industries: agriculture-forestry同fisheryand mining. For the entire
period 1960-1979, labor input in agriculture-forestry-fishery declined at -3.47 percent per year and at -7.41 percent per year in mining industry. In contrast to these declining industries, the rest of the industries exhibit growing labor input for the 1960's. This indicates that mobility of labor from traditional industries to modern indu-strial sector is one of the main features of the Japanese economic growth in the 1960's. In the 1970's however, w e observe negative growth of labor input particularly among heavy industries, which
Quality Changes of Labor Input in Japan 385 Table 4 Average Annual Growth Rates of Man田hour
Labor Input (in percent per year) I ndus try 1960・1965 1965・1970 1970・1973 1973・197ヲ 1960・1973 1960・1979 1.AHg1 rfc. -6.58 -3.43 -6.47 -2.29 -5.34 -4.38 2. Mining -9.32 -4.34 -14.17 -6.00 -8.52 -7.73 3. Construct. 13.42 4.10 5.12 2.77 7.92 6.30 4. Foods 8.46 1.38 1.75 0.53 4.18 3.04 5. Textile 1.04 -1.50 -4.99 -6.37 -1.33 -2.92 6. Fab. Text. 10.52 3.78 5.75 2.93 6.83 5.60 7. Lumber 4.98 -0.22 -0.30 -3.81 1.76 0.01 8. Furni ture 5.00 3.70 1.71 1.00 3.74 2.87 雪 Paper 5.30 0.17 -0.41 -1.56 2.01 0.88 10. Printing 6.55 6.72 ー1.21 -0.42 2.50 1.58 11. Cheπncals 4.57 1.94 -2.1ヲ -2.64 2.00 0.53 12. Pet. Coa1 1.77 7.ヲ4 -1.14 0.12 3.47 2.41 13. Rubber -2.96 5.67 -3.31 -1 ;66 0.28 -0.33 14. Leather 5.17 0.94 -4.88 3.11 1.22 1.82 15.Stane C1aey1 5.74 2.65 0.59 -0.60 3.36 2.11 16. Iron Ste 0.90 4.27 -3.58 -3.21 1.16 -0.22 17. Nonferrous 4.13 3.60 -1.32 -1.30 2.67 1.41 18. Fab. Meta1 9.99 4.77 -0.87 -2.52 5.48 2.96 19. Machinery 8.60 2.47 -1.67 -3.04 3.87 1.69 20. E1ec.問ach. 6.17 9.35 -0.04 -1.03 5.98 3.75 21. Mot. Veh. 14.36 5.81 2.00 0.96 8.22 5.92 22. Trsp. Eqpt. 1.45 4.21 3.78 -8.08 3.05 -0.46 23. Prec. Inst. 7.08 3.94 3.52 -0.68 5.05 3.24 24. Mi sc. Mfョ. 5.04 4.24 -0.85 1.35 3.37 2.73 25. Trsp. Comm. 7.00 1.93 0.65 0.50 3.58 2.61 26. Uti1ities 1.29 2.41 2.5ヨ 0.89 2.02 1.66 27. Trade 13.12 3.10 3.39 1.20 7.02 5.18 28. Finance 10.71 2.34 2.16 2.81 5.52 4.66 29. Rea1 Estate 19.3ヲ 12.93 6.46 1.56 13.92 10.01 30. Servi ces 11.15 4.21 4.77 4.68 7.01 6.27 31. Gov. Servi ces -6.72 -1.29 2.10 0.57 -2.60 ー1.60 Averaョe 5.40 2.96 -0.03 -0.65 3.21 1.99
is a sym ptom of“the first oil crisis. " In contrast to the manufa同
cturing sectors, tertiary industries, such as Trade, Finance and Service show a relatively stable and positive growth in labor.
The top diagram of Figure 2 to Figure 5 show the index for ordinary labor input, its man-hours worked, its worked hour and its labor quality during period 1960-1979 in light, material and fabricated manufacturing and tertiary industries. L in the figures represents index of man-hours worked and Q represents the index for labor quality. Finally L stands for the composite index of .quantity L and quality Q for labor input. In terms of man-hours worked the growth rate for manufacturing industry gradually begins
386
Figure 2 Decomposition of Labor Quality Change (Ordinary VVorker)
一一-Lightl¥Ianufacturing Industry一一一
i
n u • 内 〆 1.0〆
ヘ
/DfV12taIndex Of Labour Input-
-
-
-
-
- ーヘー/
(凶 . / ・hノ _ .
ー ー . -
.
メん,、、,〆戸 F 、一一ぜ、¥、 戸「イ~:." ~.~,; -...--. /グ fそF戸一_.ーーー_.-
Oivisia Qua1it
:
z
lndex of/
_-ーーー_----
Labour lnput (Q) ・可=こ・二・
ー
ー-..-.-ー-ー-.~ Hour lndex of Labour 1ヨ60 1970 197ヲ Contribution of Education 1.0-
ー
=
・
=f= i_I:::竺
.
-
.
.
.
.
一
一
一
ー
ー
ー
・
_
.
.
.
.
-
-
一
一
-
.
Margina1 Effect一一一一 ー・一一一一・一一一
lnteractive Effect 1960 1970 1979 Contribution of Sex . ι ----=-,=!.:::ア1~1=~~=・=-=,",-1τ?τ ・・..二‘=:ュ=・ユ畠':"."'1:品.-f~-I=-~~ Margina1 Effect lnteractive Effect 1雪60 1ヨ70 1ヨ7ヲ Contribution of Aae 一日一“・・・・・・・ー・_..--.-・4・ーー--- Margi na 1 Effect 弓-・一
ー-
一
ー・ー・ー・--".・ー・ーーー・・・・・ー ._._o一
一
一
一
一-一・ー・ー・一-一o
_
.
_
.
_
・ー・ー・ ln teracti ve Effect 1960 1970 197ヲ Contribution of Occuロation '_'主:I~= w:._-=:ニτ± ー ._.__._...._.__i_A
_
_
_
_
・-_..__.._...._....『
・
一
.
-
一一一ー一一一一一一
.
一
一
a c ゐ ﹂ 匂 + U 6 J CFo ρhp ド ﹄,
B gsa ﹄ F 脚 ﹄ w v ・1 1 a 令 l ・ 2 U 戸 、 na - - r q d e rt an u 円, i ・ 1970 197ヲ 1960QuaIity Changes of Labor Input in Japan 387 Figure 3 Decomposition of Labor Quality Change
(Ordinary VVorker) 一-MaterialManufacturing Industry一一一 2.0十
ー
ィ
タ
_
.
ご
ー
ペ
ν-_/
イー〆 、」ー「、 ..=:.f---'戸..::-;;・ .~二工ニ〉昭三ブ _.:;..-'- ~..""'---1.0了ム
司
=
・
tコご了こどご二
Oivisia lndex of labour lnput (Ls) Oivisia Quality lndex(Q) _ Man-hour lndex of labour(L) Hour lndex of labour 1960 1970 1ヨ7ヲ Contribution of Education 門 司 i 1 L To
_
=
.
_
,=口3・・hミ._-_._"ニニーてこご二二二二一 一 一 一 ・t二二二三二.一- Maroinal Effect lnteractive Effect 1960 1970 1979 Contribution of Sex 1 0 L I '---.l =-.~::-.I宮守宮‘宮,:",Jr-::-..I =J 雪空l::"'J=...(::"'., 宮古'I=J・=~'"哩E・~,・-・_,,~ Mlanrtgeir naca 1 ti vEeff Eecftfect 百万 旬7ヲ 1.0 "'_.~.・_.-"-" Marginal Effect '-':=1=~二7ニτ:二:二三二二-一一一一一一一一 I川eractiveEffect Contribution of Aoe 1960 1970 197宮 Contribution of Occuoation e i u t ρ ﹄ ι ・ー也戸令﹄ F o w ' ' t eE 苧 e g s a ﹄ p p ﹄ V V ・ 1 マ l 令 、 司 G r u n a- - r
dde rt a n M 刊 VL 1.0 -ーー・‘・,.,::.:...‘ユー.-'-=f=:!.=ご~二ご--三J守三三..・・・・ H ・4 ・・・・一・--..-ー・・・・..-....一一一一一一一一一一一一一
1960 1ヲ70 1979388
Figure 4 Decomposition of Labor Quality Change (Ordinary VVorker)
ー-FabricatedManufacturing Industry
一
一
一
2.0
r ¥
ー一./Divisia lndex of Labour Input(Ll Fvrr-一、¥_-/
九 ‘
グ . . ._....-.,.バ r~a 川our lndex of Labola (L)
:/ '-~・ シ ~ 4' , .---勺 1.0
.
_
.
_
.
_
.
.
-
‘
Divisia司uaT ityr ndex究。F-ム
一
.
_
.
-
.
-
.
.
--・・督、ー._..-ー・_ -・,一・ー._・-_.."_.-・a・ ー叫 - E・4一・-""'_'.
_
J
_
.
.
.
.
.
.
Hour 1 ndexoT Labour 1970 1979 1960 Contribution 0ヂEducation 1.0 -一・ー・担制=叫司=ー=:ーーー・ー,ー・・ード戸、-.ー..-.._-・-・ Mar宮ina1 Effect 一 一 一 - ー ー 一 一 , - -In民 間ctiveEffect 1960 1970 1979 contribution of Sex. 1,0 『由町'戸冒町;~~=‘=口:.=引.l=::~=~口-..口--.口'-'口=口':'.:=:=-口:.J.;:"7':':"....:~口, 円r'I1natrgeinraac 1 tivEeff Eecftfect 1960 1970 1979 1.0 1970 1ヲ79 Con tri bu ti on of Aoe φ し 也 ω F 岱 、 令 仁 、 . , a c , 白 a ι 、 、 F 炉 8 ι . ', ‘
ρ 、 r ﹄ γ T ﹄ φ i﹄• a c " “ 凋 f r 何 u 4 n 匂 F ι 令 i﹂﹄ a n M 川 T I 品 •一 一
戸 -h h 1970 197ヲ 1960 1.0 Contribution of Occuoatio円 -ー也..1=品位=1""~-::二=ヨヱゴこゴニーーーーーー一一一・・『・司何arginal Effect 一 一 一 - 一 一 一 一 lnteractiveEffect 1960Quality Changes of Labor Input in ]apan 389 Figure 5 Decomposition of Labor Quality Change
(Ordinary VVorker) 一一一ServiceIndustry一一一 Oi vi si a 1 ndex of Labour 1 npu t (Li;) 問丑n-hourIndex of Labour (i:) 2.0 , " '_・・・'.' -'、 -・... -. ノ , , F ,
.
, , 1.0 8 8 内 U ︾ 出 F A U N U 内 U 内 U T L o h uz
川v u t ( ・1 戸 ? 守 t -令 、 内 山 w a u HU 内 u i v A n H Y n e ? ム e A U 2 U 円 u f r I S U ・ 1 O r u--hUHu--1ac 内 υ ' し け れ- 一
戸 dr
グ ー ノ 司自
,
.
1ヨ60 百70 Contribution of Education . Marginal Effect 1.01 ー噌....-..-..--~・~..,~・=・=乍!~~~~~,:-_~Y-_':';'f巳~ lnteracti ve Effect 1960 1970 1ヲ79 Eontributio門ofSex 1 n teraCi:i ve Effect 1.01 .~~=_,コ.-r--.ご;ニ---,,-.ょこ.._4__'コ・-=.===,==: Marginal Effe己t 1960 1970 197ヨ Contribution ofAge ー_.__Jl--"--.
-
-
晶
一
一
・
f1arginal Effect ・_-1-:":_-._-=,_-=電-.-一・一・_.三?一一--- 一ー-ーー. Interactive Effect 1960 lヨ70 1979390
to slow down at the end of the 1960's and experiences a remarkable decrease after the oil crisis in 1974. On the other hand, growth rate of man-hour labor input continues to increase for the entire period 1960-1979 in tertiary industry. A1though it experienced slight decrease after 1974, it recovered to the historica1 trend 1evel in 1979.
Quality changes both in manufacturing and tertiary sectors con -tinue a stable rate of growth during the entire period. The growth
1'ate of labor quality in manufacturing sector is higher (0.87-1.02
percent) than that in tertiary sector (0.68 percent). 1n tertiary sector, the improvement in labor qua1ity started at the end of the 1960's.
Aver丘geannual growth rate3 of the index for sectoral labor
quality are shown in Table 3. Average annual growth rate during the period 1960-1979 are positive in all sectors. A verage annual growth rate, 3.39 percent in agriculture-forestry-fishery during the period 1970-1973 is extraordinary high. 1n fact its magnitude of quality change offsets almost half of the decreases of man-hour labor input in that sector. As shown in Table 4 average annual growth 1'ates of man-hours worked have changed to be negative in
sixteen manufactu1'ing industries during the thi1'd of the four
sub-period. On the other hand, in almost all of these industries average annua1 g1'owth rates of 1丘borquality become higher fo1'these pe
-riods. Although quality of labor input usually play a 1'elatively
mino1' 1'o1e in contributing to tota1 change in labo1'input, ab:we
observations in agricu1ture同forestry-fisheryand many of the
manu-facturing industries show that the magnitude of quality change can be large enough to offset the decline in man-hours worked.
Itis well known that many Japanese firms benefit from the institution of“lifetime employment" that guarantee 10w labor turnover. The 1abor market in Japan is a1so structured of such that most of the new workers are hired straight out of schoo1 at the
Quality Changes of Labor Input in Japan 391
beginning of each fiscal year (which coincides with the academic year in Japan). This implies that the age classification in our data base with its detailed disaggregation is an acceptable proxy for experiences or on-the-job training component of all labor types. Under those considerations, if a Japan,ese industry exhibits a rela
-tively low rate of growth or negative rate of growth in man-hours worked, it would imply the change in the age distribution of its labor force towards the older workers with greater accumulated experience. Since their wage rates are higher, our assumption of producer equi1ibrium associates higher productivity to these older workers; and hence we should observe an increase in the quality of labor force. Thus it is not surprising that our estimates show an inverse relationship between the quality change in labor force and the change in man-hours worked
4.3 Decornpositon of Quality Change in Labor Input in Manufacturing Sector
A summary of quality decomposition is given in Table 5.
(1) During the period1960-1969 the main effect of sex in light, material and fabricated manufacturing sectors was fJ.O.07, fJ.0.13 and
f
J.O.24 percent per annum. In light and material manufacturing sectors it turned out to be positive, more than 0.45 and 0.27 percent after1969respectively, while in fabricated manufacturing it con -tinued to be negative until1973.After the oil crisis it turned to be positive in all manufacturing sectors, in which the main effect of sex explains more than 30 percent in light manufacturing, 10per -cent in material manufacturing and 3 percent in fabricated manu-facturing respectively.
The sum of interactive effects in terms of sex was .JfO.36, O.008 and fJ.O.08 per annum in each manufacturing sector during the period1960-1979.The minus sign persisted during the w hole period
.392
Table 5 Summary Table of QuaIity Change in Labor Input
Cin percent per year) 同INE昨官CT 5 A O CROSS E汗"ECT SE SA SO E . , EO AO SEA SEO SAO EAO SEAO MAN-HOUR M日UR QUAL!干f OIVISIA 'MAINEFfECi 5 E A O CROSS E作"ECT 5E 5A 50 EA EO AO 5EA 5EO 5AO EA日 5日日 MAN-HOUR HOUR 日UAUTf DI'II5IA Li酔t~lf9. Industrl 1960・69 69・73 75・79 .0-79 3597 8853 2 9 3 目 1384 0000 4759 2285 0494 3340 n u n u 内 u n U 54B5 3783 5904 4 3 9 5 0 0 0 0 m 乃 H M E 2 4 D D 4 9 5 8 0 0 D -0.1169・0.1122・0,0987-0.1077 ・0.4949・0.2980・0.1107・0.3510 ・0.0734・0.067<・0.0460・0.0625 ・0.2213 0.0497 0.1205 .0.05;0 ・0.366呂・0.3225・0.2199・0.3176 ・0.3681・0.1280・0.0274・0.2135 0.1476日0068・0.0155 0.0674 0.0643 0.0758 0.0529 0.0624 0.1798・0.0107・0.0口口3 0.0857 0.17ヲ4 0.0218・0.0063 0.0863 ・0.113ヲ 0.0204 0.OU3・0.0571 4.3365 0.7047 1.04口2 2.1439 ・0.4173・0.8936 0.5425・0.4234 0.5214 1.4984 0.8487 0.9018 4.9579 2.2日31 1.8689 3.0457 Matel・ialHfg・lndustry 1960・69 69-73 75・79 60・79 931Z 2 1 6 口 3290 0Z83 -DODO -83Z 1017 a u z d 凋 ゆ R 4 1 1 ヲ O -GOOD -5261 7453 7395 2294
•.••
日 O D O ヨ 9 1 5 5589 2329 1283••••
内 u n u 内 u n u • -0.0498・0.0454・0.034手..1).0454 ・0.3193・0.1620・0.0372・0.2165 ・0.0068 0.0810 0.0053 0.0178 0.0270 0.2972 0.3436 0.1737 ・0.2961 -0.2242・0.1017..1).2262 ..1).2382 0.0739・0.0310..1).1138 0.0519・0.0104-0.口628日.口口83 ・0:0323・0.0076 0.0033・0.0162 0.0754・0.0968-0.0127 O.日115 0.0338・0.1291 -0.0589 -0.0252 0.0033 -0.0037 0.0176 0.0055 3.8531・1.6828 0.0999 0.9713 ・0.4500・I.S9H 1.0555 -0.6056 0.5982 1.7335 1.226o 1.日223 4.4513 0.0507 1.3265 1.9942 F 'abricated Mヂ9. [ndus廿"y Service Industry 1960・69 69・73 75・7ヲ 60・79 1960・69 69-73 75・79 60-79 -0.2389 -0.0738 0.0405 -0.0329 0.2481 0.1876 0.1439 0.2083 0.5099 1.3264 1.0295 0.9314 0.3583 0.4458 0.0001日.3091 -0.0157・0.0169 -0.0364・0.0235 ・0.1929・0.2656・0.0505・u.1962 0.0291 0.0894 0.0287 0.0359 ・0.0975 0.0991 0.1696 0.0384 ・0.2893・0.2304・0.1951・0.2520 ・0.1485・0.1264・0.0500・0.12:5 0.0335 0.0132 -0.0253 0.006o -0.0007 -0.0075 O.日283 0.0084 0.0113 -0.0551 -0.0172・O.∞
92 0.0661・u.0030 0.0208 0.0331 ・0.0129 -0.0065・0.00日3・0.0084 6.6869 1.9518 1.1172 2.9l87 ・0.7552・1.6531 1.7134・0.6438 0.35ヨ8 1.3i5l 1.0860 0.373ヨ 5.9467 3.3231 2.2031 3.3125 1 5 3 B 4 E ' i p b 内 4 1 1 5•.•
0 0 0 9 4 9 4 2 4 2 5 0 0 1 5 -D O O -3 2 3 9 g 2 8 1 1 1 9 ••• 0 0 D n u n u - A 怜 5 8 3 7 5 5 3 1 4 ••• 6 0 口 0.0148 0.0659 0.0189 0.0280 ・D.0546・0.1320..1).0177・D.0824 0.0000Q.口口口口 0.0口口口 0.0000 ・o.日107 0.1705 0.2033 0.08口5 0.0045・0.0272・0.0187・0.0089 4304 6022 478Z 2Z56 •••• 4003 4 ヲ 2 6 9ES7 8721 5495 3 口 口 4 司 a ? ' T 4 T 1 ・ 0633 95S7 3437•..•
, ‘ . n u ' t w b • 839D a1g4 913S E -o••••
6007 •Quality Changes of Labor Input inJ apan 393
for sex and education, sex and age in all manufacturing, which indicates an expanding proportion of female and low-educated younger workers.
(2) The main effect of education was fairly high in positive for all manufacturing sectors.Itexplains more than 20 percent of total quality change in labor input averagely during the period 1960-19i9. the interactive effect between education and age increased gradually, while the interactive effect between education and occupation de -creased
The increase oI EA effect reflects the increasing proportion of older and higher educated workers in the labor Iorce, while the decrease of EO effect represents the increase of the proportion of higher educated blue collar workers.
1n post war Japan, the proportion of highly educated workers has increased as the result of reform of the education system and changes in human capital investment behavior by workers them-selves. This movement caused an increase of highly educated older workers, while the over-supply of highly educated younger workers caused an increase of highly educated blue collar workers.
Relative prices between heterogenous labor have a great influence based on the Divisia index of labor input. Shimada (1981) pointed out that wage differentials in Japan wer己largelyaffected by years
of experience (or age as a proxy) and years of education, and that interactive effects of education and age to wage differentials were quite high. Our obsevation of the large main effect of education and the movement of interactive effects of EA and EO must be affected by such characteristics of wage profiles in Japan.
(3) Age effect
The main effect of age explains more than 80 percent of quality change in labor input in Japan. This is extremely high compared to other main effects
394
Interactive effects in terms of age were fairly small during the whole period, which means that the effect of age influenced glob -ally all categories of labor as a demographic factor. The main cause of this strong age effect in all categories of labor input is the demographic trend of aging in Japanese society.
Under the assumption of perfect competition, the observed up-ward sloping age-wage profile is interpreted to reflect the differen -tial of marginal productivity of labor input for different age classes, which is equivalent to assuming that older people always are more productive than younger people as far as wage increases according to age. This may appear a peculiar assumtion, but if we regard age as the proxy of experience or accumulation of some other relevant know-how iロacompany under the life-time employment
.
system, we cannot refute apriori the existence of such an equality between wage and value of marginal productivity.
(4) Occupation effect
The main effect of occupation was almost of the same magnitude as the main effect of education.Itexplai
n
.
ed more than 40 percent of quality change in1966-1969, while it explained less than 40 per -cent of quality change in1966-1969.This means that the proportion of white collar workers increased in the period1966-1969, but notso much in subsequent periods.
(5) Quality change in the service sector
Table 5 also shows the summary of quality changes in the service sector. Since the service sector in BWSS data is not classified by occupation category, we cannot observe quality change in terms of occupation. Among the remianing three categories, the age effect was the dominant factor in quality change, just as in the manu-facturing sector. Also the interactive effect by education and age (EA) began to exhibit positive trend in the 1969-73 period. The interactive effect by sex and age was slightly negative in the whole
Quality Changes of Labor Input in ]apan 395
periods.
4.4 Quality Change in Labor Input and Economic Growth
Comparing the amount of quality change in labor input, quality change in the Manufacuturing sector was always larger than that of the service sector, and so were the main effects of age and education and interactive effects of education and age. On the other hand, the trend of the man-hour index was flattened out after the 1969-73 period, and fell into an apparent negative trends in 1973 79. These results suggests that the Manufacturing sector attained a high level of labor productivity through the combination of re -ductions of man-hours and substitution to highly qualified workers. For the Service sector, which still remained the labor absorption sector, both man四hourand quality change increased, but the degree
of quality change was not so large as that of Manufacturing sector. However, in case of mcre decomposed industry analysis, some service industries are increasing its speed in quality change and age effect. We should further investigate the quality change in the service industries after the oil crisis.
The time period fcr our analysis is 1960-1979. During this time, the Japanese economy was catching up with the technology of the
u
.
S. and Western Europe. Looking at Table 5, quality change in labor inputs occured continuously after the 1960・
s. And, as stated in the previous part of this paper, the main source of quality change are the main effects of age and education, and the inter -active effects of education and age. All of these effects are contri -buting factcrs to technological development, because a high level of technological development requires positive quality change in labor input especially in education and age. The former represents the amount of general training, and the latter represents expe-rience and company specific skills. We can conclude that this coin-396
cidence of quality change in labor input with technological develop -ment has been one of the causes for rapid economic growth and the strong upward trend of productivity in the Japanese economy.
Watanabe=Egaizu (1968) estimated the quality change in labor input in Japan for 1951-1964. They conc1uded that quality change in labor input in Japan was lower than that in other developed countries, and one reason given for this was the existence of an “imitation-lag" in technology with the U. S. and Western European countries. At that time, Japan depended on imported technology in which technical progress was embodied in capital inpu
t
.
There-fore, the amount of demand for high quality labor was limited, which resulted in a low level of quality change. Watanabe=Egaizu indicated that there would be a high level of quality change in labor input as the technologicallevel of Japan caught up with those of the U. S. and Western Europe.Consequently, the result of our analysis is consistent with the prediction by Watanabe=Egaizu. Although both Watanabe=Egaizu and our research treat technological change as exogenous factor, the results suggest that there is a strong relationship between technological development and quality chage in labor input espe -cial1y in regards to the age and education effects.
Among sources of quality change in labor input, the age effect is the most controversial one.1n the period of our analysis, the main demographic trend has been the increase of middle-aged workers which corresponds to an upward sloping of the age-wage profi1e. That trend has inf1uenced the significance of the age effect as a source of quality change in labor input. But, in the near future, this trend wi1linevitably shift to old aged workers corresponding to a downward sloping of age-wage profile. Other things equal, the age effect wil1stagnate or even become negative in the future. This wi1lresult in a stagnant trend in quality change. However,
Quality Changes of Labor Input in ]apan 397
we must analyze this problem in a more interdependent framework where the age-wage profile is an endogenous factor resulting from the behavioral adjustment of economic agents.
4.5 Comparison of Quality Change in Labor Input Between Japan and theU. S.
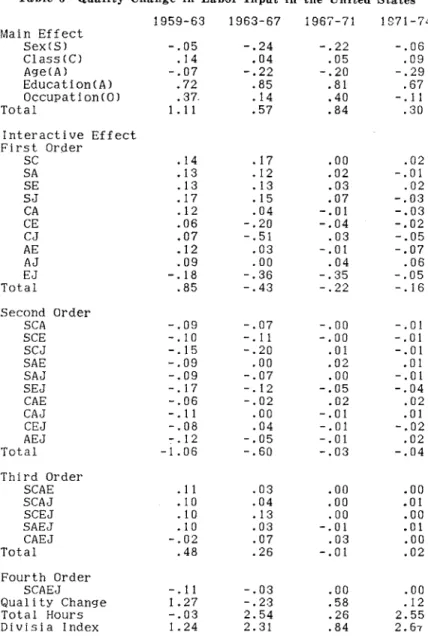
We can draw on GollopニJorgenson(1980) and Chinloy (1980) (see
Table-6) for a similar analysis of the United States. They reported some specific features of quality change in labor input in the U. S. . We compared them with those for Japan as follows:
(i) In the U. S. the main effect in terms of sex was negative for the whole period of 1959-1974, which is the opposite of the result obtained for Japan. In Japan, the main effect in terms of sex was positive effect for 1966-1969 on an average.
(ii) The main effect in terms of age was negative in the U. S.. On the other hand, it was positive in Japan, where this effect explained more than 80 percent of all quality changes.
(iii) The main effect in terms of education was positive both in the U. S. and Japan. The main effect was 0.67 to 0.85 percent in the U. S. which was somewhat higher than that in Japan.
(iv) The interactive effect between education and occupation was negative in the U. S.. Especially during the periods 1963-67 and 1967-71, its magnitude was more than 40 percent of total quality changes. On the other hand, interactive effect between education and age was negligibly small in the U. S., which is a difference between the countries
(v) In the U. S. such kinds of quality change results from the movement of the labor force that female and younger workers increased recently. Such changes in the U. S. consequently wors・
ened improvements in the quality of labor inputs. On the other hand, the effect of education contributed to the improvement of
398
Table 6 Quality Change in Labor Input in the United States
1959-63 1963-67 1967-71 1871-74 Main Effect Sex(S) ー.05 ー.24 ー.22 ー.06 Class(CJ .14 .04 .05 .09 Age(AJ ー.07 ー.22 ー.20 ー.29 Education(A) .72 .85 .81 .67 Occupa t i on (u) .37 .14 .40 ー.11 Total 1.11 .57 .84 .30 Interactive Effect First Order SC .14 .17 .00 .02 SA .13 .12 .02 ー.01 SE .13 .13 .03 .02 SJ .17 .15 .07 ー.03 CA .12 .04 ー.01 ー.03 CE .06 ー.20 ー.04 ー.02 CJ .07 ー.51 .03 ー.05 AE .12 .03 ー.01 ー.07 AJ .09 .00 .04 .06 EJ ー.18 ー.36 ー.35 ー.05 Total .85 ー.43 ー.22 ー.16 Second Order SCA ー.09 ー.07 ー.00 ー.01 SCE ー.10 ー.11 ー.00 ー.01 SCJ ー.15 ー.20 .01 ー.01 SAE ー.09 .00 .02 .01 SAJ ー.09 ー.07 .00 ー.01 SEJ ー.17 ー.12 ー.05 ー.04 CAE ー.06 ー.02 .02 .02 CAJ ー.11 .00 ー.01 .01 CEJ ー.08 .04 ー.01 ー.02 AEJ ー.12 ー.05 ー.01 .02 Tot呂l -1. 06 ー.60 ー.03 ー.04 Third Order SCAE . 11 .03 .00 .00 SCAJ .10 .04 .00 .01 SCEJ .10 .13 .00 .00 SAEJ .10 .03 ー.01 .01 CAEJ ー.02 .07 .03 .00 Total .48 .26 ー.01 .02 Fourth Order SCAEJ ー.11 ー.03 .00 .00 Quality Change 1.27 ー.23 .58 .12 Total Hours ー.03 2.54 .26 2.55 Divisia Index 1.24 2.31 .84 2.67 Source: Chinloy(1980)“Sources of Quality Change in Labor Input," American Economic Review, Vol.70, No.l, March.
Quality Changes of Labor Input in ]apan 399
labor qu乱lityalthough a negative interactive effect between educa
-tion and occupation offset this improvement to some extent. Chinloy explained this situation as“over-education" in the U. S..
(vi) Finally quality changes in the U. S. on average were smaller than those in Japan. 1n the U. S., quality change was 1.27 percent per year in 1959-63, 0.23 in 1963-67 and 0.58 in 1967一71,while in Japan quality change were more than 1.0 percent per year during the whole period.
The characteristics of quality change are behind the difference of productivity performance between the U. S. and Japan. We may conclude that the high quality change of labor input in Japan af -fected favorably to the development of technology, which resulted in high labor productivity, while the low quality change of labor input in U. S. downgraded the growth of labor productivity. 5. Summary and Conclusion
Japanese economic developmo)nt is largely explained by capitョl
intensive technology, though labor's relative share showed no down-ward trend for the period examined. This fact suggests the exist -eロceof an upward trend of quality change in labor input in the
Japanese economy.
Our analysis in this paper started with an observation of sectoral changes in labor input. Agriculture showed a constant reduction in man-hours, whereas the service sector exhibited a stable increase. The manufacturing sector, including mining and construction, showed a positive trend at first, but this turned negative after the 1969-1973 period. 1n addition, quality change in labor input in the Manufacturing sector was always larger than that of the Service sector. Consequently, this influenced the relatively high perform-ance of labor productivity in the Manufacturing sector.
400
Divisia indices which are consistent with transcendenta110garithmic aggregator functions under certain assumptions. The results show-ed that total qua1ity changes in 1abor inputs in Japan were a1ways positive through 1960-1979, and that the sources of these quality changes were main1y an age effect, an education effect and the interactive effects of education-age and education-occupation (on1y for the secondary industries). Causes for these effects are the in -crease in experienced midd1e-aged workers, the growing proportion of higher educated workers, a reduction in less educated young workers, an increase in more educated older workers and the de-cline of 1ess educated b1ue collar workers
During our observation period, the Japanese economy was catch -ing up with the techno1ogy of the U. S. and Western Europe. If we assume that a high technology 1eve1 requires high1y qualified workers, the resu1ts of this paper concerning qua1ity change in 1abor inputs are consistent with this catch-up process. This coin -cidence of quality change in 1abor input with techno1ogica1 deve1 -opment has been one of the causes of rapid productivity change in the Japanese economy.
Among sources of quality change, the age effect provided the most significant contribution. This is because of increase in the proportion of experienced midd1e-aged workers whose wages are on the upward slope of the age-wage profile. 1n the future, if older workers whose wages are on the downward slope of the age-wage profile increase, the age effect will stagnate or even become nega-tive provided that other things are equal.This depends on whether the shift of the age-wage profi1e for older workers will be upward or downward
The comparison between the U. S. and Japan showed that quality change in 1abor input in the U. S. was apparently small compared to that of Japan, especially in terms of the sex and age effects.
QuaJity Changes of Labor Input in Japan 401
Only the education effect turned out to have significantly positive value; however, its impact reduced when an adjustment for occu -pation is made. These comparative result suggest an apparently different input structure between the U. S. and Japan. Above all,
quality change in labor input has not been a contributing factor for productivity change in the U. S., while it contributed significantly in Japan.
Our analysis in this paper is part of research work to investigate the interdependent mechanism of the relationship between input structure and economic growth and technical progress. W e must investigate further other factor input, such as capital and inter -mediate inputs, and also the interaction among labor, capital and intermediate inputs. References Bernt, E. R. and L. R. Christensen. 1973. The 1nternal Structure of Func -tional Relationships: Separability, Substitution and Aggregation.Revieω 01 Economic Studies.40: 403-410. Chinloy, P.. 1980. Sources of Quality Change in Labor Input.American Economic Review.70: 108-119. Denison, E. F. and W. K.Chung. 1976.Ho叩 Japan'sEconomy Gre凶 solast: The Sources 01 PostwaγExpansion.Washington: Brookings Institution. Die
、
Ilert,W. E.. 1976. Exact and Superative Index Numbers. Journal 01 Econometrics.4: 115-145. Gollop, F. M. and D. W. Jorgenson. 1980. U. S. Productivity Growth byIndustry, 1947-73. 1nNew Developments in Productivity Measurement and
Analysis.ed. J. W. Kendrick and B. Vaccara. Chicago: University of Chicago Press.
Jorgenson, D. W. and Nishimizu, M. 1976. Total Factor Produciivity by Industry: Japan, 1955-1973. Final Report to the National Science Foun -dation.
Kuroda, M. and H. 1mamura. 1982. Productivity and Market Performanceー
402
Business Review.20:.
Shimada, H. 1981.Earnings Structure and Human Investment.Tokyo: Keio Economic Observatory.
Solow, R. M. 1957.Technical Change and the Aggregate Product:on Func-tion.Review of Econonzics and Statistics.39: 312-320.
Tachibanaki, T. Quality Change in Labor 1却put and Wage Differentials:
A Study of Japanese Manufacturi担g Industries. Ph. D. dissertation,
Johns Hopkins University.
Watanabe, T. and N. Egaizu. 1968.Rodoryoku no Shitu to Keizai Seichoー
Sengo Nippon ni Tsuiteー (Improvementof Labor Quality and Economic
Growth-Postwar Japan's Experienceー).Econonzic Studies Quarterly. 19: