サーフェイスインタラクションのための温度局所制御ディスプレイ設計に関する基礎検討
5
0
0
全文
(2) Vol.2010-EC-17 No.6 2010/8/23. 情報処理学会研究報告 IPSJ SIG Technical Report. development process, and other possibilities for creating innovative interaction on a tabletop system using thermal feedback mechanism. Ongoing work and conclusion will be discussed at the end.. the resolution of displayed temperature will be limited because we are forced to choose a represented temperature for a large display area. These will lead to the decrease of sharpness of thermal image. On the other hand, if we put lots of thermal display units in one area using small size of thermal display, there will be large amount of thermal display units per touching area, and user will not sense the temperature difference from each thermal display clearly due to the spatial summation property of skin [12]. Moreover, due to the small size of thermal display, the human skin which cannot differentiate temperature sources will be confused. This will degrade the overall thermal sensation. By understanding this trade-off, we have to carefully choose the suitable size and density to arrange the thermal display devices. 3.1.2 Temperature Range To provide dynamic range to the thermal simulation, thermal display device should have a wide displayed temperature range. We have to consider several requirements when deciding the dynamical range of thermal display’s temperature. The first factor is the avoidance of thermal pain sensation for safety reason. It was reported in previous psychophysical research that humans’ thermal pain receptor will stimulate cold and warm pain signal at the temperature below 15 °C and above 45 °C respectively [13]. Therefore the system should limit the thermal display’s temperature between 15 – 45 °C. The second factor is the thermal display’s heat dissipation. When using the thermal display which changes its temperature by using the heat pump process e.g. Peltier device, there will be heat accumulated on the opposite side of cooling display surface. This heat is generated due to heat pump process, and will increase overall device’s temperature that results in the increase of minimum temperature of the thermal display. To avoid this, we have to add a dissipation system on the unused side of display to dissipate unwanted heat. The third factor is the electrical current provided to thermal display device. If we again use thermal display which generates temperature by heat pump process, the maximum and minimum temperature range of the display will depend on the electrical current applied to the device. Thus in order to choose the suitable power supply, we have to consider the number of our thermal displays and the desired temperature range carefully. 3.1.3 Thermal Sensitivity Another consideration is the temperature sensitivity of human’s skin. It is known that human can perceive the relative temperature change more than absolute value, and the ability for tracking change is dependent to the temperature changing rate of the object [14]. There was psychophysical study indicated that the rate of temperature change should be more than 0.1 °C/s in order for the user to detect small increases and decreases in skin temperature e. g. 0.5 °C for on the forearm [15]. As a result, the thermal display should have a rate of. 2. Related Works In developing a thermal feedback system, there were many attempts to embed temperature changeable device to create a thermal display system. Peltier device, which could be either warm or cool when a voltage difference is applied, is a de facto standard device that is usually chosen for implementing a thermal display [6]. Many systems embedded thermal sensors together with their thermal display unit in order to measure the temperature and create feedback control mechanism. Most systems use thermal display in displaying abstract information which can be translated to temperature values such as the radiant heat from fireplace [7], non-verbal communication [8], recognizing family members' presence from an outdoor location [9], or simulation of the real material’s temperature characteristic [10]. When designing a thermal feedback interface, the following needs to be carefully considered: the accuracy of temperature control, the rate of temperature change (response speed), the temperature range capable for thermal display, and the density of thermal display arrangement. However, there are very few investigations that described about how to design a thermal feedback system for a tabletop environment. The work proposed by Kumiko Kushiyama et al. [11] uses a thermal display made up of 80 units of Peltier device to creative interactive artwork by simulating the temperature of snow crystals' growth. However, their work did not described the temperature range of Peltier device, the temperature control mechanism by using thermal sensors, the accuracy of temperature control and the performance of their system.. 3. Design Issue 3.1. System Requirement & Design Parameters. 3.1.1 Thermal Display Density. When designing the thermal feedback system for a tabletop environment, we have to consider the trade-off between the size of thermal display unit and the density of placing unit together. By increasing the size of thermal display unit, the density of thermal display system will decrease, and vice-versa. If we choose have a system of low density by using large size of thermal display, the number of thermal displays per touching area will decrease due to display’s large size. Consequently, users would not be able to feel the thermal relationship between each nearby thermal display unit. Also due to the large size of a thermal display unit,. 2. ⓒ 2010 Information Processing Society of Japan.
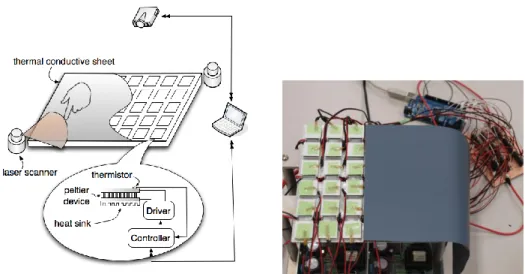
(3) Vol.2010-EC-17 No.6 2010/8/23. 情報処理学会研究報告 IPSJ SIG Technical Report. temperature change faster than 0.1 °C/s. Note that in the heat pump type thermal display, the rate of temperature change of device also depends on electrical current applied to the device. 3.1.4 Thermal Sensors For thermal input capability, the thermal sensor which has good temperature sensibility is required in order to measure the actual temperature of environment with small error. It also has to have small size for not disturbing the heat transfer process between the thermal display and the user’s skin, which prevent the accuracy temperature measurement. 3.1.5 Temperature Control We also need an accurate control mechanism for thermal display. Usually a control feedback loop is used to control the temperature of thermal display. This is achieved by tracking the temperature of thermal display using thermal sensors and send the value to the simulation software and check if there is any error occurred. The frequency of temperature sampling should be high enough to guarantee the accuracy of temperature control. 3.2 Design Consideration To create a concept-proof prototype, we choose Peltier device, the standard thermal display which is commonly used in previous thermal feedback systems, to display the desired high or low temperature. It work as an electrical heat pump which transfer heat from one side to the other side of device when apply DC current into the device, creating the heat on one side and the cold on another side. In most of the thermal haptic systems, Peltier is usually chosen as the thermal display due to its fast rate of temperature change and the ability to display a wide range of temperature, which also depends on applied current. However, when the device is displaying coldness on one surface, there will be unwanted heat accumulated on the other side due to the heat pump process, which will greatly decrease the performance of the device's rate of temperature change. Thus, we need to dissipate the heat on the unused side of device by adding heat sinks. For the temperature sensor, we considered the trade-off between the accuracy of temperature measurement and the size of device, and found that the thermistors are the most suitable thermal sensors for our work. Thermistor responds to temperature change quickly, and its size is considered small enough for not disturbing the heat transfer when measuring the temperature. Arduino boards and H-bridge drivers are chosen for hardware controller and communicating with the software side. Arduino is a microcontroller-embedded prototyping platform based on flexible, easy-to-use hardware and software. H-bridge drivers also help in developing the temperature control mechanism using simple circuit design. Although the Arduino boards do not provide the most compact circuit design, and H-bridge drivers is not the best driver to control Peltier device i.e. consider the relatively slow rate of temperature. range compare to previous systems, these two devices enable us to develop the rapid prototype for pilot study. Since our system thermal display is not transparent, we choose to display the visual context via ceiling-mounted projector over our system’s surface. Though this may lead to some hands occlusion problem while using in real situation, the projected-display approach provides the most convincing setting for our system now. To achieve the multi-touch sensing in our system, we try to implement the multi-touch capability by using IR laser range finder, which tracks finger’s movement effectively in the centimeter scale. However, the integrating of multi-touch capability has not completed yet at the time of this paper’s submission.. 4. Implementation Hardware Our system was made up by 36 cells (6 rows x 6 columns) of thermal display. Each cell consists of 3 elements: Peltier devices (KSM-04031C, KELK Ltd.), thermistors (103JT-025, Ishizuka Electronics), and heat sinks. Peltier device can heat up or cool down when applied a DC current and can display the temperature ranges from 15 °C – 45 °C. Thermistor, which changes its resistance when according to temperature, was used to measure the surface temperature of the Peltier device in 0.1 °C details. The Peltier device’s size is 20 x 20 x 4.65 mm, and thermistor’s thickness is 0.5 mm. The size of Peltier device was carefully selected to be suitable for the average size of adult’s fingertip. Thermistor was attached to the top side of Peltier device, and heat sink was attached on the bottom side. Temperature control algorithm can be achieved through the use of Peltier devices and thermistors together to create a control-loop feedback mechanism, which is monitored by a simulation software at 50 Hz. We believe that choosing array of 6 x 6 thermal displays will be a good balance between the cost and the performance; it reduces the cost of prototype, yet sufficient enough to provide the similar effect of using tabletop environment. On top of the thermal display cells, we placed a good thermal effusivity sheet which also acts as a screen for image projection (TC30AG1/8, Shin-Etsu Chemical). We choose the ceiling-mounted laser projector (Microvision Pico Projector) to project the GUI graphic over the surface of system. To connect the hardware part to the simulation software, we connect the display system to 3 Arduino boards (Arduino Mega) and 36 units of H-bridge drivers (TA7291P, TOSHIBA), which the later devices also help us in the temperature control algorithm. The system setup picture is shown in Fig. 1.. 3. ⓒ 2010 Information Processing Society of Japan.
(4) Vol.2010-EC-17 No.6 2010/8/23. 情報処理学会研究報告 IPSJ SIG Technical Report. was laid in 0.1 °C precision. Since humans cannot sense absolute temperature accurately, our algorithm proves to be legitimate. In order to test the response speed of our Peltier device, we performed the second and the third experiment. Both experimental results are shown in Fig. 3, where the orange line belongs to the second experiment and the green line belongs to the third. We calculated the average speed of heating and cooling from the experiments, and found that the average of our temperature control rate is 2.3 °C/s for heating and 2.0 °C/s for cooling.. Target Temperature. Fig 1 System Setup (Left: System Architecture, Right: System Photo). 5. Experiments Overview To test our temperature control algorithm, we conducted 3 experiments to measure the accuracy of temperature control and the heating and cooling rate of Peltier device. In the first experiment, we set to change the temperature of one Peltier device from room temperature (27 °C) to 15, 20, 40, 45 °C separately to observe our system’s temperature control accuracy. For the second experiment, we set the temperature of one Peltier device continuously from 27 °C to 15, 20, 35, 40 and 45 °C in order, and the duration between each temperature change is 10 s. We also conducted the same experimental setting for the last experiment, but changed the temperature step: from 27 °C to 45, 20, 40, 15, 30 °C in order. These two last experiments are conducted to test the response speed of our temperature control. 5.2 Results We succeeded to precisely display the desired temperature on our thermal display using control loop feedback mechanism provided by Peltier devices and thermistors. The temperature range of our system can be easily controlled between 15 °C to 45 °C. The result of the first experiment which shows accuracy of our temperature control mechanism is shown in Fig. 2, where we simulated the temperatures of Peltier devices from 27 °C to 15, 20, 40, and 45 °C separately. The graph shows that the accuracy of temperature control in our system 5.1. Fig 2 System’s Temperature Control Accuracy. Fig 3 System’s Temperature Changing Experiments. 4. ⓒ 2010 Information Processing Society of Japan.
(5) Vol.2010-EC-17 No.6 2010/8/23. 情報処理学会研究報告 IPSJ SIG Technical Report. Thermoesthesia: About Collaboration of an Artist and a Scientist, ACM SIGGRAPH Sketches (2006). 12) L.A. Jones, and M.J. Berris: The Psychophysics of Temperature Perception and Thermal-interface Design, Proceedings of the 10th Symposium on Haptic Interfaces for Virtual Environment and Teleoperator Systems, 137-142 (2002). 13) I. Darian-Smith and K.O. Johnson: Thermal Sensibility and Thermal Receptors, J. Investigative Dermatology, vol. 69, pp.146-153 (1977). 14) Lynette A. Jones , Hsin-Ni Ho: Warm or Cool, Large or Small? The Challenge of Thermal Displays, IEEE Transactions on Haptics, v.1 n.1, p.53-70 (2008). 15) D.R. Kenshalo, C.E. Homes, and P.B. Wood: Warm and Cool Thresholds as a Function of Rate of Stimulus Temperature Change, Perception & Psychophysics, vol. 3, pp. 81 -84 (1968).. 6. Conclusion We introduce a thermal display system which is still in the early stage with some functions incompleted. We assume that this extra dimension (thermal display) will provide users a better experience when using a surface interface. Our initial pilot study gives up positive result. The next step is to conduct user study experiments and examine the feedbacks. If the result also turns out to be positive, we can further move on to the next stage and improve our system as well. The performance of the system could be improved by simply having a circuit and Peltier device which can take higher current to have better response speed. A better heat sink such as water cooling jacket might also be effective of improving the performance of the system. These are things that we can consider in the later part of our research.. References 1) L. Bonanni, X. Xiao, M. Hockenberry, P. Subramani, H. Ishii, M. Seracini, J.P. Schulze: Wetpaint: Scraping Through Multi-Layered Images, In Proceedings of the 27th International ACM Conference on Human Factors in Computing Systems (CHI), Boston, MA (2009). 2) Andrew D. Wilson , Shahram Izadi , Otmar Hilliges , Armando Garcia-Mendoza , David Kirk: Bringing physics to the surface, Proceedings of the 21st annual ACM symposium on User interface software and technology (2008) 3) Shahram Izadi, Ankur Agarwal, Antonio Criminisi, John Winn, Andrew Blake, Andrew Fitzgibbon: C-Slate: A Multi-Touch and Object Recognition System for Remote Collaboration using Horizontal Surfaces, Second Annual IEEE International Workshop, pp. 3 -10 (2007). 4) P. Kammermeier, A. Kron, J. Hoogen, and G. Schmidt: Display of Holistic Haptic Sensations by Combined Tactile and Kinesthetic Feedback, Presence, vol. 13, pp. 1 -15 (2004). 5) Alexander Kron , Günther Schmidt: Multi-Fingered Tactile Feedback from Virtual and Remote Environments, Proceedings of the 11th Symposium on Haptic Interfaces for Virtual Environment and Teleoperator Systems (HAPTICS'03), p.16 (2003). 6) P. Sines and B. Das: Peltier Haptic Interface (PHI) for Improved Sensation of Touch in Virtual Environments, Virtual Reality 4, pp. 260-264 (1999). 7) J. Dionisio, V. Henrich, U. Jakob, A. Rettig, and R. Ziegler: The Virtual Touch: Haptic Interfaces in Virtual Environments, Computer and Graphics, vol. 21, pp. 459 -468 (1997). 8) 藤田英徳, 西本一志: Lovelet : 気温データの常時伝達による思いやり通信メディア, 電子情 報通信学会技術研究報告, HCS2003-56, pp. 1-6 (2004). 9) 大垣、柴田、黒田、小林、奥出: 家のセンサ情報を「ぬくもり」として共有する団欒支援デ バイス『ぬくぬくキー』インタラクション 2005, pp.179-180 (2005). 10) G. Yang, L.A. Jones, and D. Kwon: Use of Simulated Thermal Cues for Material Discrimination and Identification with a Multi-Fingered Display, Presence, vol. 17, pp. 29-42 (2008). 11) K. Kushiyama, M. Inose, R. Yokomatsu, K. Fujita, T. Kitazawa, M. Tamura, and S. Sasada:. 5. ⓒ 2010 Information Processing Society of Japan.
(6)
図
関連したドキュメント
The inclusion of the cell shedding mechanism leads to modification of the boundary conditions employed in the model of Ward and King (199910) and it will be
(Construction of the strand of in- variants through enlargements (modifications ) of an idealistic filtration, and without using restriction to a hypersurface of maximal contact.) At
It is suggested by our method that most of the quadratic algebras for all St¨ ackel equivalence classes of 3D second order quantum superintegrable systems on conformally flat
Thus, the present study is actually quite different and can be considered as an improvement of [6] and a generalization of [3] to quasilinear (monotone operators in the gradient)
In Section 3, we show that the clique- width is unbounded in any superfactorial class of graphs, and in Section 4, we prove that the clique-width is bounded in any hereditary
Keywords: continuous time random walk, Brownian motion, collision time, skew Young tableaux, tandem queue.. AMS 2000 Subject Classification: Primary:
This paper develops a recursion formula for the conditional moments of the area under the absolute value of Brownian bridge given the local time at 0.. The method of power series
Then it follows immediately from a suitable version of “Hensel’s Lemma” [cf., e.g., the argument of [4], Lemma 2.1] that S may be obtained, as the notation suggests, as the m A
