on corporate financial success
JIANG Feihong
The Faculty of Humanities and Social Sciences JISSEN WOMEN’S UNIVERSITYNor Fyadzillah binti Mohd Taha
Universiti Teknologi Malaysia1. Introduction
Today, business entities compete based on a platform of customized products and services and cost efficient production. In addition, globalization and intensive worldwide competition, along with technological advancements, create an entirely new business environment for competition as well as providing the opportunities to succeed. As a result, many companies have become more customer-oriented in terms of reducing response time to customer requests and improving quality. Companies focused on core competencies attempted to achieve a competitive advantage by more effectively managing purchasing activities and relationships with suppliers. This has shifted many companies’ focus on supply chain processes to an ability to add customer value. Organizations are increasingly faced with the reality that they cannot exist in isolation, but are one piece of a complex chain of business activity (Keah Choon Tan et al. 1999). These forward-looking companies are dynamic and they collaborate with suppliers, customers - even with competitors, and share information and knowledge aiming to create a collaborative supply chain that is capable of competing.
The supply chain concept originated from the formation of a value chain network consisting of individual functional entities committed to provide resources and information to achieve the objectives of efficient management of suppliers as well as the flow of parts (Lau and Lee, 2000). Supply chain management (SCM) includes a set of approaches and practices to effectively integrate suppliers, manufacturers, distributors and customers for improving the long-term performance of the individual firms and the supply chain as a whole in a cohesive and high-performing business model (Chopra and Meindl, 2001). As defined by the Council of Supply Chain Management Professionals (SCC), SCM encompasses the planning and management of all activities involved in sourcing and procurement, conversion and all logistics management activities as well as coordination and collaboration with channel partners.
SCM and related strategies are crucially important to the success of a company. This is because the cost and quality of goods and services sold are directly related to the services purchased, manufacturing and all variety of products. Therefore, supply chain policies such as procurement and supplier selection have an important role in the SCM (Hartley and Choi, 1996; Degraeve et al. 2000). Lean practices to improve the internal processes of an organization in line with the principles of just in time (JIT) supply are other highly recognized practices in SCM (Burgess et al., 2006; Cigolini et al. 2004). Integration of internal processes of the organization with the suppliers and customers forms the essence of the whole idea behind SCM. With the widespread use of internet, web-based systems enable organizations to form strong customer and supplier integration for inventory management, demand forecasting, customer and supplier relationship management (Frohlich and Westbrook, 2002). Responding proactively to market and business environment changes can be facilitated by simultaneous development of the supply chain and the output/product of the chain (Ismail et al. 2006). Despite the awareness of important of SCM practices, there is little empirical research on how SCM practices impact on company financial success (Gunasekaran et al. 2004). The objective of this research is to examine the relationship between the SCM and corporate financial success through an empirical study. Therefore, this paper is organized as follows: Section 2 gives a brief review on the development of SCM, the linkage between SCM practices and financial success. Section 3 describes the methodology used by this research, which is comprised of selection of measures, sampling design, data collection and data analysis techniques employed. Section 4 analyzes the data collected, such as a description of the general characteristics of the selected companies and followed by an analysis of measures and testing the hypothesis to assess the SCM practices that have an impact on companies’ financial success. Finally, conclusions are drawn and some directions for further research are offered in Section 5.
2. Literature review
In the 1980s, severe global competition imposed business entities to offer high quality products at low costs while at the same time increasing design flexibility. Companies implemented practices of benchmarking, process control techniques, training and development programs to build quality into products (Ebrahimpour, 1985; Modarress and Ansari; 1989; Schroeder et al. 1992). Senior management leadership on quality related matters, strategic quality planning, and evaluation of information on quality also became part of the management agenda (Benson et al. 1991; Saraph et al. 1989). Many manufacturers adopted the concept of supply chain management to reduce costs by reducing inventory level and improving efficiency
throughout the supply chain (Watts and Hahn, 1993, Krause, 1997). Supply chain management refers to how firms make use of their suppliers' processes, technologies, and capabilities to improve competitive advantage (Farley, 1997), and how the manufacturing, logistics, distribution and transportation functions are coordinated within organizations (Lee and Billington, 1992). Emphasizing internal competencies requires greater reliance on external suppliers to support non-core requirements, particularly in design and engineering support (Prahalad and Hamel, 1990). The supply chain comprises organizations and flows of goods, and information between organizations from raw materials to end-users (Handfield and Nichols, 2002).
SCM has shifted the emphasis from internal structure to external linkages and processes and is dependent on the interaction between the organization and its external environment. It is seen as a set of practices aimed at managing and coordinating the whole supply chain from raw material suppliers to end customers (Slack et al. 2001), which develop greater synergy through collaboration along the whole supply chain (Lamming, 1993; New and Ramsay, 1997). Since the mid-1990s, academics in the fields of logistics, marketing, and operations management have attempted to describe SCM (Lambert et al. 1998). In 1994, the Global Supply Chain Forum (GSCF) was formed by executives from a group of multi-national companies and developed a definition of SCM. The following eight supply chain management processes are included in the GSCF framework:
(1) Customer Relationship
(2) Customer Service Management (3) Demand Management
(4) Order Fulfillment
(5) Manufacturing Flow Management (6) Supplier Relationship
(7) Product Development and Commercialization (8) Returns Management
A second framework was developed by the Supply-Chain Council (SCC), a non-profit organization founded by Pittiglio, Rabin, Todd, and McGrath (PRTM), a consulting company, and AMR Research in 1996. Return, the fifth process, was added in 2001. By 2006, the SCC had over 800 members, and held conferences, meetings, and retreats in many countries. The objectives of the five SCOR processes are (Supply-Chain Council 2007, p. 7):
(1) Plan - balances aggregate demand and supply to develop a course of action which best meets sourcing, production, and delivery requirements.
(2) Source - includes activities related to procuring goods and services to meet planned and actual demand.
planned or actual demand.
(4) Deliver - provides finished goods and services to meet planned or actual demand, typically including order management, transportation management, and distribution management.
(5) Return - deals with returning or receiving returned products for any reason and extends into post-delivery customer support.
A third framework includes three business processes: customer relationship management, product development management, and supply chain management (Srivastava, Shervani, and Fahey 1999). The description of customer relationship management includes many of the activities that conventionally are performed by the marketing and sales functions such as developing and executing advertising programs. In their description, product development management is the process where the need for cross-functional interfaces is the most explicit. In fact, their description includes a sub-process called "identifying and managing internal functional/departmental relationships" (Srivastava, Shervani, and Fahey 1999). The third process, supply chain management, focuses on the product flow from acquisition of materials from suppliers to manufacturing, to order processing, to distribution to customer service management. This process includes many of the activities that are part of the Council of Logistics Management's definition of logistics. Srivastava and his colleagues focused on the role of the marketing function in the three processes and did not address the role of other corporate functions.
A firm's value can be increased in four ways: increasing revenue, reducing operating cost, reducing working capital, and increasing asset efficiency (Gunasekaran et al. 2004). In general, initiatives based on cost reductions and efficiency improvements are easier to support. For example, if an initiative focuses on reducing inventories and the same level of sales is achieved with lower inventory, then the benefits from that initiative are easy to measure. However, long-term growth requires revenue enhancement and managers need to focus on all four ways to increase value (Lambert et al. 1998). Recent surveys indicated that many public and private companies have strong interests in managing for value. Ramirez et al. (1991) surveyed Fortune 500 Chief Financial Officials (CFOs) and managers and showed concerns about the market capitalization of the companies. Trahan and Gitman (1995) surveyed Fortune 500 and Forbes 200 small company CFOs and found out that CFOs have a strong desire to know more about the impact of financial decisions on stock value. Several recent studies have proposed sets of measures used to evaluate supply chain performance (Gunasekaran, Patel, and McGaughey (2004), Banker, Chang, Janakiraman, and Konstans (2004), Otto and Kotzab (2003), Gunasekaran and Tirtiroglu (2001), Beamon (1999)). These include cash-to-cash cycle time, working capital or cash flow from operations with the objective to maximize shareholders' value.
3. Research methodology
The objective of this study is to explore the relationship between SCM and corporate financial success. A company’s financial success can be defined as generated growth in market capitalization, the fundamental objective for maximization of shareholders’value (Ramirez et al. 1991). Our research questions are: 1. Do companies with superior SCM performance achievement will also be financial success companies? 2. Which SCM performance measure has the highest correlation with companies’ financial success? Based on the objective of this study, it leads to the following hypotheses:
H1o: There is no relationship between company with superior SCM practices and financial
success.
H1A: There is relationship between company with superior SCM practices and financial
success.
To determine whether there is a significant relationship between the dependent variable and the set of explanatory variables, the null and alternative hypotheses are as follows:
H2B: β 1= β 2 = β 3 = β 4 = 0 (no linear relationship between the dependent variable and the explanatory variables)
H2A: At least one β j ≠ 0 (linear relationship between the dependent variable and at least one of the explanatory variables)
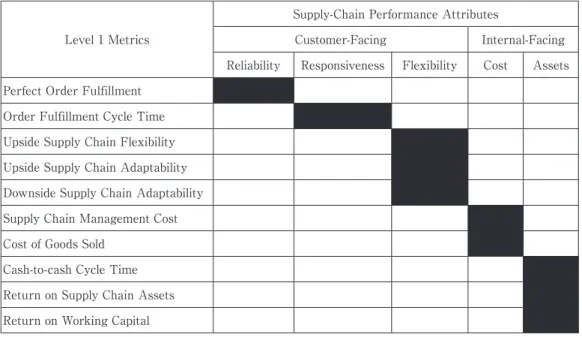
Table 1: Level 1 Metrics from SCOR model
Supply-Chain Performance Attributes
Level 1 Metrics Customer-Facing Internal-Facing
Reliability Responsiveness Flexibility Cost Assets Perfect Order Fulfillment
Order Fulfillment Cycle Time Upside Supply Chain Flexibility Upside Supply Chain Adaptability Downside Supply Chain Adaptability Supply Chain Management Cost Cost of Goods Sold
Cash-to-cash Cycle Time Return on Supply Chain Assets Return on Working Capital
the Supply Chain Council's Supply Chain Operations Reference Model (SCOR®) have been used. The main advantages of the SCOR model are that it provides descriptions of standard processes, a framework for the relationships among processes, and performance metrics and standard alignment to features and functionality.
Table 1 shows the performance attributes and Level 1 Metrics from the SCOR model. The Level 1 Metrics are the calculations by which an implementing organization can measure how successful they are in achieving their desired positioning within the competitive market space. From the table, each of the performance attributes is matched with one to several Level 1 Metrics. For example, supply chain reliability is matched with perfect order fulfillment while supply chain responsiveness is matched with order fulfillment cycle time.
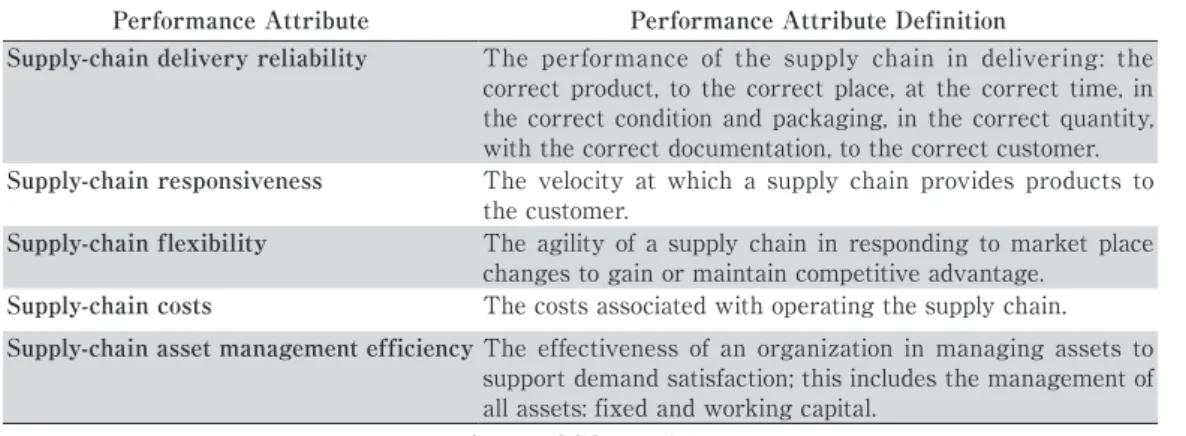
Table 2: Performance Attributes Definition
Performance Attribute Performance Attribute Definition
Supply-chain delivery reliability The performance of the supply chain in delivering: the correct product, to the correct place, at the correct time, in the correct condition and packaging, in the correct quantity, with the correct documentation, to the correct customer.
Supply-chain responsiveness The velocity at which a supply chain provides products to the customer.
Supply-chain flexibility The agility of a supply chain in responding to market place changes to gain or maintain competitive advantage.
Supply-chain costs The costs associated with operating the supply chain.
Supply-chain asset management efficiency The effectiveness of an organization in managing assets to
support demand satisfaction; this includes the management of all assets: fixed and working capital.
(Source: SCOR model)
The sample of the study was confined to selected companies quoted on the Bursa Malaysia. We examined 160 companies quoted in the Industry Products sector of the main board of the Bursa Malaysia as 15 June 2013. In this study, the following defined characteristics were used for company selection. These are:
(1) The companies were quoted in the Industry Products sector – This is to minimize the differences that exist in business practices such as legal, tax incentives, accounting requirements, etc., which differ from the Property or the Construction sectors. Hence, all selected companies operate approximately with similar business practices.
(2) The companies were quoted on the Bursa since financial year 2005 – This is to facilitate a comparison for two distinct periods in data analysis.
(3) The financial year end of the companies was 31 December – This is to ensure consistency in the comparison.
(4) The presentation of the Income Statement of each company follows the same format. Again, this is to ensure consistency in the comparison.
On the basis of these selection criteria, a total of 34 companies were identified and selected. The data for this study was collected through Annual Reports of selected companies filed with the Bursa Malaysia web page covering the financial years ended 31 December 2005 through 2012. The financial information extracted from the financial statements used to calculate the four SCM performance measures are: (X1) Revenue, (X2) Cost of Sales as a
percentage of revenue, (X3) Cash-to-cash cycle time and (X4) Return on working capital for each
financial year. In order to calculate the company’s market capitalization, number of shares issued and share price information of each company was also taken from each company’ s financial year end of 31 December. Share price of each company was gathered through the Bloomberg web page. The data collected was entered into a Microsoft Excel spreadsheet for further computation of market capitalization, cost of sales as a percentage of revenue, cash-to-cash cycle time, earnings before interest, tax and amortization and working capital.
Data was analyzed using the Statistical Package for the Social Sciences (SPSS) software. Besides the normal descriptive analysis, the data was also tested with the Chi-square test, t- test, analysis of variance (ANOVA) and multiple regressions. The Chi-square test was employed to test the correlation between categories of SCM performance measures and financial success. The t-test and ANOVA were employed to determine the significance level of predictability of the SCM performance measures to company financial success. Collinearity diagnostics were employed to test any problem with collinearity among independent variables. To test the relationship between superior supply chain practices and financial success of companies, data was re-arranged into two distinct periods – from 2005 to 2008 and from 2009 to 2012 – in order to calculate the improvement of the selective measures in these two respective periods. Additionally, year to year changes in measures were used to test the predictability of the selected measures to financial success for the period from 2005 to 2012.
For this study, we defined financial success as a company that is able to generate growth in market capitalization (Ramirez et al. 1991). Hence, the dependent variable is growth rate of market capitalization.
Dependent variable Y = Market Capitalization, i.e., proxy for financial success Market
capitalization=Number of ordinary shares issuedat each financial year end × share price at financial year end
Our first supply chain measure is growth in revenue. It is a proxy for supply-chain performance attributes of reliability, responsiveness and flexibility. A key element of successful supply base management involves downstream integration of customers as well as the management of upstream suppliers. Under our hypothesis, we expect revenue to be positively related to financial success.
Independent variable X1 = Revenue, i.e.,
proxy for supply-chain performance attributes “reliability, responsiveness and flexibility” The second supply chain measure is Cost of Sales as a percentage of revenue (COS). This is the proxy to measure supply chain costs. Under our hypothesis we expect COS to be negatively related to financial success. The lower the percentage of the measure means the more effective in managing supply base.
Independent variable X2 = Cost of Sales as a percent of Revenue, i.e.,
proxy for supply-chain performance attributes “Cost”
Next, we focus on the cash-to-cash cycle, a widely-used measure of supply chain performance to represent asset utilization in working capital. This can be combined with Inventory Conversion, Accounts Receivable Conversion and Accounts Payable Conversion. SCM practice will not only reduce inventory level, but will also free up warehouse space and reduce cash flow (Mistry, 2006).
Independent variable X3 = Cash-to-Cash Cycle Time, i.e.,
proxy for supply-chain performance attributes “Assets management” Cash-cash Cycle Time= Days Sales Outstanding− Days Payable Outstanding + Inventory Days of Supply
Lastly, a measure is concerned with return on assets (ROI) that is calculated by profit margin divided by working capital. Management techniques that focus primarily on inventory shows that companies will have to pay higher prices for inputs and/or will cut selling prices in order to move finished goods inventory.
Independent variable X4 = Return on Working Capital, i.e.,
proxy for supply-chain performance attributes “Assets management” Return on Working capital = EBITDA / Working capital
The data for this study was collected through Annual Reports of selected companies filed with the Bursa Malaysia web page covering from the financial years ended 31 December 2005 to 2012. The financial information extracted from the financial statements was used to calculate the four SCM performance measures, i.e., (X1) Revenue, (X2) Cost of Sales as
percentage of revenue, (X3) Cash-to-cash cycle time and (X4) Return on working capital for each
financial year.
4. Research results
Data was analyzed using the Statistical Package for the Social Sciences (SPSS) software. Besides the normal descriptive analysis, the data was also tested with Chi-square test, t- test, analysis of variance (ANOVA) and multiple regressions. To test the relationship between superior supply chain practices and financial success of companies, data was rearranged
into two separate periods, from 2005 to 2008 and from 2009 to 2012, respectively, in order to calculate the improvement of the selective measures during these two periods.
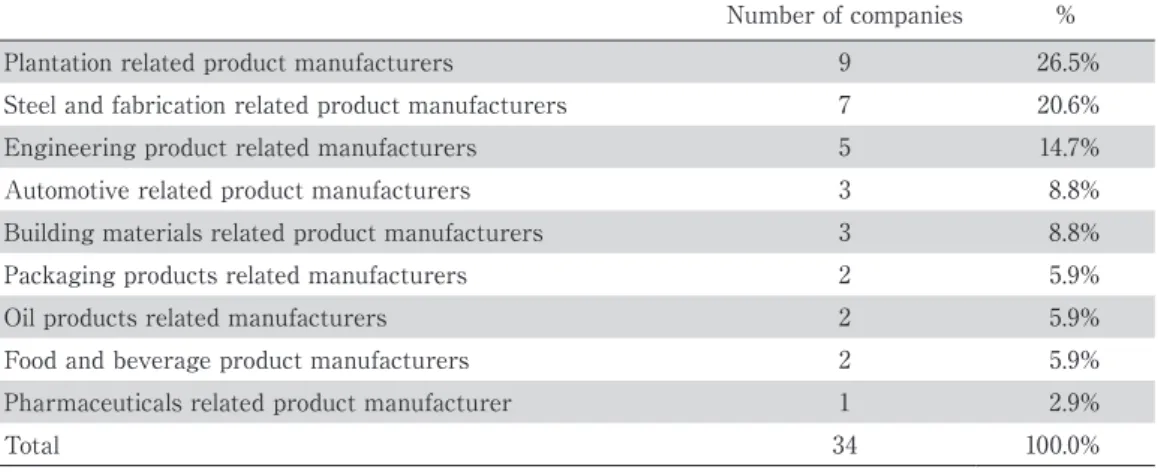
According to Table 3, there were nine companies (26.5% ) involved in plantation-related product manufacturing such as palm oil and timber. The steel and fabrication sector has a total of seven companies (20.6%) and their products are steel related, hardware, fasteners and galvanized products. There were five companies (14.7% ) involved in engineering product manufacturing, and automotive product manufacturing has three companies (8.8%) . There were three companies engaged in building material related products manufacturing. Packaging related product manufacture, oil related product manufacture, food and beverage product related manufacture has two companies (5.9%) each, respectively. Finally, there was a company engaged in the manufacture of pharmaceutical related products.
Overall, the majority of the sample companies have the following characteristics: Revenue, Shareholders’ funds and Market capitalization was less than RM500 million while Profit before tax was less than RM200 million, and engaged primarily in plantation related products, steel and fabricated related products manufacturers.
The major measures for the study were market capitalization, revenue, costs of sales as a percentage of revenue, cash-to-cash cycle time and return on working capital. We used the Chi-Square Analysis for this testing. The Chi-square statistics (X2) are used to test the statistical
significance of the observed association in a cross tabulation. Here, the test is conducted based on market capitalization and SCM practices from the data collected.
Table 3: Selected companies business sectors
Number of companies %
Plantation related product manufacturers 9 26.5%
Steel and fabrication related product manufacturers 7 20.6%
Engineering product related manufacturers 5 14.7%
Automotive related product manufacturers 3 8.8%
Building materials related product manufacturers 3 8.8%
Packaging products related manufacturers 2 5.9%
Oil products related manufacturers 2 5.9%
Food and beverage product manufacturers 2 5.9%
Pharmaceuticals related product manufacturer 1 2.9%
Total 34 100.0%
(Sources: Annual Reports)
Testing the appropriate use of multiple regressions for predictability model. The residual analysis has been used to determine whether the multiple regression model is appropriate to use. This is to determine whether there is a significant relationship between the dependent
variable and the set of explanatory variables. Because there is more than one explanatory variable, the null and alternative hypotheses are as follows:
H2o: β 1 = β 2 = β 3 = β 4 = 0 (no linear relationship between the dependent variable and
the explanatory variables)
H2A: At least one β j ≠ 0 (linear relationship between the dependent variable and at least
one of the explanatory variables)
Before we accepted the regression results as valid, we examined the degree of multi-collinearity and its effect on the results. To do so, we examined the Eigenvalue and Condition Indices and made comparisons with the conclusions drawn from the variance inflation factor (VIF) and tolerance values. Lastly, we checked for outliners (cases falling at the outer ranges of the distribution that may potentially bias the results). We used a threshold of three standard deviations for the residuals, which is appropriate for our sample size of 238 to identify the outliers.
The research results can be summarized into two sections.
(1) Research results for Section one:
The results from the cross tabulation between the number of SCM measures improvement and ranking of top financial success companies show that the correlation analyzed by the Chi-square statistics was not strong for financial years 2005 to 2008 and, therefore, we do not reject the null hypothesis at the 0.05 level of significance. However, the correlation becomes stronger for the subsequent financial years 2009 to 2012. This leads us to reject the null hypothesis at the 0.05 level of significance. This implies that a correlation exists between superior SCM practices and financial success in the second time period. The results also show that companies which practice the full scope of supply chain measures tend to have a chance to become financial success companies in the current business environment compared with a few years back.
(2) Research results for Section two:
The results from the multiple regression model show that all four SCM measures explained 10.2% of the variation in market capitalization. Revenue and return on working capital has a positive correlation with market capitalization while the cost of sales as percent of revenue and cash-to-cash cycle time showed a negative correlation. This is expected considering that lower cost of sales percent of revenue and lower cash-to-cash cycle time implies more cost effectiveness in assets utilization. Among the four SCM measures, Revenue (X1) is the SCM
measure that most highly contributes to the prediction of company’s financial success as its p-value is significant at 0.05. The next most probable measure is the cost of sales as percent of revenue (X2). The remaining two SCM measures, cash-to-cash cycle time (X3) and return
financial success. We have tested the assumptions that underpin the use of regression and are satisfied that the assumptions not violated.
5. Conclusions and future research
This study represents an attempt to explore and to gain a preliminary insight into the linkage among companies that practice superior supply chain management and their financial success. Recall our earlier research questions:
1. Do companies with superior SCM performance achievement will also be financial success companies?
2. Which SCM performance measure has the highest correlation with companies’ financial success?
Based on the analysis of the results of the study, our answer to the above research questions can be summarized below. Firstly, to answer the first research question and explore the SCM practices and financial success relationship, we used cross-tabulation and tested it by Chi-square analysis. The results of this study reveal that there is a linkage between companies which have superior SCM practices and financial success. This indicates that SCM has gained more importance in recent years (2009–2012) compared to previous years (2005–2008) as one of the management tools to create shareholder value. This empirical study supports the previous research by Chen et al. (2004) which is provide evidence that strategic purchasing, an integral part of SCM, has a positive effect on a company's financial performance. Therefore, based on the sample study, we may conclude that there is a relationship between companies that practice superior supply chain management and their financial success, and that more companies have recently adopted the full scope of SCM practices.
Secondly, in order to answer the subsequent research question, we have developed a predictive model using the selected four supply chain performance measures as independent variables and financial success measured by market capitalization as a dependent variable. We used multi regression to test the degree of predictiveness of the independent variables. Overall, the regression results show that all four supply chain performance measures can explain 10.2% of the variability of a company's financial success. Among the independent variables, revenue (X1) is the variable most highly correlated with financial success. The second most correlated
variable is the cost of sales as a percentage of revenue (X2), while the remaining two variables
did not correlate as initially expected. This indicates that revenue as a proxy for companies’ supply chain reliability, responsiveness and flexibility is an important factor for management to consider when drafting out business strategies. This is consistent with the current business environment, which provides customer satisfaction through reliability in delivery,
responsiveness in changing demand and flexibility in adopting changes in internal processes. By achieving these objectives, management has to design and implement a system that can improve the Level 1 Metric as defined by the SCOR model, i.e., perfect order fulfillment, lower order fulfillment cycle time and flexibility in upside and downside supply chain adaptability. All of these activities consume financial resources and to successfully implement SCM practices, a company has to draw a balance between fulfillments of customer satisfaction with supply chain costs. It is reflected from the result that cost of sales as a percentage of revenue (X2) is second
variable that most highly correlates with financial success.
The findings of the study need to be interpreted with the following limitations in mind. First, for practical reasons, only a limited number of control variables were included which is revenue, Cost of sales, Cash-to-cash cycle time and return on working capital. The above study was used financial measures and omitted the non-financial measures. The performance of a company should be judged using both financial and non-financial measures. Non-financial measures include such items as order fulfillment rate, on-time deliveries, supplier rejection rate, forecasting accuracy etc. By incorporating the non-financial measures will provide for more complete SCM practices.
Secondly, further research involving other sectors and industries needs to be undertaken in order to gain an in-depth understanding of the key factors associated with the implementation of supply chain practices. Thirdly, the findings from a small sample size cannot be generalized for a larger population. Fourthly, it may also argue that the overall financial success of companies is influenced by many other factors such as economy, exchange rates, geopolitical issues and many of these are beyond their control but have significant impact to the financial success of companies. Lastly, but not least, this research was constrained by accessibility, resources and time.
As this study is limited to only 34 companies listed on main board of the Bursa Malaysia, it does not necessarily portray a good representation of all companies in Malaysia. Further study with a larger sample size in different industries is required to validate the trend. In addition, in-depth face-to-face interviews with companies’ supply chain practitioners and financial professionals will provide additional information in relation to actual practicing of SCM, especially in a Malaysian company context. The findings of this study would undoubtedly be beneficial to SCM practitioners, financial professional and company decision makers as it has demonstrated empirical evidence that companies with superior SCM practices are associated with financial success.
References
Banker, R.D., Chang, H., Janakiraman, S.N., and C. Konstans (2004), A balanced scorecard analysis of performance metrics, European Journal of Operational Research , Vol. 154, No. 2, pp. 423-436.
Beamon, B.M., (1999), Measuring supply chain performance, International Journal of Operations and Production Management , Vol. 19, No. 3, pp.275-292.
Benson, P.G., Saraph, J.V. and Schroeder, R.G. (1991), The effects of organizational context on quality: an empirical investigation, Management Science , Vol. 37, No. 9, pp. 1107-1124.
Burgess, K., Singh, P.J. and Koroglu, R. (2006), Supply chain management: a structured literature review and implications for future research, International Journal of Operations and Production Management , Vol. 26, No. 7, pp. 703-729.
Chen, I. and Paulraj, A. (2004), Towards a theory of supply chain management: the constructs and measurements, Journal of Operations Management , Vol. 22, pp. 119-150.
Chopra, S. and Meindl, P. (2001), Supply Chain Management , Prentice-Hall, Englewood Cliffs, NJ.
Cigolini, R., Cozzi, M. and Perona, M. (2004), A new framework for supply chain management: conceptual model and empirical test, International Journal of Operations and Production Management , Vol. 24, No. 1, pp. 7-41.
Degraeve, Z., Labro, E. and Roodhooft, F. (2000), An evaluation of vendor selection models from a total cost of ownership perspective, European Journal of Operational Research , Vol. 125, pp. 34-58.
Ebrahimpour, M. (1985), An examination of quality management in Japan: implications for management in the United States, Journal of Operations Management , Vol. 5, No. 4, pp. 519-531.
Farley, G.A. (1997), Discovering supply chain management: a roundtable discussion, The Performance Advantage , Vol. 7, No. 1, pp. 38-39.
Frohlich, M. and Westbrook, R. (2002), Demand chain management in manufacturing and services: web-based integration, drivers and performance, Journal of Operations Management , Vol. 20, pp. 729-745. Gunasekaran, A., Patel, C. and E. Tirtiroglu (2001), Performance metrics in a supply chain environment,
International Journal of Operations and Production Management , Vol. 21, No. 1&2, pp. 71-87.
Gunasekaran, A., Patel, C. and R.E. McGaughey (2004), A framework for supply chain performance measurement, International Journal of Production Economics , Vol. 187, No. 3, pp. 333-347.
Handfield, R.B. and Nichols, E.L. (2002), Supply Chain Redesign: Transforming Supply Chains into Integrated Value Systems , Prentice-Hall, Englewood Cliffs, NJ.
Hartley, J.L. and Choi, T.Y. (1996), Supplier development: customer as a catalyst of process change, Business Horizons , Vol. 39, No. 4, pp. 37-40.
Ismail, H.S. and H. Sharifi (2006), A balanced approach to building agile supply chains, International Journal of Physical Distribution and Logistics Management , Vol. 36, No. 6, pp. 431-444.
Keah Choon Tan, Vijay R. Kannan, Robert B. Handfield and Soumen Ghosh (1999), Supply chain management: an empirical study of its impact on performance, International Journal of Operations and Production Management , Vol. 19, No. 10, pp. 1034-1052.
Krause, D.R. (1997), Supplier development: current practices and outcomes, International Journal of Purchasing and Materials Management , Vol. 33, No. 2, pp. 12-19.
Lambert, D.M., Stock, J.R. and Ellram, L.M. (1998), Fundamentals of Logistics Management , Irwin/ McGraw-Hill, Boston, MA.
Lamming, R. (1993), Beyond Partnership: Strategies for Innovation and Lean Supply, Prentice-Hall, New York, NY.
Lau, H.C.W. and Lee, W.B. (2000), On a responsive supply chain information system, International Journal of Physical Distribution and Logistics Management , Vol. 30, pp. 598-610.
Lee, H.L. and Billington, C. (1992), Managing supply chain inventory: pitfalls and opportunities, Sloan Management Review, Vol. 33, No. 3, pp. 65-73.
New, S. and Ramsay, J. (1997), A critical appraisal of aspects of the lean approach, European Journal of Purchasing and Supply Management , Vol. 3, No. 2, pp. 93-102.
Otto, A., and H. Kotzab (2003), Does supply chain management really pay? Six perspectives to measure the performance of managing a supply chain, European Journal of Operational Research , Vol. 144, No. 2, pp. 306-320.
Prahalad, C.K. and Hamel, G. (1990), The core competence of the corporation, Harvard Business Review, Vol. 68, No. 3, pp. 79-91.
Ramirez, G.G., Waldman, D.A. and Lasser, D.J. (1991), Research needs in corporate finance: perspectives from financial managers, Financial Management , Vol. 20, No. 1, pp. 17-29.
Saraph, J.V., Benson, P.G. and Schroeder, R.G. (1989), An instrument for measuring the critical factors of quality management, Decision Sciences , Vol. 20, No. 4, pp. 810-829.
Schroeder, R.G., Sakakibara, S., Flynn, E.J. and Flynn, B.B. (1992), Japanese plants in US: How good are they?, Business Horizons , Vol. 335, No. 4, pp. 66-72.
Slack, N., Chambers, S. and Johnston, R. (2001), Operations Management, 3rd edition ., Financial Times, Prentice-Hall, Eaglewood cliff, NJ.
Srivastava, Rajendra K., Tasadduq A. Shervani, and Liam Fahey (1999), Marketing, Business Processes, and Shareholder Value: An Organizationally Embedded View of Marketing Activities and the Discipline of Marketing, Journal of Marketing , Vol. 63, No. 4, pp. 168-179.
Supply Chain Council (2007), Supply Chain Operations Reference Model: Overview of SCOR Version 8.0 , Supply Chain Council Inc.
Trahan, E.A. and Gitman, L.J. (1995), Bridging the theory-practice gap: a survey of chief financial officers, Quarterly Review of Economics and Finance , Vol. 35, No. 1, pp. 73-87.
Watts, C.A. and Hahn, C.K. (1993), Supplier development programs: an empirical analysis, International Journal of Purchasing and Materials Management , Vol. 29, No. 2, pp. 11-17.