The Role of English in Human Capital
Attainment for Generating Employment and
Income : The Case of Tourist Industry in Siem
Reap, Cambodia
著者
Morrow Jeffrey
journal or
publication title
Journal of Economics, Kumamoto Gakuen
University
volume
20
number
1-4
page range
103-159
year
2014-03-31
URL
http://id.nii.ac.jp/1113/00000288/
Throughout economic history of developed and developing countries, the generation of employment and income has been one of the most important and most difficult endeavors for governments, policy makers, and economists. As a result, many research works and studies, both theoretical and empirical, have been conducted to solve the problem of employment and income globally. However, research on employment and income through English still lacks. This paper verifies the relationship between employment and income through English with survey work completed in the tourist industry in Siem Reap, Cambodia which has blossomed around World Heritage Site Angkor Wat since the early 2000s. Section (1) explains tourist industry growth in Cambodia in general as background work for this paper. Section (2) offers a literature review containing material related to the author’s study. Section (3) gives an overview of the survey method, dates, location, sample, and limitations. Section (4) contains socio-economic background of the tourist industry employees. Section (5) explains the method of analysis and research findings. Section (6) discusses these findings. Section (7) concludes, and section (8) gives ideas for further research.
Introduction
While many economic researchers have been able to empirically account for income growth due to higher education and other skills, there was still an unknown factor which also contributed to rapid economic growth in many developed countries. Some growth could be attributed to the economic importance of schooling, while other growth, Gary Becker (1964) explained, must be growth in the unseen factor of human
Generating Employment and Income:
The Case of Tourist Industry in Siem Reap, Cambodia
Jeffrey Morrow
capital, or the intangible “stock” one has developed throughout one’s life in education, knowledge, training, skills, good health, on-the-job training, overall knowledge, values, habits, non-measurable skills, and other elements. Human capital investments improve per capita income, but to what degree is difficult to measure. However, Becker has found that human capital investments do contribute to per capita GDP growth over years of working life.
The purpose of this paper is to explore English education and ability as factors of human capital that contribute to per capita GDP income in a developing country, specifically, Cambodia. Largely, three factors combined to lift Cambodia out of hard times faced after the Pol Pot1) and Khmer Rouge regime: 1) international aid agencies,
2) trade, and 3) tourism. All of these factors are important; however, tourism has been greatly responsible for economic growth in Cambodia and especially Siem Reap after Angkor Wat was classified as a World Heritage Site in 1992. It is obviously offering more employment opportunities than trade, banking, or professional businesses. There is also an incredible lack of individual socioeconomic data in Siem Reap, especially on the role of English and education in employment. This being the case, the author has set out to investigate the returns to human capital investments in English education and ability to individual tourist industry (TI) employees in Siem Reap. English background, along with various other forms of human capital, such as on-the-job training and other learned skills, should contribute to returns on investment if treated as a form of education. The author has found through survey work that employees with higher overall education, longer years of general schooling, longer years of English study (both in school and on one's own), and spending more money to learn English proficiency, all have higher paying jobs in the TI of Siem Reap. It is, of course, impossible to say that English alone attributed to the higher incomes and returns. There are many other factors that contribute to higher incomes and employment such as ambition, drive, incentive, ability, and other personal attributes.
1)
Pol Pot, a ruthless dictator, executed millions of Cambodian citizens from 1975-1979 in the hopes of makinCambodia an agrarian utopia. His followers, the Khmer Rouge, destroyed data and burned books. Millions of dollars in aid were given from various countries during the rebuilding of Cambodia. See BBC News Asia-Pacific for more details.
However, individuals with English ability have better overall income and employment experiences according to survey results. These experiences include ease of finding jobs, ability to keep jobs, better lifestyles, better conditions overall, better sense of community contribution, and better sense of their own employment.
To this end, this paper will examine the background of Cambodia in section 1. The background includes an exploration of Cambodian TI, employment aspects, and education. Section 2 offers a literature review, and section 3 explains the survey method, dates and location, sample, and limitations. Section 4 contains socio-economic background of SR TI from the survey. The method analysis and statistical research findings from the survey appear in section 5. Section 6 discusses the findings and gives information on income distribution and employment through English. Section 7 offers a conclusion, and section 8 gives ideas for further research.
1. Cambodia Background
1.1 Tourism
International tourist activities have increased rapidly in and around Indochina since the end of the 1990’s; international tourists have increased worldwide since 2000. Table 1 shows various world arrival markets from 2000 to 2012. Here, Asia and 23% of the market share in 2012 (World Tourism Organization, 2013).
Table 1. International Tourist Arrivals and Market Share 2000-2012 (millions)
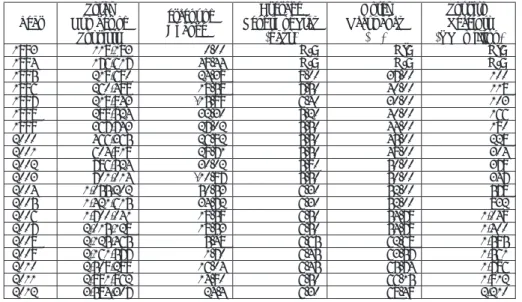
UNTWO Regions 2000 2005 2009 2010 2011 2012 Change (%) 2000-12 Share (%) 2012 World 674 797 882 939 980 1,035 53 100 Europe 385 439 461 474 503 535 38 51 Asia/ 110 154 181 205 216 233 111 23 Americas 128 133 141 150 156 162 26 16 Mid/East 24 36 52 60 55 53 120 5 Africa 27 35 47 50 50 52 92 5
Source: World Tourism Organization, 2013
As for tourism in Cambodia, the backpacker destination of choice is also enjoying a healthy tourist industry since Angkor Wat became a World Heritage site
risen remarkably between 1993 and 2012 as seen in Table 2. Worth mentioning is that the TI accounts for 10% of global GDP (WTTC, 2003 in Ennew, 2003). National for developing countries all over the world. TI was a major source of revenue for continued economic growth in the future. In 2012, international visitors to Cambodia reached 3,584,307 up from 2,881,862 in 2011 (Table 2), a 24.4% of change. This is an increase of almost 700,000 travelers, which is quite a large amount considering that the world had just recovered from the Lehman Shock of 2008. In 1999, the number of total tourists was at 367,743. It has until now increased nearly 10 times to 3,584,307 in 2011. Economic contributions to GDP from TI receipts in 2012 was US $2.2 million; TI has been continually the largest contributor to service sector growth, with hotel occupancy rates at over 68% in 2012 (Cambodia Ministry of Tourism, 2011).
Table 2. Cambodia Visitor Arrivals, 1993-2012.
Year Number of Total Tourists Percent of Change Average Length of Stay (days) Hotel Occupancy (%) Tourism Receipts (US $million)
1993 118,183 0.00 N/A N\A N\A
1994 176,617 49.44 N/A N/A N/A
1995 219,680 24.38 8.00 37.00 100 1996 260,489 18.58 7.50 40.00 118 1997 218,843 -15.99 6.40 30.00 103 1998 289,524 32.30 5.20 40.00 166 1999 367,743 27.02 5.50 44.00 190 2000 466,365 26.82 5.50 45.00 228 2001 604,919 29.71 5.50 48.00 304 2002 786,524 30.02 5.80 50.00 379 2003 701,014 -10.87 5.50 50.00 347 2004 1,055,202 50.53 6.30 52.00 578 2005 1,421,615 34.72 6.30 52.00 832 2006 1,700,041 19.59 6.50 54.79 1,049 2007 2,015,128 18.53 6.50 54.79 1,400 2008 2,125,465 5.48 6.65 62.68 1,595 2009 2,161,577 1.70 6.45 63.57 1,561 2010 2,508,289 16.04 6.45 65.74 1,786 2011 2,881,862 14.90 6.50 66.15 1,912 2012 3,584,307 24.4 6.30 68.49 2,210 Source: Tourism Statistics Report, Ministry of Tourism, 2012
Table 3 shows the list of top 10 tourist arrivals to Cambodia in 2011-2012. In 2011, the top 5 were Asian countries: Vietnam, Korea, China, Lao, and Thailand whose visitors would most likely use international English to communicate, 6th was
(EIL), or have the opportunity to have a Japanese speaking guide exchange with employees. Following at 7th place was the U.S.A., whose visitors would definitely use native English, and 8th was France whose visitors would use either France (since Cambodia was a former French colony) or EIL, and 9th was Australia whose visitors use native English in all communication. Finally, 10th was Malaysia whose visitors would most likely use EIL in communication. Within the top 10, 3 were inner circle countries, in which English is the mother tongue, 2 were outer circle, where English is a main language or lingua franca, and 4 were expanding circle countries where English is used a foreign language.2) In addition, Table 3 gives 2012 arrival country
population. This is done to illustrate the number of travelers who would potentially use English in pleasure travel. The table also gives the number of those in 2012 who specifically traveled for pleasure, increasing the demand for tour guides who use English. It is evident that most people from the top 10 countries visited Cambodia for pleasure travel, further the necessitating the use of English in activities. The tourist share denotes the total share of tourists to Cambodia from each country.
Table 3. Top 10 Tourist Arrivals to Cambodia, 2011-2012 (in number)
Country 2012 Arrival Country Population (millions) 2011 Total Cambodia Arrivals (number) 2012 Total Cambodia Arrivals (number) 2012 P l e a s u r e Travel (number) 2012 Pleasure Travel (% of total) Tourist Share %, 2012 1. Vietnam** 89.0 614,090 763,136 735,781 96 21.3 2. Korea*** 48.9 342,810 411,491 392,373 95 11.5 3. China*** 1,350.4 247,197 333,894 281,669 84 9.3 4. Lao PDR** 6.5 128,525 254,022 253,241 99 7.1 5. Thailand** 69.9 116,758 201,422 183,824 91 5.6 6. Japan*** 127.6 161,804 179,327 167,410 93 5.0 7. U.S.A.* 313.9 153,953 173,706 131,895 75 4.8 8. France*** 63.6 117,408 121,175 96,017 79 3.4 9. Australia* 22.0 105,010 117,729 98,414 83 3.3 10. Malaysia* 29.0 102,929 116,764 109,127 93 3.3
Source: Tourism Statistics Report, Ministry of Tourism, 2012 **Outer circle countries
***Expanding circle countries
2) See Kachru, 1985, for further discussion.
Even though outer circle Asian countries topped the list of international visitors in 2011-12, English was most likely used as an international language by these groups. Yoneoka (2009), who has done extensive research on language needs of East-Asian tourism, found that among China, Japan, and Korea, EIL is widely needed, especially in tourism businesses. Table 3 shows that China, Japan, and Korea were countries that visited Cambodia in 2011-12, and according to Yoneoka, probably used . l e v a r t y a d o t y a d n i L I E r o h s il g n E e v i t a n d e s u o s l a s e i r t n u o c r e h t O .l e v a r t n i L I E
In addition, in 2010 pleasure tourists directly to Siem Reap increased to 704,254 from 195,776 in 2000 (Table 4). Travelers to Siem Reap for business showed a growth of 461,000 travelers between 2002 and 2008, and actually declined by 2,343 travelers
. s e s o p r u p n o i t a c i n u m m o c r o f h s il g n E d e s u y l e k il t s o m s e i r t n u o c e l c r i c r e t u o d n a r e n n i
Unfortunately, data on purpose of visit for tourists to Siem Reap for 2011, 2012, and 2013 is not compiled by the Ministry of Tourism as of yet.
Table 4. Travelers to Siem Reap by Purpose of Visit, 2002-2010
Year Pleasure Business
2002 195,776 2,670 4,345 2003 178,638 2,848 4,812 2004 297,279 2,746 9,348 2005 426,807 2,821 10,497 2006 591,474 2,778 5,423 2007 751,537 5,699 4,015 2008 656,776 7,063 4,665 2009 574,571 4,720 4,693 2010 704,254 4,658 3,760 Source: Tourism Statistics Report, Ministry of Tourism, 2010
1.2 Employment
Employment data from the National Institute of Statistics of Cambodia in Table 5 shows that the percentage of working age population (ages 15-64) per sector in 2010 was the highest for the services industry (which encompasses TI). The employed population
reached 75% in Phnom Penh, 63% in other urban areas (such as Siem Reap), and 21% in other rural areas (National Institute of Statistics, 2010). Although the value was low in rural areas, the services sector always provides necessary employment for young Cambodians who have drive and ability. The services sector has large investment from foreign owners who can speak English well; those working in services need and use EIL regularly.
Table 5. Employed Population Share by Sector and Region, 2010
Phnom Penh Other Urban Other Rural Employed Population (,ooo) 687 772 6,214
Agriculture (share %) 1.6 19.7 64.3
Industry (share %) 23.3 17.8 15.3
Services (share %) 74.9 62.5 20.5
Other {Mining, etc} (share %) 0.2 0.0 0.0
Total 100% 100% 100% Source: Labor and Social Trends of Cambodia, Ministry of Planning, 2010
As for employment, according to the 2011 Statistical Yearbook of Cambodia, 71% of both men and women ages 15-64 in the labor force with post-secondary education were employed, compared with 59% who were unemployed. In addition, 43.3% of employed service workers completed secondary schooling, as compared to 6.5% who had no schooling whatsoever. Of those remaining, 24.9% had not completed primary school, and 25.3% of employed labor force had completed primary school only.
1.3 Education
It goes without saying that many jobs cannot be obtained without education, and these days, English education plays a major role in Cambodia. In 1996, the Cambodian government solidified the 1989 decision to offer English and French as foreign languages within secondary schools. Grades 7, 8, and 9 study English or French 5 hours per week; the students mostly continue to study the same language 4 hours each week in high school. According to Clayton’s survey (2006), in the past students mainly chose English as their official language. During aid assistance,
did not want to educate students in Western languages because they were afraid to let students absorb Western ideas. However, the government soon squelched this notion in an attempt to move into a market economy, and invited Australian lecturers to further train new English teachers. In turn, Cambodian graduates were involved in managing educational projects, and many were sent to Australia in training for Certificate’s and Master's courses. Australia was quite active in the training of secondary education. Other educational agencies included the Catholic Mission Society of America (a consortium of aid agencies), and the British Voluntary Service Overseas (VSO), who trained Cambodians as English language teachers. Both the French Liberte and the Centre Cultural Francaise in Phnom Penh offered French teacher training programs since the 1980's in secondary education (Clayton, 2006). Another program, the U.S. Government's ACCESS Micro-scholarship Program has implemented its Micro-scholarship Program in many developing countries around the world. Its branch in Phnom Penh offers a two-year English language program to minority high school students of 14-18 years of age, during which immersion-style classes English are taught in a friendly, open environment focusing on the four skills of English: reading, writing, listening, and speaking. English is taught by trained Cambodian English teachers in local English schools in various areas during the program, and gives students the opportunity to use English both inside and outside the classroom. The program was instituted to give students the chance to increase their English language skills so that they can ultimately find appropriate jobs and help support their families (US Embassy, 2011). The previous programs are wonderful and worthwhile. Unfortunately, many of them are short-lived due to economic constraints.
Universities in Cambodia have also been offering English and other languages as a major, although there is not a clear-cut definition of foreign languages in Cambodian tertiary education. It was felt by many that Khmer should be the language of education, although assistance money from donor countries has kept the need for teaching western languages intact. Of late, English language has become the language of choice for students in universities. In fact, the Royal University of
Phnom Penh (RUPP) Institute of Foreign Languages, the English Department offers 2 main programs: the Bachelor of Education in Teaching English as a Foreign Language (TEFL), and the Bachelor of Arts in English for World Skills. The aim of the BEd in TEFL is the development of trainees’ skills in teaching English as a Foreign Language (EFL) at the secondary school level, while the BA in English for World Skills prepares students’ English related skills for work and beyond. RUPP also has lately instituted a tourism department where all classes are taught and learned in English. Although we can see that English has become important in education in Cambodia, RUPP is perhaps the one good example of English education at the tertiary level (Royal University of Phnom Penh, 2012).
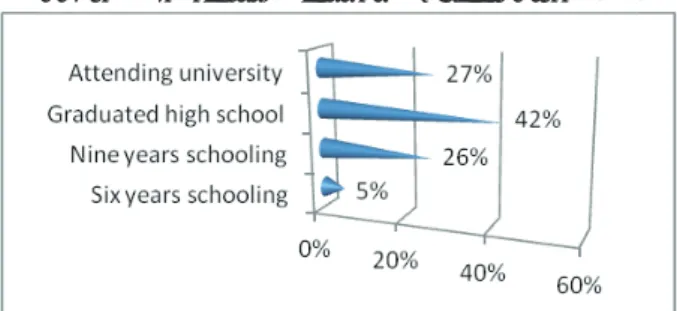
Results from the author’s 2012 survey concur that education is extremely important in TI recently (Fig. 1). In fact, 42% of all respondents have graduated high school, and 27% are currently attending university, a great change from earlier economic life in Cambodia. The author believes this is perhaps this is unique to TI businesses, as TI employees need education to get good jobs, especially in hotels and travel agencies.
Figure 1. Education Attainment, TI Labor Force, 2012
Source: Compiled from survey data, 2012
2. Related Literature . y d u t s s i h o t d e t a l e r e r a t a h t s t n e m u c o d l a r e v e s e c u d o r t n i l li w r o h t u a e h T
These include: human capital; schooling, experience and earning; income and employment with English proficiency in Africa; language skills and earnings of childhood immigrants to the U.S.; and English proficiency and income in Mexican
immigrants to the U.S. As mentioned in the introduction of this paper, Gary Becker, noted University of Chicago economist and Nobel Prize Laureate in economics, conducted empirical research in an economic and social field known as human capital. Human capital is the education, skills, training, and knowledge one has developed over one's life, and are akin to other more tangible items such as a company’s stock of equipment or machinery. Becker has done much research, developed many models on returns to education and other human capital, and specifically investigated the role of age, training, and education on monetary returns to investment. In Human Capital, Becker (1974) first wished to determine the rate of return to education human capital attainments, but soon shifted towards creating a more unified theory of economics where all investments, such as on-the-job training and other knowledge, were taken into account. He noted that many economists were surprised that they could not account for the high levels of income they found in data. For example, age and years of education were two facets that could explain the income level of a particular person. It was found, however, that sometimes these facets could not explain employment and income levels entirely. Hence, some hidden aspect was at work influencing income levels, and Becker characterized this hidden aspect as human capital.
In Schooling, Experience, and Earnings, Mincer (1974) studied the simplest form of human capital: schooling. Mincer took the foundation of human capital research by Becker, and examined the influence of years of schooling as a type of human capital attainment for higher incomes. Mincer used lifetime earnings to investigate the role of education over one’s entire working life after schooling, from age 15 to age 64. The objective of Mincer’s study was to understand the observed income distributions of accumulated investments in human capital for a set of workers. Mincer then examined the distribution of personal income within the various age and education groups in his study. Economists have known for years that correlations between educational attainment and income over one’s life can be weak, but after analysis, Mincer found several things: 1) people with more schooling have higher annual incomes, 2) the difference between individual earnings because of the differences in investment in schooling is larger when the return on investment is higher, and
3) the difference is larger if the working life is shorter. Mincer made inroads by obtaining empirical proof. In fact, in quantitative analysis Mincer has examined income distributions at length. One problem Mincer had at that time was the lack of information as to an individual’s investment in human capital. In addition, long-term income shifts and time spent in schooling or unemployment made individual earnings difficult to compare. As Becker (1964) noted, the accumulations in human capital do not equal the total capital stock because some investments, such as those made in the home for example, are excluded from the individual’s net stock, and are therefore hidden. Nevertheless, Mincer was able to receive some insight into the analysis of income distribution and individual earnings.
In English Language Proficiency and Earnings in a Developing Country: the Case of South Africa, Casale and Posel (2010) investigated the role of English in a country where the dominant language of business is English. In their research they found that high returns to English language proficiency exist, and that there was a large advantage to reading and writing English very well. Casale and Posel used data on those who use English at home and general English language proficiency to determine the relationship on English proficiency and earnings in African men. The data used for Casale's research was based on the National Income Dynamics Survey (NIDS), which tracked 28,000 individuals in approximately 7,300 households nationwide. NIDS gathers information on English language in self-reporting on a four point scale of very well, fair, not well, and not at all (Casale and Posel 2010). Casale chose a narrow definition of proficiency for their data examination, focusing on the ability to read and write the English language very well. Casale and Posel tested the relationship between earnings and English proficiency among African men between ages 25 and 65. Statistical results showed that individuals with a completed secondary education earned 120% more than those without any schooling. Proficient English language users earned almost 55% higher than non-proficient English users. The implications are that English language proficiency can elevate job productivity and also lead to more effective communication among co-workers and management. In the end, a high premium to English language proficiency for over 50% of respondents was found.
Results also show that Africans who are not English proficient have no gain in the returns to completed secondary or post-secondary education outcomes. In the study, African men who had post-secondary education earned approximately 97% if they were also proficient in the English language. Statistical results were low but positive, and showed positive correlations between English proficiency and earnings, at least in the case of South Africa. We expected the correlation to be high, but this may be due to the survey situation, but it may well be due to the accuracy of obtaining English proficiency. In many data collection situations, respondents’ own English ability is self-reported. However, this is not accurate as own abilities can be over or under-valued. In addition, this study focused on reading and writing only as the main determinant of English proficiency. The author suggests a better method of determining English ability is through a proxy such as test scores (such as TOEFL or TOEIC), but this excludes many developing countries due to the cost. Perhaps the best way is a language proficiency test during face to face interviews. While these methods are time consuming and costly, a similar method must be achieved to measure English proficiency accurately. This could be accomplished by creating simplified version of a language proficiency assessment test which should be produced and offered inexpensively over the Internet.
Bleakley and Chin’s, Language Skills and Earnings: Evidence from Childhood Immigrants (2003) found positive results when measuring English proficiency and wages with adult migrants who immigrated to America as children. They worked under the assumption that inadequate language skills increase the earnings gap when measured with nativity. The 2000 U.S. Census, on which Bleakley and Chin base their research, stated that 10.4% of the U.S. population was foreign born, and that most immigrants were from non-English speaking countries. In the U.S. Census, respondents rated their own English ability on four levels: speaking only
English, speaking very well; speaking well; not well; or not at all. In the 2000 census, 47 million residents in the US spoke a language other than English at home, and that 21 million of those spoke English less than very well. Bleakley and Chin found a positive effect on income and education in previous research using 1990 census
data. A dramatic part of the effect of language skills appears to be achieved by schooling. Language proficiency's role in the establishment of human capital is more important that the effect of language on the entire labor product. When examined in a comparison with US immigrants, it can be predicted that those who enter the U.S. at a young age will be more adept at learning English as a second language than those who arrive later. This prediction is used in Bleakley and Chin's research; results for returns to language education
show that one unit of increase in English speaking ability can increase wage rates by 39%. Investment in education may point to a significant boost in earnings, and can resemble earning patterns by age at arrival. Results show the effect of language skills on earnings show that those who can speak English very well can earn 33% more than whose who speak just well. As for the contribution of English language proficiency on income, results show that proficiency in English brings a 33% increase in incomes. Much of this effect has to do with age of individual arrival into the U.S. and also to amount of education undertaken by the subjects. In conclusion, Bleakley and chin found a positive effect on wage rates from individuals from the 1990 census in the U.S. who immigrated there as children. Bleakly and Chin state that policymakers should be aware of these factors in designing classes for immigrants.
Jeremy Sandford (2002) measured the importance of English language on the wage rates of Mexican migrants into the U.S. English language has an effect on the wage rates of Mexican migrants into the U.S. The 1990’s saw a higher increase in Mexican migration than any other decade (INS 1999 in Sandford, 2002). Mexicans had one of the largest incomes among many groups, but earned much less than natives. Sandford points out that this could be due to the fact that Mexican migrants are self-segregated from the remainder of society; many lived in Hispanic-only neighborhoods in 1990 to be among those who share their culture and language. Unfortunately, many of those people also share low education and low English language skills. As such, they have less chance to escape poorer areas. Moreover, employers are not likely to open businesses in these areas, and as a result, Mexicans earn lower income. Sandford argued that English language
deficiency, or the lack of English language skills, could determine this wage gap difference between native English speaking males and Mexican immigrants. Sandford (2002)
hypothesized that Mexican migrants will not be able to move to higher levels because they lack communication skills, and used a sample of 81,059 adult Mexican migrants into the U.S. labor force from the 1990 U.S. Census to study the effect of English Language deficiency on incomes. The sample consisted of males 18 years of age and over who were born in Mexico and included in the U.S. Census as citizens. Sandford’s study used census data in which respondents rated their own English ability as to: speaking only English, speaking very well; speaking well; not well; or not at all. Sandford wished to measure language deficiency, and its effects on earnings. Results showed that those with college degrees but spoke no English earned 71.5% less overall then fluent English-speaking college graduates. Even those with a high school degree and spoke some English had a deficiency rating of only 30%. Those with labor experience can benefit with an extra year of experience, and earn 2.6% more. Some results show that a college degree helps earn 72.6% more than those with less than a high school education. Results also show that only migrants with a high school diploma or some labor force experience will make less than migrants who speak English proficiently. Results also showed that migrants who do not speak English at all can earn half of what migrants who can speak English very well make. English speakers are generally better educated, and perhaps differences in human capital can explain this wage gap. English is important because English speaking firms will offer more jobs in the long run, and English speakers can interact with co-workers better, and can learn about technology in English more quickly than non-English speakers. Employers do not hire those without the dominant language of the nation because they are less useful. Similarly, the author reasons that those with English proficiency in tourism will be able to find work easier, communicate efficiently with guests, and gain income advancement more readily within tourism related business in developing countries. A suggestion by Sandford for future research is to conduct a similar study with a better, clearer measure of English language proficiency. This statement adheres to the author's goal in that the author has developed a clearer numerical English proficiency determination. The U.S. should also promote English education programs which would raise migrant earnings by increasing the return to their human capital investments.
The above studies are useful and interesting which verify the relationship between generation of employment and income through English among the labor force in Africa and America. It is difficult to apply the same research and analysis method in Cambodia, particularly due to the lack of similar data and information there. For this reason the author personally conducted three surveys within Siem Reap to collect data which otherwise was unobtainable. Data collection on site is also difficult because of the differing lifestyles, backgrounds, socioeconomic problems, and ways of answering questions during survey interviews. These are shortcomings, but through this literature review, the author wanted to show evidence that English proficiency is important in many different countries for better incomes and employment in many situations. Although there is no direct evidence in the case of Siem Reap, the author wished to emphasize that English is not only important for native English speakers, but also for migrants to developed countries and for those in developing countries as well.
3. Survey Method, Dates, Location, Sample, and Limitations
The author conducted a survey 2012 within the Siem Reap area specifically for TI employees in Siem Reap, Cambodia to examine the role of human capital attainments in English with regards to their employment situations and incomes. Siem Reap was chosen as the survey locale for its proximity to Angkor Wat, a typical cultural tourism destination. As such, it attracts visitors from around the world annually, and many of them are from inner circle countries and use native English or EIL in travel. During earlier travel experience there in the early part of 2000’s, the author found that English communication was difficult for tour guides and realized that this could be vastly improved. In addition, Cambodia as a developing country has very little data on English education and its contribution to per capita income, which lends itself to more research in the future.
3.1 Method
advanced English proficiency from Angkor University in Siem Reap. To conduct this research, we employed simple stratified random surveys in a face to face interview format. The sample strata were 262 TI employees in five obvious tourist industries in 2012: souvenir shops; restaurants; guest houses; hotels; and travel agencies. These businesses were chosen because they were obvious TI-related businesses. The questionnaire contained questions such as gender, living situation, marital status, years of schooling, years of English education, frequency of English speaking visitors per month, and rate of English usage per month. Although the above studies are useful and interesting, the method of acquiring English language proficiency through census data must be questioned, because using census data to determine English proficiency is not accurate from the viewpoint of actual English communicative proficiency. For this reason, to measure English proficiency, the author designed an assessment which was loosely based on the Common European Framework of References for Languages (CEFR) (Table 6). The CEFR measures English on a six level scale, is adaptable to any language (Council of Europe, 2001), and also creates more accuracy than the self-reporting levels of only English, very well, well, not well, or not at all offers. The author's measurement system was clearly different from that of the CEFR. The CEFR contains six easily defined levels. The author emulated this feature but adapted it to be more useful in the context of Cambodia where many people have little or no English ability. The author included assessment in level from 5 (greatest ability) to 0 (no ability) in order to assess in a quantifiable fashion, and in this way, English proficiency was easily categorized and easy to correlate and analyze numerically (Table 7). In this manner, it is a very convenient way to explain English proficiency and to tie it together with types of jobs and employment seeking.
To gather English proficiency data, each assistant was provided with a hand held IC recorder on which to record a short self-introduction by the respondents. The recordings were analyzed by linguists after the surveys to obtain an English proficiency assessment by following the criteria in Table 7.
Table 6. CEFR Reference Levels
A1 Breakthrough or beginner - can understand familiar everyday expressions, can introduce self
A2 Waystage or elementary - can understand and use expressions within immediate relevance
B1 Threshold or pre-intermediate - can understand main points and deal with traveling
B2 Vantage or intermediate - can understand and produce ideas on concrete and abstract topics
C1 C2
Source: Council of Europe, 2001
Table 7. The Author's English Assessment
0 No or little ability - can't communicate readily at all
1 Low Beginner - can only understand and use simple words and familiar everyday expressions 2 High Beginner - can understand and use words and expressions within everyday relevance 3 Low Intermediate - can understand many things, can produce ideas but broken with many mistakes
4 5
Source: Author, 2010
3.2 Survey Dates and Location
. w o ll o f s a e r a y e v r u s e h T . 2 1 0 2 , 5 2 -3 2 h c r a M m o r f d e t c u d n o c s a w y e v r u s e h T
Souvenir shops were located in Old Market only, restaurants were located on Pub Street and Pub Street Alley, and guesthouses were located on Street 2, Street 3, Oum Khun Street, and around Wat Bo Road. Hotels were located on National Road 6, and Angkor Wat Road. Travel and tour guide agencies were located on Oum Khun Street and Street 5, and Sivath Boulevard (see Fig.2). Fortunately, regulations are not strict in Cambodia. Permission to interview was received relatively easily beforehand or upon entering the establishment by inquiring with the business manager or owner, and the subjects were interviewed randomly. A complete questionnaire can be found in Appendix A.
Figure 2. Map of Siem Reap City National Road 6 Po kamb or Ave nu e Sie m Re ap Riv er Siv ath aB ou lev ard W at Bo Ro ad
Oum Khun Street Street 2 Street 3
Royal Palace
Souvenir Shops are in Old Market Restaurants Guest Houses Travel Agencies
Hotels Street 5
Source: Created using survey data, 2012
3.3 Sample size
The sample size was determined after obtaining preliminary data as to total number of shops in our survey bracket within Siem Reap City (Table 8). Because data
businesses in the survey. The sample size formula can be found in Appendix B.
Table 8. Sample, 2012
Establishment Total number of shops Sample Size (2012) Souvenir shops 300 (after tabulation) 60
Restaurants 120 48
Guesthouses 227 (3,000 rooms) 55
Hotels 120 (8,723 rooms) 45
Travel Agencies 142 54 Source: Department of Tourism, Siem Reap. Sample size was calculated by the author, 2012
3.4 Limitations
The lack of adequate data regarding total population in Siem Reap made sample calculation difficult. Since little exists on working population, the sample size was determined for total shop number, not on total number of interviewees. To circumvent this problem, each shop was assigned a number which was drawn blindly. From
there, only one person in each shop was randomly chosen by the interviewer or shop manager to be interviewed. Another problem was the lack of a detailed map including addresses of all the business located in Siem Reap around Old Market making it difficult to conduct pure random sampling. For this reason a map was generated by the research team for interviewing purposes. Old Market, our survey target for souvenir shops, had no data on total number of shops. To solve for this problem, the shops inside Old Market were manually counted and tabulated into a floor plan to be used in the survey procedure. The manual tabulation was difficult and time-consuming as the shops were very small and close to one another, although the floor plan assured that we obtained an adequate level of randomness. However, time and monetary constraints made achieving a large sample size difficult. Siem Reap City has data on numbers of shops, but very little initial data in other factors which could have been useful. These factors include: product prime cost, rent, electricity cost, start-up cost, etc. In addition, little data on sex and educational distribution of workers also made sample calculation difficult. Another area where data lacked was in the minimum wage income in tourism businesses in Siem Reap for comparing with our survey average wage and salary results. Designing an adequate questionnaire was challenging due to insufficient knowledge of small family businesses, sole proprietorships, labor laws, rent, costs, and other information in Cambodia. These factors caused some problems regarding the examination of the socio-economic situation of tourism businesses. Even though shortcomings existed, an adequate sample size was determined. This made it possible to obtain statistical significance. Another significant problem was that during the survey, the student assistants were hesitant to interview their fellow countrymen in English. The author encouraged and taught them interview techniques to get relevant answers from the respondents regarding all background aspects as it was an essential part of the author’s research.
4. General Socio-economic Background of Siem Reap TI from the Survey
This study incorporates various tables and information with respect to different businesses in this survey. Siem Reap contains many TI businesses; however, we chose
only 5 obvious TI businesses to observe for simplification. Those businesses were: 1) souvenir shops, 2) restaurants, 3) guesthouses, 4) hotels, and 5) travel agencies. Before the analysis a classification and background explanation of the businesses will be offered. As the businesses have very different characteristics, we will also give general socio-economic information, such as gender, age, province of birth, previous jobs, job requirements, and languages spoken. Qualitative information, such as whether the employees had improved salaries, better employment prospects, and ease of finding jobs with English will also be included. A table containing general demographic information of TI businesses will be examined thereafter.
Before we begin, an income benchmark for service industry employees and a base English proficiency level for TI employees from this survey will be introduced. This will enable the reader to understand the basic differences in each business with regards to English proficiency and income. According to the Cambodia Institute of Development Study (2011), a minimum wage was only established for the garment, textile, and shoe industry, and was raised in March, 2013 from US $55 to the present value of US $80 (GMAC, 2013). Since there is no minimum wage specifically for TI, US $80 will be used as the income benchmark for this study. In addition, the base English level of TI employees was found to be 2.5 from the survey experience and this value will be used as the benchmark English proficiency level.
4.1 Classification and General Socio-economic Features of the Businesses
1) Souvenir Shops. Souvenir, meaning remembrance or memory, cater directly
to the tourism market and sell traditional tourist items, which one usually buys for the associated memories. Often connected to a location, items include mass-produced things such as T-shirts, collectibles like figures, statues, and household items like coffee mugs and ashtrays. Souvenir shops in our surveys fall under this categorization, and were limited to shops only within Old Market (Fig.2). To make our survey random, we assigned a number to each shop inside Old Market after tabulation. The numbers were drawn blindly by the interviewers, and the number corresponding to the shop was approached. Often times, there was only a single
person working. In these cases, the interviewers chose this person as the interviewee; in cases where there were several employees, the first person to be approached was chosen as the interviewee. The interviewers were to verify that the employee had not been previously interviewed. The shops were close to each other, but randomness was achieved by alternating the interviewers and also by interviewing on different days. There were 60 total employees from souvenir shops in the survey. Of the total, 47 (78%) were female, and 13 (22%) were male at an average age of 27 years. Totally, 46 people (76%) were from Siem Reap, 1 (1%) from Phnom Penh, and 13 (23%) were from other other provinces such as Battambang. As for marital status, 30 (50%) were married, and 30 (50%) were also single; of those 22 employees had children and 38 did not. Of the total, 6 employees lived alone, 27 lived with their families, and 27 lived in dormitories. The survey found that employees had previous jobs such as souvenir shop employee, seller, waiter, fishing, and religious temple staff. Most had job interviews, and some job requirements for employment in souvenir shops were English ability, organization, and experience. Languages spoken by souvenir shop employees were Khmer, English, some French, a bit of Japanese, and some Thai. Total high school graduates numbered 44, or 73%, while 22 had jobs previously. The average years of schooling was 10, 56 of the total studied English in school a total of 2 years at 4 hours per week. They spent an average of US $10 per month on English study. Souvenir shop staff earned an average of US $77.38 per month, and had an average English level of 2.06. Among souvenir shop employees, 25 (73%) believed they had improved salaries and living conditions, 19 believe they had better employment prospects, and 43 of the total (71%) could find work relatively easily with English (see Table 9).
2) Restaurants. Restaurants are establishments where food is prepared
and served for a fee, usually at the restaurant site. Restaurants were originally aimed at travelers, were unpretentious, and catered to public. Restaurants are usually differentiated according to the type of food. The restaurants in our surveys were located on Pub Street, Pub Street Alley (Fig. 2), and all were typical tourist restaurants there: open air, with large fans, casual, comfortable cushioned seating,
offering different types of ethnic foods. For a random survey the restaurants were each given a number which was drawn blindly. We chose to interview only a single wait staff member or front desk staff member, because these employees use English the most. The first person to be approached randomly became the interviewee after making sure that the employee was a wait staff or front desk staff and that they had not been interviewed previously. Restaurant employees in our survey totaled 48, and were 62% female (30 people) and 38% male (18 people). Restaurant employees were an average age of 24 years. Of the total, 39 (81%) were from Siem Reap, 4 (8%) were from Phnom Penh, and 5 (11%) were from other provinces, such as Battambang and Takeo. Married employees totaled 13, and single respondents totaled 35; 7 married respondents had children, and 41 did not. Of the total employees, 16 lived alone, 22 lived with families, and 10 lived in dormitories. Restaurant employees’ typical previous jobs included many who had cooked before. Other jobs included cashier, service, bartender, driver, and greeter. Job requirements for those in restaurants were experience, English skill and other language skill, work experience, friendliness, and intelligence. Language skills of those in restaurants were Khmer, English, a bit of French, and some Japanese. Of the total, 14 (29%) graduated from high school, and only 5 had jobs previously. The respondents had an average of 11 years of general schooling, and an average of 2 years of English is school at 5 hours per week. Restaurant employees spent an average of US $8 per month studying English. Employees in restaurants earned, on average, US $80.50 monthly. They had an average English proficiency level of 2.39. Of the total, 20 stated they had improved salaries and living conditions, 19 believe they had better employment prospects, and 22 (46%) could find work easier with English.
3) Guesthouses. The third type of business in our survey were guesthouses.
Guesthouses are often converted houses or small buildings, similar to bed and breakfasts, hostels, or inns. Categorized by inexpensive prices, and simple accommodations, they often have only a bed, a toilet, and sometimes air conditioning. They are convenient and centrally located and many have a connected restaurant
and can organize sightseeing. The guesthouses in our surveys were along Street Two, Street Three, and around Wat Bo Road, and contained anywhere from 5 to 15 rooms (Fig. 2). To obtain a random sample, within this area guesthouses were assigned numbers which were drawn blindly. The interviewers chose the first person to be seen as the interviewee; the requirements were that the interviewee must be a front desk staff member and had not been interviewed previously. The total respondents in the survey were 55 people; of those, 30 (55%) of the employees were female, 25 (45%) were male, and an average age of 25 years. Total employees from Siem Reap were 34, 3 were from Phnom Penh, and 18 were from other provinces such as Kampot Thom and Battambang. Of the total, 13 were married, and 42 were single; of the married employees, 10 had children and 45 did not. Totally, 20 employees lived alone, 22 lived with families, and 12 lived in dormitories. In the 2012 survey, previous jobs of those working in guest houses included restaurants, cook, waiter, receptionist, driver, and many with telephone experience. Job requirements for guesthouses included English and French language skill, experience, communication ability, customer service training, and the requirement that the employee must be female. Language ability for those working in guesthouses was Khmer, English, French, some Japanese, and some Chinese. Those who graduated from high school in guesthouses totaled 15, or 33%. Of the total, only 5 had previous jobs. Average years of general schooling was 13, in addition, 13 studied English in school for an average of 3 years and 5 hours per week. Respondents spent an average of US $13 per month on English study. Guesthouse employees earned an average of US $81.85 monthly, and had an average English proficiency level of 2.89. Totally, 4 people responded that they had improved salaries and living conditions, and 12 feel they had better employment prospects with English. Of the total, 16 could find work easier with English.
4) Hotels. The word hotel comes from the French word meaning host, and are
fee-for-accommodation services, and are usually a higher level than guesthouses or bed and breakfasts. They vary in size, and contain a bed, bathroom, TV, and often a sofa and a mini-bar. Hotels have, since the early 2000’s, increased in both number and
size in Siem Reap; the majority are now 5 star luxury hotels. These were located on National Road Six, and Angkor Wat Road (Fig.2). Within this area, hotels were also assigned a number which was drawn blindly. Hotels were quite serious, traditional establishments, and many were foreign owned. Therefore it was difficult to enter and interview without permission first. In most hotels, the managers were asked to allow interviewing beforehand, and were also asked to choose the interviewees by random selection. Again, only front desk staff were interviewed; no restaurant staff, cleaners, or bell-boys were included in the interviews. There were 45 respondents in total for this survey, and they were 25 years of age on average. In the survey, more hotel employees were male than female, a definite change from the previous 3 businesses, where there were more female employees. From this we can determined that gender plays a role in some TI jobs in Siem Reap. This could be because hotels have more barriers and it is more difficult for women to obtain employment. The total employees in the survey was 45 people. Of the total, 28 (62%) were male, and 17 (38%) were female; 29 were from Siem Reap, 2 were from Phnom Penh, and 14 were from other provinces such as Kandal, Kampot, and Sihanoukville. Totally, 14 respondents were married, and 31 were single; 6 employees had children, and 39 did not. In hotels, 17 lived alone, 19 lived with families, and 9 lived in dormitories. Previous jobs for hotel employees consisted of other hotels, receptionists, security businesses, and other service businesses. Requirements for those working in hotels were an English-only interview, experience, English ability, communication ability, a small general aptitude test, test of skill, English language certificate, and a driver’s license. Language ability for those employees in hotels was Khmer, English, French, some Japanese, and some Chinese. In hotels, 27 (60%) employees graduated from high school, and 23 (51%) had previous jobs. Employees had 12 years average of general schooling, and 34 of those studied English in school for an average of 3 years and 7 hours per week. Hotel staff spent an average of US $14 per month on English study. Hotel staff earned an average monthly income of US $115.73. Employees in hotels had an average English proficiency level of 3.45. Of the total, 19 (42%) employees had improved salaries and living conditions, 19 of them feel they had better employment prospects, and 33 (73%)
could find work easier with English.
5) Travel Agencies. Travel agencies provide services for travelers for a fee.
Services include airline tickets, car rentals, railway tickets and reservations, and package tours. Travel agencies also provide reservations for tour guides in a particular area, and often provided travel and tour combinations to create a holiday with connection to airlines or other tour transportation. They arranged busses, sightseeing, and other activities, often in some kind of combination including: trekking, kayaking, and tours around culture tourist destinations. This is the type of travel agencies in our three surveys: combination agencies geared towards offering package holidays to tourists in SR and were located on Street 5, Achemean Street, and Sivath Boulevard. Like hotels, travel agencies contain more male than female employees perhaps for the same reason. For a random sample within travel agencies, within the survey area the travel agencies were assigned numbers which were drawn blindly. Usually travel agencies were small and had only several employees. The interviewers chose the first person to come in contact with as the interviewee after making sure they had not been interviewed earlier. The respondents from travel agencies totaled 54; of those 31 (57%) were male and 23 (43%) were female. Travel agency employees were on average 26 years of age. In travel agencies, 33 were from Siem Reap, 6 were from Phnom Penh, and 15 were from provinces including Battambang, Bantey Mancheay, and Kampong Thom. Totally, 17 were married and 37 were single; 9 had children and 45 did not. Of the total, 20 lived alone, 18 lived with families, and 16 lived in dormitories. Previous employment for those in travel agencies included driver, airline company, receptionist, taxi company, hotel, organizer, bank employee, English teacher, tour coordinator, cashier, and front desk clerk. Job requirements for travel agency jobs were English communication skill, computer skill, English speech at a fast pace, and intensive English skill. Languages spoken at travel agencies were Khmer, English, French, Japanese, Korean, Chinese, some Thai, and some Vietnamese. In travel agencies, 17 or 30% graduated from high school. As for previous jobs, only 17 had jobs previously, and had 14 years average of general schooling. As for those who studied
English, 20 or 36 % studied English in school at an average of 3 years and 11 hours per week. Employees spent an average of US $12 per month on English study. On average, travel agency employees earned an average of US $157.68 monthly. The total, 17 people had improved salaries and living conditions, 11 or 20% feel they had English ability.
Table 9. Socio-economic Features of TI Businesses of SR, 2012
Business Souvenir Restaurant Guesthouse Hotel Travel Agency Total Sample
Particulars 60 48 55 45 54 Those who graduated
from high school 44 14 15 27 17 Those with previous
jobs 22 11 5 23 17
Those with improved salaries and living
conditions 25 20 4 19 12 Average years of
general schooling
(min:6, max:16) 10 11 13 12 14 Number who studied
English in school 56 30 13 34 20 Average years of
English schooling
(min:0, max:8) 2 2 3 3 3 Average hours of
English study per week
(min:0, max:24) 4 5 5 7 11 Average US $ monthly
expenditure for English
study (min:0, max:180) US $10 US $7 US $13 US $14 US $12 Those with better
income/employment
prospects with English 20 19 12 19 11 Those who could
English 43 22 16 33 18
4.2 General TI Demographics
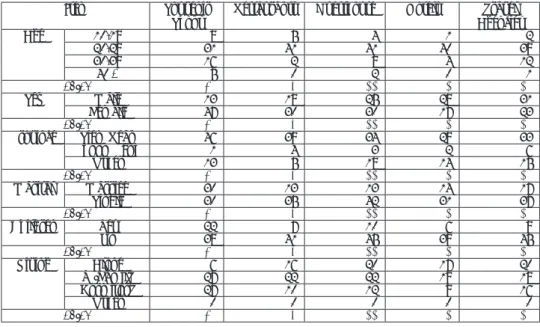
This sub-section contains TI demographics found in the 2012 survey. The data will be presented in a general fashion here. Table 10 shows that most of the tourist industry labor force were in their twenties. This means that there is good potential to develop job skills through English from this point. Many older members of society were executed during the Pol Pot regime, and therefore there were fewer at age 40 and over, creating a skewed population. For this reason, TI is substantially important for youth culture in Cambodia. The total number of respondents was 262. The majority (73%) was in their 20's in all businesses, and 8% were between 10 and 19 years of age. Only a few (16%) were in their 30's, and very few (3%) were over 40 years of age. This shows that the TI industry attracts a young, vibrant labor force, who eager to work with travelers. Unfortunately, many TI employees use their jobs as a stepping-stone to higher paying jobs in different careers such as banking, so many TI jobs are not taken seriously. However, TI provides necessary employment opportunities, especially for females. Souvenir shop, restaurant, and guesthouse employees (a total of 163) had a majority (65%) of female employees, illustrating that females have possibilities for jobs in TI. In hotels and travel agencies (99 respondents) the majority (59%) was male. Most employees were from Siem Reap Province (69%), although a few migrated to SR from other provinces such as Banteay Mancheay, Battambang, and Takeo (25% total). More employees were single, but many were married, and a few had children. As for living arrangements, 42% of the total lived with their immediate family (fathers, mothers, and siblings), and 30% lived alone. The remainder lived in school or work dormitories.
Table 10. General Demographics of Tourism Labor Force Under Study, Siem Reap, 2012 (number)
Item Souvenir
Shops Restaurants Guesthouse Hotels AgenciesTravel
Age 10-19 8 5 4 1 2 20-29 31 41 41 40 39 30-39 16 2 8 4 12 40 + 5 0 2 0 1 Total 60 48 55 45 54 Sex Male 13 18 25 28 31 Female 47 30 30 17 23 Total 60 48 55 45 54
Province Siem Reap 46 39 34 29 33
Phnom Penh 1 4 3 2 6 Other 13 5 18 14 15 Total 60 48 55 45 54 Marital Married 30 13 13 14 17 Single 30 35 42 31 37 Total 60 48 55 45 54 Children Yes 22 7 10 6 9 No 38 41 45 39 45 Total 60 48 55 45 54 Living Alone 6 16 20 17 20 W/Family 27 22 22 19 18 Dormitory 27 10 12 9 16 Other 0 0 0 0 0 Total 60 48 55 45 54
Source: Compiled using survey data, 2012
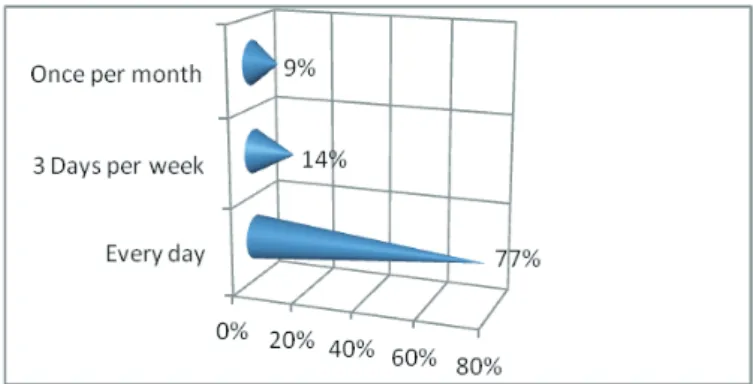
visited their places of business every day (Fig. 3), while 14 % stated that they were visited 3 days per week, and 9% had native or EIL visitors once per month. This is important because employees had great exposure to native and EIL speakers daily, and therefore needed English. In addition, as employees work and communicate more with EIL speakers, their English will improve naturally. In statistical analysis, and sometimes real life, it is not possible to examine the full extent to which
Figure 3. Frequency of English Speaker Visits, TI Labor Force, 2012
Source: Compiled using survey data, 2012
5. Method of Analysis
In order for the reader to understand the results, the analysis method will first be explained. To statisically examine the interaction of English on income, 9 Those variables are: income, previous salary, English proficiency level, total years of schooling, amount of money spent on learning English monthly, hours of English education per week, years of English education, total working years, and English usage in days per month. Before we begin the analysis, the layout of the tables will
in calculations are displayed along the top of each table. Values are rounded off to 2
Income is monthly salary in US dollars; prev sal denotes monthly salary in previous employment also in US dollars; and Eng lvl
Ttl scho yrs is the abbreviation for total years of education, Eng $/mo is the abbreviation for monthly English expenditure in US dollars, and hrs/Eng refers to the number of hours of English learned in school per week. Yrs Eng edu is the abbreviation for total years of English education in school, and wkng yrs refers to years of employment at the present job. Finally, Eng/days is the abbreviation for number of days English is
used per month. As for the measures, mean is the central line of data or average,
median is the exact central point of the data, and mode is the value which appears most often. Variance shows dispersion in the values, standard deviation, abbreviated as SD
variation (CV), or the ratio of the standard deviation to the mean, is useful because values with differing units such as income and education can be compared. Table 11 contains a breakdown of variables used in statistical analysis.
Covariance indicates much about variables’ relationships with one another; two . s e l b a i r a v g n o m a p i h s n o i t a l e r e v i t i s o p a w o h s n o i t c e r i d e v i t i s o p a n i g n i v o m s e l b a i r a v
However, movement in opposite directions shows no relationship. For covariance in this analysis, different variables from the statistical tables were chosen to obtain a more thorough understanding of socio-economic aspects. Specific variables related examine interactions with income. Table 12 encapsulates the variables and references used in covariance tables.
In addition to the above, a Pearson’s R correlation test was also performed to show validity. The test correlated income with the slightly different variables from the covariance table, to gain more insight. Correlation
13 outlines the variables and references used for the correlation test. Table 11. Variables for Statistical Analysis Variables Reference
Income Monthly sal ($US)
Prev sal Salary in previous job
Eng lvl
Ttl scho yrs Total years of general education
Eng$/mo Expenditure for English study per month
Hrs Eng/wk Hours of English study in school per week Yrs Eng edu Total years of English education in school
Wkng yrs Years working at the job
Eng/days Days per month English is used
Table 12. Variables for Covariance
Variables Reference
Income Monthly salary ($US) Eng lvl
Ttl scho yrs Total years of general education Eng$/mo Expenditure for English study per month Hrs Eng/wk Hours of English study in school per week Eng/days Days per month English is used
Job hrs Working hours per week
Source: Derived from survey data, 2012 Table 13. Variables for Correlation
Variables Reference
Income Monthly salary ($US) Eng lvl
Ttl scho yrs Total years of general education Yrs Eng edu Total years of English education in school Hrs Eng/wk Hours of English study in school per week Eng$/mo Expenditure for English study per month Eng/days Days per month English is used
Source: Derived from survey data, 2012
5.1 Statistical Results of Five Businesses in SR TI
As can be noted in the following tables, mean values for income in all the businesses showed a clear ascending order from lowest income (souvenir shops) to skewness. To rectify this skew, median and modewereusedasbettercentrali ndicators .
Median values also showed a similar order of salaries: souvenir shops a median of US $70, restaurants and guest houses a median of US $80, hotels a median of US $110, and travel agencies a median of US $150. Median values generally resembled the mean
values. Mode values were in a somewhat similar order: souvenir shops, US $100; restaurants, US $70; guesthouses, US $80; hotels, US $100; and travel agencies, US $150. Because of this, it is most likely that the order of income found in mean values is true, and remains constant throughout the population. In other words, souvenir shop income will always be lowest, and travel agencies will be highest. However, there are reasons for this. It was the author’s hypothesis that more total years of general education, more years of studying English, more hours of English in school, higher English proficiency level, and a larger amount of money spent on learning English would lead to higher salaries. After analysis this hypothesis appears to hold
true. Although we cannot prove causation, there is obviously a relationship between more human capital attainments in education and salaries, and this means there is no Mincer (1974) has found, more years of schooling leads to higher incomes. This agrees with our findings, as outlined in Mincer’s schooling model.3) However, this idea is
many students do not even enter school, and many go to haphazardly built and administered schools with no records. However, in this survey we were able to gather much information on the actual income, English level, years of education, and hours of English study to help understand TI more thoroughly. This survey helped to realize a
Table 14. Statistical Results of Souvenir Shops, 2012
Mean Median Mode Variance SD CV Income (US$) 77.38 70 100 877.73 29.62 0.38 Prev sal (23 ppl.) (US$) 86.34 70 40 4256.32 65.24 0.75 Eng lvl 2.06 2 2 1.18 1.08 0.52 Ttl scho yrs 9.88 9 9 8.85 2.97 0.30 E n g $ / m o (US$) 9.40 2 0 627.83 25.05 2.66 Hrs/Eng 3.15 2 1 10.52 3.24 1.02
Yrs Eng edu 1.77 1 1 3.23 1.79 1.01
Wkng yrs 3.68 3 1 9.49 3.08 0.83
Eng/days 24.21 30 30 109.69 10.47 0.43
Total Sample: 60 people
Source: Caculated using survey data, 2012
In souvenir shops (Table 14), the income mean value was lowest at US $77.38, and was below the benchmark of US $80. Median income was US $100 and mode of US $40, with quite a high variance and high SD and CV values as well. This indicates that there was much discrepency between salaries at souvenir shops, and therefore less standardization. In fact, many souvenir shops were informal businesses. The
mean value for prev sal was US $86.34, higher than present but only 23 people had
jobs before. Median values for prev sal was US $70 and mode valueswere US$40 .
This shows that a few employees made US $70, but most made around US $40. The variance in prev sal was extremely high at 4256.32, indicating an inconsistent work situation in the respondents’ past, which is quite common in souvenir shops. Souvenir shops are relatively easy to start, and require little start-up capital, so many employees quit and start their own souvenir shop and therefore move around a great deal. Those who did have previous jobs, however, are receiving higher salaries now. The mean value for Eng lvl was the lowest at a level of 2.06 (high beginning level), and the median and mode are 2, again below the benchmark value of 2.5. Causation is difficult to prove; however, as we will see in the following tables, income rates generally corresponded to English proficiency levels, again strengthening Becker’s human capital theory that a hidden aspect influences higher income. This hidden aspect must be human capital investments in more years and hours of English education and higher English self study, as the author maintains. The value for ttl scho yrs had a low mean of 9.8 years. Median, and mode values were low as well at 9 years; many souvenir shop staff had only a secondary school education. Very few employees attended high school and most did not graduate, possibly affecting their employment possibilities. Eng$/mo showed that souvenir shop staff spent around US $9 per month studying English, but the variance, SD, and CV values were high, which was indicative of the large number of ways in which souvenir shop employees study English. Some employees studied very little and spent little money, while others spent a great deal of money on self-study. Values for hrs Eng edu were: mean, 3; median, 2; and mode, 1, all of which indicate that souvenir shop staff studied English around 3 hours per week. As for yrs Eng edu, souvenir shop staff studied English for roughly 1 year, as based on the statistical table. Wkng yrs value for souvenir shops staff was 3.68, which is actually quite long. The Souvenir shop staff used English an average of 24 days per month. Employees in souvenir shops could go and begin their own shops. However, in order to continue working and to obtain repeat customers, shop staff had an English proficiency level of 2, spent up to US $9 per month studying English, had 3 hours per week, and 2 years of English study in school. In addition, they used English around 24 days per month. In a hospitality business such as this, customers