西 南 交 通 大 学 学 报
第 55 卷 第 5 期
2020 年 10 月
JOURNAL OF SOUTHWEST JIAOTONG UNIVERSITY
Vol. 55 No. 5
Oct. 2020
ISSN: 0258-2724 DOI:10.35741/issn.0258-2724.55.5.34
Research articleComputer and Information Science
U
SE OF
F
ACTORIAL
A
NALYSIS OF
M
IXED
D
ATA
(FAMD)
AND
H
IERARCHICAL
C
LUSTER
A
NALYSIS ON
P
RINCIPAL
C
OMPONENT
(HCPC)
FOR
M
ULTIVARIATE
A
NALYSIS OF
A
CADEMIC
P
ERFORMANCE OF
I
NDUSTRIAL
E
NGINEERING
P
ROGRAMS
利用混合数据的因果分析(
联邦紧急事务管理局)和主成分(HC
PC)的
层次聚类分析对工业工程项目的学术绩效进行多元分析
Delimiro Visbal-Cadavid a, *, Adel Mendoza-Mendoza b, Enrique De La Hoz-Domínguez c
a Programa de Ingeniería Industrial, Facultad de Ingeniería, Universidad del Magdalena, Santa Marta D.T.C.H., 470004, Colombia, [email protected]
b
Programa de Ingeniería Industrial, Facultad de Ingeniería, Universidad del Atlántico, Barranquilla, 080001, Colombia, [email protected]
c Programa de Ingeniería Industrial, Facultad de Ingeniería, Universidad Tecnológica de Bolívar, Cartagena, 660003, Colombia, [email protected]
Received: June 2, 2020 ▪ Review: September 5, 2020 ▪ Accepted: October 8, 2020 This article is an open-access article distributed under the terms and conditions of the Creative Commons
Attribution License (http://creativecommons.org/licenses/by/4.0)
Abstract
The article describes a new idea about using Factorial Analysis of Mixed Data (FAMD) and Hierarchical Cluster Analysis on Principal Components (HCPC) to study the academic performance in 82 Industrial Engineering Programs in Colombia. For this, we used the data from the results of the standardized test Saber Pro.). The authors find that the first three components explain 89.12% of the original data set variability. The quantitative variables associated with the FAMD are the first dimension, while the two qualitative variables are related to the second dimension. The first factor explains 95.83% of the dispersion of the scores in Critical Reading, 94.72% of the variability in Quantitative Reasoning, 94.51% of the variation in Mathematics and Statistics, among others. This study shows a strong positive correlation between the quantitative variables and the first factorial axis. It assumes that the Industrial Engineering Programs of public higher education institutions perform better than private ones. The article stipulates that the higher education institutions belonging to the Andean Region present a better performance, followed by the higher education institutions located in the Pacific Region. In general terms, the results confirm that the best performing universities usually appear in the first places in the different rankings and are located in the big cities.
Keywords: Academic Performance, Factorial Analysis of Mixed Data, Hierarchical Cluster Analysis, Industrial Engineering Programs, Higher Education Institutions
摘要 本文介紹了有關如何使用因子分析混合數據和主成分的層次聚類分析來研究哥倫比亞的82個 工業工程計劃的學術表現的新思路。為此,我們使用了军刀临標準化測試結果中的數據。作者發 現,前三個成分解釋了原始數據集中存在的89.12%的變異性。所使用的定量變量與因素分析的第 一個維度相關,而兩個定性變量與第二個維度相關。第一個因素解釋了批判性閱讀中分數分散的 95.83%,定量推理中94.72%的變異性,數學和統計學中94.51%的變異性等。這項研究表明,定 量變量之間以及與第一個因子軸之間存在很強的正相關性。可以看出,公立高等教育機構的工業 工程課程的成績要優於私立高等教育機構的課程。結果發現,屬於安第斯地區的高等教育機構表 現更好,其次是位於太平洋地區的高等教育機構。總體而言,該結果證實了表現最好的大學是那 些通常出現在不同排名的首位並且位於大城市的大學。 关键词: 學術績效,因子分析混合數據,層次聚類分析,工業工程專業,高等院校
I. I
NTRODUCTIONThe study and analysis of the performance indicators in the essential dimensions for achieving the strategic objectives are the first stage in the formulation of every system’s actions and improvement plans. It also can be applied to the Colombian University System. In this context, the Higher Education Institutions (HEIs) results are among the challenges and issues facing Colombia’s educational system.
In Colombia, the institutions responsible for the management of the University System build strategies in search of continuous improvement of this educational sector, being of primary importance to the results obtained by each of the universities to fulfill their mission areas.
Any model for measuring the results obtained by the HEIs must establish the set of fundamental elements (or critical variables), which may be involved in the degree of achievement of the objectives, that is, in the degree of progress or delay of the organization to its improvement objectives [1]. We use these critical variables to describe the improvement actions to generate the necessary changes to increase their quality and, consequently, the Colombian university system’s performance and effectiveness.
In this view, HEIs’ performance is crucially vital for the challenges of higher education in Colombia. The current government’s public policy considers education as the fundamental axis of the country’s economic and social development, which implies the need to consolidate academic programs’ quality.
The Colombian Institute for the Evaluation of Education (ICFES) is the institution responsible for evaluating education at all levels, offering information that contributes to decision making for the improvement of education. In the
cycle of higher education, such evaluation comprises two tests: Saber TyT and Saber Pro. The first one is intended for students of the technological and technical professional level, and the second one is developed for students of professional academic programs that are about to finish their cycle of Higher Education. It is an additional requirement for obtaining a professional degree. The test evaluates the development of the generic and specific competencies of the students who are about to finish their academic program. One of the main objectives is to provide inputs that allow comparisons between programs and institutions [2].
However, the existing studies are limited to presenting the descriptive statistics of the Saber Pro Test results. The authors did not find any review that uses advanced statistical tools for comparative analysis of the products.
Hence the need to use more advanced statistical techniques that allow visualizing the comparative performance of the HEIs through graphs and tables, and that furthermore will enable the treatment of both qualitative and quantitative variables in a single model.
The authors did not find any previous studies that evaluate academic performance through statistical techniques that simultaneously include qualitative and quantitative variables.
This paper proposes a novel (and colorful) way of studying industrial engineering programs’ comparative academic performance in Colombia.
In this sense, the scope of this exploratory and correlational research is to make a comparative study of the results obtained in the Saber Pro Tests by the students of 82 Industrial Engineering Programs (IEP) of the Colombian HEIs, both public and private, based on the
statistical technique of Factorial Analysis of Mixed Data (FAMD).
Using the data in the analysis containing both quantitative and qualitative variables justifies the application of this technique. A cluster analysis of the results obtained from the FAMD is also carried out, thus grouping the academic programs of Industrial Engineering with similarities according to the variables considered in this study.
Consequently, the analysis results proposed in this research will allow those responsible for managing IEPs in Colombian HEIs to identify the critical factors to focus efforts to improve their performance.
This research aims at expanding the insufficient comparative knowledge of the results of the IEP graduates of the Colombian HEIs.
Adequate knowledge of the comparative performance of the IEPs studied in the Saber Pro Tests is vital for planning new policies to improve the establishment and achievement of short, medium- and long-term objectives.
This type of work, as established by Aldás, Escribá, and Safón [3], provides an excellent value for the understanding of the competitive situation of the IEPs studied and for the identification of references in the results obtained through the detection of acceptable practices.
The authors expect this study to improve the Saber Pro Test results. It facilitates establishing the Academic Programs of Industrial Engineering policies in each one of the variables under review. Besides, this study enables detecting the existing comparative weaknesses. Moreover, surveys of this type could encourage healthy competition among the HEI, which would increase the performance and, therefore, the quality of its graduates. In this same sense, and the current situation of institutional accreditation and academic programs presented in the HEI in Colombia, the existing relations between the various indicators have become essential.
II. M
ETHODS/
M
ATERIALS A. Literature ReviewAccording to Zhang and Shi [4], university performance evaluation is the product of academic economics, educational performance evaluation, and university management. The assessment of educational performance first appeared in the United States by calculating education’s production function.
González-Garay et al. [5] consider that evaluating academic institutions’ performance is key to improving the quality of education and making better use of resources.
In general, the assessment of HEI performance is made utilizing rankings according to various indicators. Among these rankings, we can highlight the Academic Ranking of World Universities (ARWU - Shanghai Ranking) [6], the University Ranking by Academic Performance (URAP) [7], the Times Higher Education World University Rankings [8], The Performance Ranking of Scientific Papers for World Universities [9] and QS World University Rankings [10]. However, these rankings are supported by aggregate scores based on subjective weights that make them sensitive to experts’ preferences and are not transparent to end-users [5]. It is essential to guarantee “clean” rankings: evident, free of self-interest, and methodologically coherent, creating incentives to broad-based improvement [11]. They could adequately guide HEIs to provide a better education quality.
In Colombia, the U-Sapiens ranking stands out, which considers research indicators, and is published every semester since 2011 by the consulting firm Sapiens Research [12]. This ranking splits researchers by indicators into the following three variable groups: journals indexed in the National Bibliographic Index (Publindex), active programs of master or doctorate according to the National Ministry of Education, and research groups categorized by Colciencias [12].
However, academic quality is intrinsically multivariate and, therefore, complicated to evaluate with a single indicator. This paper will use Multivariate Data Analysis, which refers to statistical tools for examining and analyzing data with more than one variable. One of these methods’ central issues is to study the resemblances and differences between individuals from a multidimensional point of view [13]. The variables considered can be numerical or categorical. Thus, Principal Component Analysis (PCA) technique deals with quantitative variables, while Multiple Correspondence Analysis (MCA) handles qualitative variables.
In general terms, FAMD is a mix positioned between principal component analysis (PCA) and multiple correspondence analysis (MCA). In other words, it acts as PCA with the quantitative variables and as MCA with the qualitative variables [14].
Quantitative and qualitative variables are normalized in the analysis to balance the influence of each set of variables, which facilitates comparison on the same scale of variability.
For its part, the Hierarchical Cluster Analysis technique allows the grouping of individuals who share similar characteristics according to a set of variables. The goal is to build a tree structure that shows hierarchical relations between individuals or groups of individuals and detects a “natural” number of classes in the observations under study [15]. Numerous works use dimensional reduction techniques such as Principal Component Analysis, Factor Analysis, or Multiple Factor Analysis in performance evaluation, among which should be highlighted the ones carried out by [16] – [24].
There are not many words in the literature that use FAMD; however, we can highlight [25], [26].
Following the work of Husson, Josse, and Pagès [13], this paper aims to combine two kinds of methods, principal component methods and hierarchical clustering, to highlight better and better describe the likeness between individuals.
Among the works that combine these two tools, we can mention those made by [27] – [30].
B. Data Sources and Variables
For the realization of this work, we will use the State Standardized Tests Saber Pro of the students of 82 IEPs of universities, both public and private, in Colombia. Information is available concerning the average results of the Saber Pro Tests in their generic and specific components.
The variables used in this research comprise eight quantitative and two qualitative variables. The quantitative ones represent the averages obtained by the students of the Academic Programs of Industrial Engineering of 82 universities in Colombia in the Standardized Tests Saber Pro in five modules of generic competencies and three modules of specific competencies. Two qualitative variables refer to the type of HEI (Public or Private) and to the Colombian Region, where the HEI is located (Andean, Caribbean, or Pacific). They are summarized in Table 1.
Table 1.
Variables considered in the study
Quantitative variables Qualitative
variables Generic Specific competencies competencies Quantitative Reasoning Mathematics and Statistics Region Critical Reading Design of Productive
and Logistic Systems Citizen Competencies
English
Formulation of
Engineering Projects Type Written
Communication
The distribution of HEIs in terms of their type (public or private) and the region where they are located (Andean, Caribbean, or Pacific) is shown in Table 2. This table indicates a high proportion of IEPs in the Andean Region and the private sector.
Table 2.
The proportion of HEIs by Region and Type
Region Type
Andean Caribbean Pacific Private Public 69.51% 18.29% 12.20% 78.05% 21.95%
Table 2 shows that 69.51% of the IEPs are located in the Colombian Andean region, 18.29% in the Caribbean Region, and 12.20% in the Pacific Region. On the other hand, 78.05% of the IEPs belong to private HEIs and 21.95% to public ones.
Table 3 shows the descriptive statistics of the quantitative variables considered in the study.
This study’s data was collected from the Ministry of National Education of Colombia [34].
III. R
ESULTS ANDD
ISCUSSIONThe analysis of the present study was conducted in R, version 4.0.2 [31]. Both FAMD and HCPC analyses used FactoMineR package [32]. The results were extracted and visualize using the Factoextra package [33].
Table 4 shows, for the first three components, the associated eigenvalues, the variance explained by each factor, and the cumulative percentage of variance explained from Factor Analysis Mixed Data (FAMD).
When the data are standardized, an eigenvalue greater than 1 indicates that the associated component explains more variance than one of the data’s original variables. In general, this is used as a cut-off point to show how many factors to retain in the analysis.
Figure 1. Eigenvalues associated with each component
Figure 1 indicates that only the first three components explain more variance than each of the original variables. In contrast, Figure 2 suggests that together these three components represent 89.12% of the original data set’s variability.
Table 3.
The proportion of HEIs by Region and Type
Variable Mean Median Standard
deviation Range Minimum Maximum
Quantitative Reasoning 167.512 165.164 14.361 59.725 144.457 204.182 Critical Reading 154.131 152.484 12.987 58.194 131.687 189.881 Citizen Competencies 147.368 145.105 12.426 58.590 123.672 182.262 English 159.246 156.855 17.199 76.283 134.520 210.803 Written Communication 151.972 151.625 7.936 40.669 135.350 176.019 Mathematics and Statistics 141.750 138.793 12.881 57.650 122.589 180.239 Design of Productive and Logistic Systems 150.059 147.034 15.873 62.945 126.585 189.530 Formulation of Engineering Projects 151.965 150.446 11.878 57.262 126.868 184.130
Figure 2. Percentage of cumulative variance explained Table 4.
Eigenvalue and variability explained by the FAMD
Component Eigenvalue Percentage
of variance Cumulative percentage of variance Comp1 7.727 70.249 70.249 Comp2 1.068 9.710 79.959 Comp3 1.008 9.164 89.123 Table 5.
Coordinates of the variables with the factors of the FAMD
Variable Dim 1 Dim 2
Critical Reading 0.9789 0.0012 Quantitative Reasoning 0.9732 0.0008 Mathematics and Statistics 0.9722 0.0022 Citizen Competencies 0.9619 0.0002 Formulation of Engineering Projects 0.9562 0.0000 Design of Productive and
Logistic Systems 0.9518 0.0010 Written Communication 0.8888 0.0074 English 0.8633 0.0072
Type 0.1151 0.4794
Region 0.0659 0.5688
Table 5 shows the coordinates of the variables with the first two factors. These coordinates represent the decomposition of the accumulated variable inertia on the FAMD axis, i.e., by their importance. The high values for the coordinates of 8 quantitative variables in the first factor indicate that this main component is closely linked to each of the quantitative variables, in the sense that it constitutes an essential direction of inertia for those variables. On the other hand, the second principal component is associated with the qualitative variables (Region and Type).
Figure 3 shows the graphical representation of the data in Table 5, which shows the distribution of the variables in the first two components of the FAMD, noting the strong association of the quantitative variables with the first component and the qualitative variables second component.
Table 6 shows the contribution of the variables to the definition of the first and second components of the FAMD. It shows that, for example, 12.67% of the inertia of the first factor is due to the Critical Reading variable. 12.59% of the first component variability is caused by the variability present in the Quantitative Reasoning variable. Similarly, it can be observed that the variables that contribute most to the formation of the second component are
Region and Type with 53.25% and 44.88%, respectively.
The Cosine Squared column also indicates that the first factor explains 95.83% of the dispersion of the scores obtained by the IEP in Critical Reading. 94.72% of the variability of the scores in Quantitative Reasoning and 94.51% of the variation in mathematics and statistics scores. The second factor explains 22.98% of IEP dispersion by the type of educational institution and 16.18% of IEP variability in terms of the Region of HEI location.
Figure 4 shows the information related to each variable’s contribution to the first two factors’ definition. The homogeneous contribution of the quantitative variables to form the first dimension of the FAMD guarantees the representation quality. In contrast, the qualitative variables contribute to the formation of the second dimension.
The circle of correlations shown in Figure 5 allows us to visualize the correlations between the quantitative variables and these with the first two factors and the contribution of the former in the conformation of the first two dimensions of the FAMD. Figure 5 shows a strong positive correlation between the various quantitative variables and the first factorial axis.
Table 6.
Association of the variables with the first two dimensions of the FAMD
Variable Contribution (%)
Cosine Squared (Quality of Representation)
Dim 1 Dim 2 Dim 1 Dim 2
Critical Reading 12.6681 0.1143 0.9583 0.0000 Quantitative Reasoning 12.5946 0.0739 0.9472 0.0000 Mathematics and Statistics 12.5811 0.2017 0.9451 0.0000 Citizen Competencies 12.4486 0.0197 0.9253 0.0000 Formulation of Engineering Projects 12.3739 0.0045 0.9143 0.0000 Design of Productive and Logistic Systems 12.3172 0.0896 0.9059 0.0000 Written Communication 11.5021 0.6913 0.7900 0.0001 English 11.1721 0.6779 0.7453 0.0001 Type 1.4893 44.8777 0.0132 0.2298 Region 0.8531 53.2495 0.0022 0.1618
Figure 3. Distribution of variables in the first two components of FAMD
Figure 4. Association of the variables with the first two dimensions of the FAMD
Figure 6. Representation of IEPs on the factorial map of FAMD
Figure 7. Representation of IEPs according to their contribution to the formation of the first two dimensions
Figure 6 shows the factorial map; it indicates the 82 IEPs in the two main components of the Mixed Data Factorial Analysis. It shows that the Industrial Engineering Program number 70 presents the best result in the Saber Pro Tests, followed by number 44, the IEP number 1 and 52 present the lowest performances. It is also observed that the IEP of Public HEI exhibits better performance than the Private ones. As far as the region is concerned, HEI location in the Andean Region supports a better performance, then come HEIs located in the Pacific Region.
Figure 7 shows the place of each IEP in the Factorial Map colored according to their contribution to the formation of the first two FAMD dimensions.
The first dimension of the FAMD is due in more significant measure to the quantitative variables (results of Tests Saber Pro). Figure 8 shows the contribution of each observation (academic program) to this FAMD dimension. It is appreciated as a substantial contribution for items 70, 44, and 55.
Figure 5. Contribution of the quantitative variables in forming the first two dimensions of the FAMD and the
correlation between the variables.
The second dimension of the FAMD is due to qualitative variables. Figure 9 shows the contribution of each observation (academic program) to this dimension of the FAMD. It shows the decisive contribution of Items 50, 39, 41, and 49.
Figure 10 shows the different IEPs according to whether they belong to a Public or Private HEI, considering the scores in the first two
dimensions of the FAMD. In this graph, among the Public HEI, IEP 70 shows the best performance. It is followed by Programs 55, 72, 71, and 37. Similarly, the Industrial Engineering Program 44 offers the best performance among the Private HEI, followed by Programs 57, 59, 51, and 26.
Figure 11 shows the IEPs according to the HEI location to which they belong, indicating the scores in the first two dimensions of the FAMD. In this graph, IEP 70 shows the best performance among the HEI of the Andean Region, followed by Programs 44, 55, 57, 72, 26, 71, and 37.
Figure 8. Contribution of Academic Programs to the First Dimension of the FAMD
Figure 9. Contribution of Academic Programs to the Second Dimension of the FAMD
Figure 11. Representation of Industrial Engineering Academic Programs according to the Region of HEI location
Among the IEPs of HEIs located in the Colombian Pacific Region, numbers 59, 54, and 27 stand out.
The following are applying the Hierarchical Cluster Analysis on the Factor Analysis Mixed Data (HCPC). The products allow the identification of sets of observations (HEI) with similar characteristics.
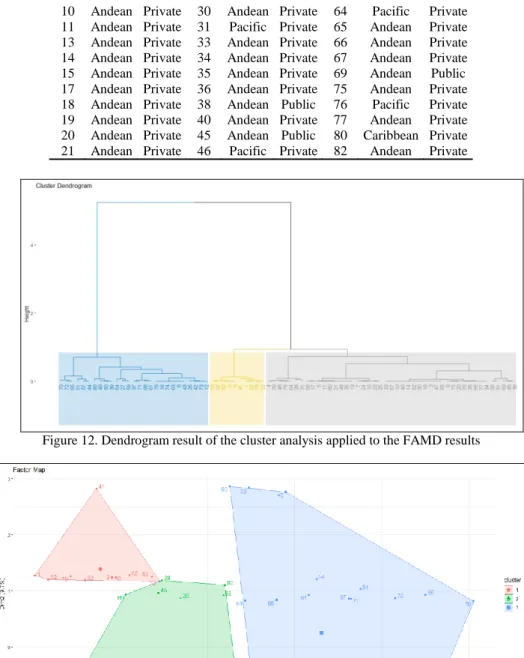
Figure 12 corresponds to the dendrogram resulting from the Hierarchical Cluster Analysis applied to the Factor Analysis Mixed Data results previously exposed. In this analysis, we considered 3 clusters. Formation of the same groups overlaps in the Factorial Map shown in Figure 13.
Figure 13 shows the three clusters formed in the FAMD Factorial Map. The best performance is presented in Group 3, followed by Group 2, being, therefore, Cluster 1 formed by the IEP of the lowest performance in the Saber Pro Tests.
According to the Hierarchical Cluster Analysis results applied to the FAMD results, each cluster comprises the academic Industrial Engineering programs shown in Tables 7, 8, and 9.
Table 7. HEIs in Cluster 1
HEI Region Type HEI Region Type
1 Caribbean Private 41 Caribbean Public 2 Caribbean Private 52 Caribbean Private 6 Caribbean Private 53 Caribbean Private 22 Caribbean Private 62 Caribbean Private 32 Caribbean Private 79 Caribbean Private
Table 7 shows that Cluster 1 (the lowest performance) consists entirely of 10 HEI in the Caribbean region, of which 9 (90%) are private and 1 (10%) is public.
Table 8. HEIs in Cluster 3
HEI Region Type HEI Region Type
8 Andean Private 54 Pacific Public
12 Andean Private 55 Andean Public
16 Andean Private 57 Andean Private
26 Andean Private 59 Pacific Private
27 Pacific Private 61 Andean Public
37 Andean Public 63 Andean Private
39 Caribbean Public 68 Andean Public
42 Andean Private 70 Andean Public
43 Andean Private 71 Andean Public
44 Andean Private 72 Andean Public
49 Caribbean Public 73 Andean Private
50 Caribbean Public 74 Andean Private
51 Caribbean Private 78 Andean Private
81 Andean Public
Table 8 shows that Cluster 3 (the best performance) is composed of 27 HEIs, of which 12 (55.56%) are from the private sector and 12 (44.44%) from the public sector. 74.07% (20) of HEIs in Cluster 3 come from the Andean Region, 14.81% (4) come from the Caribbean Region and 11.11% (3) - from the Pacific Region.
Table 9 shows that Cluster 2 is constituted by 45 HEIs, of which 40 (88.89%) are from the private sector and 5 (11.11%) from the public sector. 82.22% (37) of the HEIs in Cluster 2 are from the Andean Region, 15.56% (7) from the Pacific Region, and 2.22% (1) from the Caribbean Region.
Table 9. HEIs in cluster 2
HEI Region Type HEI Region Type HEI Region Type
3 Andean Private 23 Andean Private 47 Andean Private 4 Pacific Private 24 Andean Private 48 Andean Private 5 Andean Private 25 Andean Private 56 Andean Private 7 Andean Private 28 Pacific Public 58 Andean Public 9 Andean Private 29 Pacific Private 60 Andean Private
10 Andean Private 30 Andean Private 64 Pacific Private 11 Andean Private 31 Pacific Private 65 Andean Private 13 Andean Private 33 Andean Private 66 Andean Private 14 Andean Private 34 Andean Private 67 Andean Private 15 Andean Private 35 Andean Private 69 Andean Public 17 Andean Private 36 Andean Private 75 Andean Private 18 Andean Private 38 Andean Public 76 Pacific Private 19 Andean Private 40 Andean Private 77 Andean Private 20 Andean Private 45 Andean Public 80 Caribbean Private 21 Andean Private 46 Pacific Private 82 Andean Private
Figure 12. Dendrogram result of the cluster analysis applied to the FAMD results
Figure 13. Clusters according to the FAMD results
Tables 10, 11, and 12 show the quantitative variables associated with each cluster’s formation, ordered according to their importance in the cluster’s definition. The tables also show each variable’s mean within each group, the global mean, the standard deviation in each group, the international standard deviation, and the p-value associated with the hypothesis: “the mean of the category is equal to the overall mean.” The v-test values higher than 1.96 correspond to a p-value less than 0.05; the v test sign indicates if the cluster’s mean is lower or greater than the overall mean [13].
Table 10 indicates that the variables associated with Cluster 1 are English, Design of Productive and Logistic Systems, Mathematics
and Statistics, Critical Reading, Quantitative Reasoning, Citizen Competencies, Formulation of Engineering Projects, and Written Communication.
Table 11 indicates that the variables associated with Cluster 2 are Written Communication, Formulation of Engineering Projects, Citizen Competencies, Critical Reading, Quantitative Reasoning, English, Design of Productive and Logistic Systems, and Mathematics and Statistics.
Table 12 indicates that the variables associated with cluster 3 are Mathematics and Statistics, Quantitative Reasoning, Design of Productive and Logistic Systems, Critical Reading, Citizen Competencies, Formulation of
Engineering Projects, English, and Written Communication.
For Cluster 3, the average of all variables within the group is higher than the global average, unlike Clusters 1 and 2, thus showing its best performance.
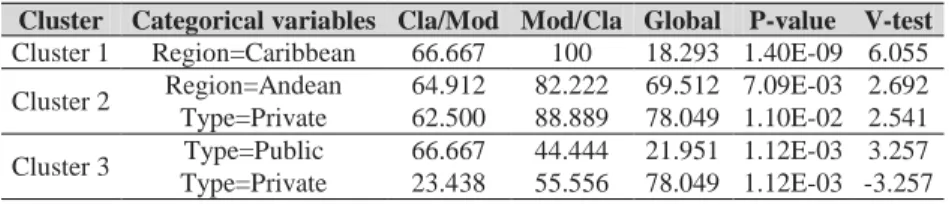
Clusters are described according to categorical variables (Type and Region). Table
13 shows the result of the χ2 test between the categorical variables and the clusters. For both qualitative variable Type and Region, the p-value is less than 0.05, indicating that the respective categorical variable is associated with the resulting clusters. Therefore, the cluster is characterized by the categorical variables.
Table 10.
Variables associated with the formation of Cluster 1
Table 11.
Variables associated with the formation of Cluster 2
Variable V-test Mean in
category Overall mean SD in category Overall SD P-value
Written Communication -3.7589 148.9851 151.9723 4.4087 7.8876 1.71E-04
Formulation of Engineering Projects -4.2248 146.9402 151.9652 5.9288 11.8054 2.39E-05
Citizen Competencies -4.5149 141.7499 147.3679 5.7439 12.3501 6.33E-06
Critical Reading -4.6490 148.0856 154.1314 6.2316 12.9075 3.34E-06
Quantitative Reasoning -4.6720 160.7929 167.5116 7.2243 14.2735 2.98E-06
English -4.7857 151.0036 159.2459 8.3900 17.0942 1.70E-06
Design of Productive and Logistic
Systems -4.8796 142.3033 150.0592 7.4032 15.7760 1.06E-06
Mathematics and Statistics -4.9072 135.4203 141.7501 5.2383 12.8026 9.24E-07
Table 12.
Variables associated with the formation of Cluster 3
Variable V-test Mean in
category Overall mean SD in category Overall SD P - value
Mathematics and Statistics 7.5050 156.9874 141.7501 9.3174 12.8026 6.14E-14
Quantitative Reasoning 7.3588 184.1684 167.5116 9.0777 14.2735 1.86E-13
Design of Productive and Logistic
Systems 7.3310 168.3999 150.0592 11.4586 15.7760 2.29E-13
Critical Reading 7.3051 169.0844 154.1314 8.9095 12.9075 2.77E-13
Citizen Competencies 7.2423 161.5520 147.3679 8.5966 12.3501 4.41E-13
Formulation of Engineering Projects 7.1547 165.3598 151.9652 7.7124 11.8054 8.38E-13
English 7.0065 178.2396 159.2459 14.3172 17.0942 2.44E-12
Written Communication 6.7730 160.4443 151.9723 5.6773 7.8876 1.26E-11
Table 13.
χ2 test between the categorical variables and the clusters
Categorical variables p-value df
Region 9.53E-11 4
Type 2.61E-03 2
Table 14 shows the characterization of the clusters according to the categorical variables. For example, Cluster 1 comprises IEPs located in HEIs of the Caribbean Region, given that 66.67% of the HEIs of the Caribbean Region are in this cluster, and 100% of the HEIs of Cluster
1 is in the Caribbean Region. Furthermore, only 18.29% of the HEIs are from the Caribbean Region.
On the other hand, Cluster 2 is featured by Andean Region IEPs (64.91% of the HEIs). 82.22% of Cluster 2 HEIs come from the Andean Region. On the other side, a second category that characterizes this cluster is the Private HEIs, since 62.5% of the Private HEIs are in this cluster, and 88.89% of the HEIs in Cluster 2 are Private.
Variable V-test Mean in category Overall mean SD in category Overall SD P-value
English -2.7849 145.0527 159.2459 6.6867 17.0942 5.35E-03
Design of Productive and Logistic Systems -3.1079 135.4409 150.0592 6.8614 15.7760 1.88E-03
Mathematics and Statistics -3.3158 129.0935 141.7501 4.3367 12.8026 9.14E-04
Critical Reading -3.4215 140.9644 154.1314 5.9605 12.9075 6.23E-04
Quantitative Reasoning -3.4636 152.772 167.5116 6.6146 14.2735 5.33E-04
Citizen Competencies -3.5351 134.3512 147.3679 6.9309 12.3501 4.08E-04
Formulation of Engineering Projects -3.8507 138.412 151.9652 6.5027 11.8054 1.18E-04
Regarding Cluster 3, we can see that it is characterized by Public HEIs, as 66.67% of HEIs are in this cluster are public.
For each category, the v-test is the statistic used to compare the cluster proportion with the population proportion. The test is based on the hypergeometric distribution. The results evidence that the cluster’s percentage is different from the population proportion. The positive v-test value indicates that the cluster’s ratio is higher than the population proportion; a negative value indicates the opposite.
Also, it is possible to consider the representative observations of each cluster. For
each set, we calculated the distance of each item from the cluster’s centroid. Table 15 shows the five closest items in each group.
It is also possible to determine each cluster the observations ordered according to their distance (from highest to lowest) to the nearest group’s centroid so that it is possible to decide on each group’s specific observation.
Table 16 shows that observation 1 is specific to Cluster 1 since it is the Industrial Engineering Program farthest from the centers of Groups 2 and 3. Similarly, Item 28 is specific to Cluster 2, and Item 70 is specific to Cluster 3.
Table 14.
Clusters characterization according to categorical variables
Cluster Categorical variables Cla/Mod Mod/Cla Global P-value V-test
Cluster 1 Region=Caribbean 66.667 100 18.293 1.40E-09 6.055
Cluster 2 Region=Andean 64.912 82.222 69.512 7.09E-03 2.692
Type=Private 62.500 88.889 78.049 1.10E-02 2.541
Cluster 3 Type=Public 66.667 44.444 21.951 1.12E-03 3.257
Type=Private 23.438 55.556 78.049 1.12E-03 -3.257
Table 15.
The closest items to the centroid in each cluster
Cluster Items (Distance)
Cluster 1 2 (0.4163) 22 (0.5096) 6 (0.5222) 79 (0.8629) 62 (0.8908) Cluster 2 17 (0.5530) 33 (0.6375) 40 (0.6631) 67 (0.6773) 56 (0.6776) Cluster 3 73 (1.1295) 12 (1.1434) 42 (1.4500) 61 (1.6004) 71 (1.6595)
Table 16.
The farthest items from the centroid of the nearest cluster
Cluster Items (Distance to the center of the nearest cluster)
Cluster 1 1 (4.3569) 52 (4.0293) 41 (3.8364) 79 (3.5429) 22 (3.2642) Cluster 2 28 (4.4625) 46 (4.1393) 31 (4.0679) 38 (3.8765) 64 (3.8427) Cluster 3 70 (9.0262) 44 (7.8879) 55 (7.6992) 57 (7.0309) 59 (6.9792)
IV. C
ONCLUSIONThis article proposes a novel (and colorful) way of studying, through statistical techniques that allow visualizing employing figures and tables, the comparative academic performance of 82 Industrial Engineering Programs (IEPs) in Colombia, using the standardized Saber Pro tests.
There are no studies in the literature that analyze academic performance through statistical tools that simultaneously include qualitative and quantitative variables in a single analysis.
In this sense, this research shows how to use Factor Analysis Mixed Data (FAMD) and Hierarchical Cluster Analysis on Principal Component (HCPC) to study performance in the educational sector. It is the first application of the FAMD-HCPC in the academic field.
In general terms, the results confirm that the best performing universities usually appear in the first places in the different rankings.
For example, the best performing IEPs in the Caribbean Region are numbers 39, 49, 50, and 51, especially the numbers 49 and 51, which belong to two universities located in Barranquilla, Department of Atlántico. The central city of the Colombian Caribbean
Among the IEPs of the Pacific Region, the numbers 27, 54, and 59 are outstanding for their performance (these belonging to three HEIs located in the city of Cali, Department of Valle del Cauca), the principal city of the Colombian Pacific.
Among the IEPs of Public HEI of the Andean Region, the following stand out for their performance: 37, 55, 61, 68, 70, 71, 72, 73, and 81, three of these are located in the city of Bogotá, two in Medellín, one in the city of
Bucaramanga, one in Manizales, one in Sogamoso and the other in Pereira.
Among the IEPs of the Andean Region belonging to Private HEIs, Items 26, 27, 37, 42, 43, and 44 stand out. The latter one corresponds to an HEI of high recognition for its high research productivity and its quality.
The hierarchical cluster analysis shows that the IEP group with the lowest performance (Cluster 1) incorporates HEIs programs in the Colombian Caribbean Region. IEP 41 is the only public HEI here. The other IEPs of the group are HEIs of the private sector. On the other hand, Cluster 2 engages IEPs of the Andean Region. The second category describing this cluster is Private HEIs. Regarding Cluster 3, we can see that HEIs are mostly public here.
For each group, it was possible to determine the most representative IEPs and the specific IEPs.
The study showed that both the quantitative and qualitative variables considered contributing to the formation of the clusters.
It is important to emphasize that the Industrial Engineering Programs of Universities’ best results are located in large cities. On the other hand, the best performance in the private sector is found in those with great resources and high tuition fees. It shows, once again, that the availability of resources contributes to the achievement of better results.
R
EFERENCES[1]
SILVA,
J.,
BERNAL,
E.
and
HERNÁNDEZ, C. (2013) Modelo de
aseguramiento interno de la calidad para las
instituciones de educación superior en el
marco del mejoramiento continuo de la
calidad de la educación superior en
Colombia.
Ministerio
de
Educación
Nacional [Internal quality assurance model
for higher education institutions within the
framework of continuous improvement of
the quality of higher education in Colombia.
Ministry of National Education] [Online].
Available
from:
www.cna.gov.co/1741/articles-186502_Modelo_aseguramiento.pdf
[Accessed 23/02/2020]
[2] INSTITUTO COLOMBIANO PARA
LA EVALUACIÓN DE LA EDUCACIÓN,
ICFES. (2018). SABER PRO. Informe
Nacional de Resultados 2016-2017. [Online]
Available
from:
https://www.icfes.gov.co/documents/20143/
1455351/Saber%20Pro-informe%20nacional%20de%20resultados%
202016-2017%20(2018).pdf
[Accessed 23/02/2020]
[3] ALDÁS, J., ESCRIBÁ, A. and SAFÓN,
V. (2016). La universidad española: Grupos
estratégicos y desempeño. Fundacion
BBVA.
[4] ZHANG, X., and SHI, W. (2019)
Research about the university teaching
performance evaluation under the data
envelopment method. Cognitive Systems
Research,
56,
pp.
108-115.
doi:
10.1016/j.cogsys.2018.11.004
[5] GONZÁLEZ-GARAY, A., POZO, C.,
GALÁN-MARTÍN,
Á.,
BRECHTELSBAUER, C., CHACHUAT,
B.,
CHADHA,
D.,
HALE,
C.,
HELLGARDT, K., KOGELBAUER, A.,
MATAR, O., MCDOWELL, N., SHAH, N.,
and GUILLÉN-GOSÁLBEZ, G. (2019)
Assessing
the
performance
of
UK
universities in the field of chemical
engineering
using
data
envelopment
analysis. Education for Chemical Engineers,
29, pp. 29-41. doi:
10.1016/j.ece.2019.06.003[6] LIU, N. C., and CHENG, Y. (2005) The
academic ranking of world universities.
European Journal of Higher Education, 30
(2),
pp.
127–136.
doi:
10.1080/03797720500260116
[7] URAP - University Ranking by Academic
Performance (2018) [Online] Available
from:
http://www.urapcenter.org/
2018/index.php [Accessed 25/05/2020]
[8] World University Rankings 2018 (2018).
[Online]
Available
from:
https://www.timeshighereducation.com/worl
d-university-rankings
[Accessed
25/05/2020]
[9] NTU Ranking 2018 (2018) [Online]
Available
from:
http://nturanking.lis.
ntu.edu.tw/ [Accessed 25/05/2020]
[10] HUANG, M. (2011) A comparison of
three major academic rankings for world
universities: from a research evaluation
perspective.
Journal
of
Library
and
Information Studies, 9 (1), pp. 1–25.
[11] MARGINSON, S., and VAN DER
WENDE, M. (2006) The impact of global
rankings in higher education. Journal of
Studies in International Education, 114 (3),
pp.
306–329.
doi:
10.1177/1028315307303544
[12]
SAPIENS
RESEARCH
(2020).
Ranking
U-Sapiens
2020-1
[Online].
Available
from:
https://www.srg.com.co/lasmejoresuniversid
ades/usapiens.php [Accessed 22/03/2020]
[13] HUSSON, F., JOSSE, J., and PAGÈS,
J. (2010) Principal component
methods-hierarchical
clustering
-
partitional
clustering: why would we need to choose for
visualizing data? [Online] Available from:
http://www.sthda.com/english/upload/hcpc_
husson_josse.pdf [Accessed 22/09/2020]
[14] KASSAMBARA, A. (2017). Practical
guide to principal component methods in R:
PCA, M (CA), FAMD, MFA, HCPC,
factoextra (Multivariate
analysis
II).
Published
by
STHDA
(http://www.sthda.com).
[15] HUSSON, F. (2010) Hierarchical
clustering.
[Online]
Available
from:
https://husson.github.io/MOOC_GB/clusteri
ng_course_slides.pdf
[Accessed
22/05/2020].
[16] TRIPATHI, M., and SINGAL, S. K.
(2019) Allocation of weights using factor
analysis for development of a novel water
qualityindex. Ecotoxicolog
and
environmental safety, 183, 109510. doi:
10.1016/j.ecoenv.2019.109510
[17] HAIDAR, AAM, ZHI, F., WASIM I.,
ABASS, Q, andIRAM. R. (2019) Novel
approach of Principal Component Analysis
method to assess the national energy
performance via Energy Trilemma Index.
Energy Reports, 5, pp. 704-713. doi:
10.1016/j.egyr.2019.06.009
[18] ONAT, N. C., KUCUKVAR, M., and
AFSHAR, S. (2019) Eco-efficiency of
electric vehicles in the United States: A life
cycle assessment based principal component
analysis. Journal of Cleaner Production,
212,
pp.
515-526.
doi:
10.1016/j.jclepro.2018.12.058
[19] DU, X., and CHEN, S. (2015) The
application of factor analysis method in
performance evaluation of listed banking
business.
In:
Proceedings
of
2015
International Conference on Education,
Management, Information and Medicine,
Shenyang, China, April 24-26, 2015.
Paris:
Atlantis
Press,
pp.799-804.
doi:
10.2991/emim-15.2015.156[20] HORNUNGOVÁ, J. (2014) Análisis
factorial: un instrumento de selección de
factoressociales de rendimiento [Factor
analysis: An instrument for selection of
social performance factors]. Revista de
métodos cuantitativos para la economía y la
empresa, 17, pp. 121 – 136.
[21] TAM, V. W., TAM, C. M., YIU, K. T.
and CHEUNG, S. O. (2006) Critical factors
for environmental performance assessment
(EPA) in the Hong Kong construction
industry. Construction Management and
Economics, 24(11), pp. 1113-1123. doi:
10.1080/01446190600799620
[22] GARCÍA, I., and ABASCAL, E. (2004)
A methodology for measuring latent
variables based on multiple factor analysis.
Computational statistics and data analysis,
45(3), pp. 505-517. doi:
10.1016/S0167-9473(03)00037-9
[23] GARCÍA, I., GIL, C., PASCUAL, P.
and RAPÚN, M. (1998) Una propuesta
metodológica para la ordenación de las
infraestructuras
regionales
[A
methodological
proposal
for
the
management of regional infrastructures].
Revista Estudios Regionales, 51, pp. 145–
170.
[24] VISBAL-CADAVID, D.,
MARTÍNEZ-GÓMEZ,
M.,
and
ESCORCIA-CABALLERO,
R.
(2020)
Exploring
university performance through multiple
factor
analysis:
A
case
study.
Sustainability, 12(3), pp. 924. doi:
10.3390/ su12030924[25] WANG, E. (2017) Decomposing core
energy factor structure of US residential
buildings through principal component
analysis with variable clustering on
high-dimensional
mixed
data. Applied
Energy, 203,
pp.
858-873.
doi:
10.1016/j.apenergy.2017.06.105
[26] PEREIRA, N. (2019) Factor Analysis
of Mixed Data (FAMD) and Multiple Linear
Regression in R. Dissertations, 212. School
of Computing, Technological University
Dublin. Dublin, UK. Available from:
https://arrow.tudublin.ie/scschcomdis/212
[Accessed 22/07/2020].
[27] NASCIMENTO, L. E. S., ARRIOLA,
N. D. A., DA SILVA, L. A. L., FAQUETI,
L. G., SANDJO, L. P., DE ARAÚJO, C. E.
S., BIAVATTI, M. W.,
BARCELOS-OLIVEIRA, J. L., and AMBONI, R. D. D.
M. C. (2020) Phytochemical profile of
different
anatomical
parts
of
jambu
(Acmella oleracea (L.) RK Jansen): A
comparison
between
hydroponic
and
conventional cultivation using PCA and
cluster
analysis. Food
Chemistry, 332,
127393. doi:
10.1016/j.foodchem.2020.127393[28] MARGARITIS, A., SOENEN, H.,
FRANSEN,
E.,
PIPINTAKOS,
G.,
JACOBS, G., and BLOM, J. (2020)
Identification of ageing state clusters of
reclaimed asphalt binders using principal
component analysis (PCA) and hierarchical
cluster analysis (HCA) based on
chemo-rheological parameters. Construction and
Building
Materials, 244,
118276.
doi:
10.1016/j.conbuildmat.2020.118276
[29] SÁNCHEZ, L. DE C., ESPINOSA, L.
G.,
DEL
MORAL-RAMÍREZ,
E.,
RAMÍREZ-MÉDELES, M. DEL C.,
GUTIÉRREZ-MAGDALENO, G.,
and
PÉREZ-HERNÁNDEZ,
G.
(2019).
Influence of physicochemical factors on
environmental availability and distribution
of semiochemicals that affect Varroa
destructor
and
phylogenetically
close
organisms: classification by VHWOC
PCA-clustering.
Heliyon,
5(8),
e02269.
doi:
10.1016/j.heliyon.2019.e02269[30] JAVADI, S., HASHEMY, S. M.,
MOHAMMADI, K., HOWARD, K. W. F.,
and NESHAT, A. (2017) Classification of
aquifer vulnerability using K-means cluster
analysis. Journal of Hydrology, 549, pp.
27-37. doi:
10.1016/j.jhydrol.2017.03.060[31] R CORE TEAM (2020). R: A language
and environment for statistical computing. R
Foundation
for
statistical
computing,
Vienna,
Austria.
Available
from:
https://www.R-project.org/.
[32] LÊ, S., JOSSE, J. and HUSSON, F.
(2008) FactoMineR: An R Package for
multivariate analysis. Journal of Statistical
Software,
25(1),
pp.
1-18.
doi:
10.18637/jss.v025.i01