Structural Analysis of CBFC which
Operate Paddy Field Production
─ Focusing on the Period of Rapid Increase in CBFC─
By
Gentaro S
uzumura*
†(Received February 18, 2015/Accepted July 24, 2015)
Summary:Many have called for improving efficiency in Japan’s paddy rice production system as it faces
the aging of small-scale individual farmers and the need for cost reduction. As a solution, operations under entities called “CBFC(Community-Based Farm Cooperatives)” have been actively promoted in recent years, with the aim of producing crops more efficiently through collaboration among farmers while curbing investments through the shared use of machinery in each community. Particularly, it is well known that numerous CBFC were established or reorganized because of a series of reforms in the country’s rice polices beginning in 2004 and incentives under a government program designed to stabilize income of persons and entities engaged in paddy and/or upland farming starting in 2007. It has also been noted, however, that many of the CBFC that sprang up in the years from 2006 to 2008 were hastily created to meet the requirements to benefit from these policies and program (researchers say that at some of these entities costs, sales income, etc. were calculated for each member separately, without centralizing their accounts). This report focuses on this period of rapid increase in the number of such entities and, based on a reclassification of individual data from a government survey, clarified, from the viewpoint of structure, the differences in nature between CBFC that had already been operating before the introduction of the farming income stabilization program (FISP) and new entities founded or reorganized in the said period. In particular, the report took into account the structural differences between the regions where many CBFC had been established earlier on, such as Hokuriku and San’in, and the regions where many entities were quickly set up or reorganized in the period in question, such as Tohoku, Kanto-Tosan, and Kyushu, and looked at how many certified farmers those entities included, the percentage of farmers participating in these entities, and the percentage of entities that had members mainly engaged in farming. By doing this, the report shed light on the fact that newly established or reorganized entities had a lower tendency to engage the entire community in farming operations-that is to say, in nature they tended to comprise individual farming operations simply grouped together. The statistical analysis also reveals that the farmland consolidation rate of new or reorganized entities is higher in Kyushu, Tohoku, Kanto-Tosan. Moreover, this report hopes to be the primary document of support measures towards the development of entities maintenance.
Key words:Community-Based Farm Cooperatives (CBFC), agricultural structure, consolidation of
farmland, farming income stabilization program (FISP)
Research Background and Issues
CBFC (Community-Based Farm Cooperatives) have come to play essential roles in Japan’s paddy rice production today. They increased rapidly in number from 2006 to 2008 on the back of rice policy reforms
pushed forward by the Ministry of Agriculture, Forestry and Fisheries (MAFF) since 2004, such as the formulation of visions for paddy field farming by region, and more directly, as a result of incentives provided under a MAFF program designed to stabilize income of persons and entities engaged in paddy and upland farming
*
†
Department of International Biobusiness Studies, Tokyo University of Agriculture Corresponding author(E-mail : [email protected])
論 文 Articles
(hereinafter “farming income stabilization program (FISP)”) implemented starting from crops produced in 2007.
It is widely believed that a MAFF survey in Novem-ber 2000 provided the first-ever statistics capturing an overall picture of CBFC in the country. Since 2005, MAFF has been conducting a more detailed Survey on CBFC annually based on the same definition of the term “CBFC” as used in the 2000 survey. Fig. 1 shows changes in the total number of CBFC. The number rose from 9,961 in 2000 to 14,717 in 2014. Taking the growth between 2000 and 2014 as 100 percent, 2.2 percent of the increase occurred between 2000 and 2005, 9.0 percent between 2005 and 2006, and 53.3 percent-more than half of the entire increase-between 2006 and 2008. The data reflects how quickly new CBFC were set up in the period which is the subject of the analysis in this paper. Based on field surveys on the status of CBFC, some researchers have reported or pointed out the diversity in the nature of those entities, noting such points as : some of them lack substance ; they differ greatly in their orga-nizational structure ; and some of them have no members mainly engaged in farming. Many observers also believe that significant regional differences exist in such aspects as the relationships between local certified farmers and CBFC as well as the percentages of farmland consolidated by such entities. Above all, many infer that because of MAFF policies, particularly the FISP, CBFC portrayed in the fiscal 2006 survey findings and those established or reorganized later to meet the program requirements have major differences in terms of their structure and nature. No studies, however, have elucidated the whole picture of these structural changes in such entities using
statistical methods.
To look into these issues, the author carried out a reclassification of individual data from the MAFF Survey on CBFC from 2006 to 2008, during which time particu-larly many CBFC were created. The data were obtained from MAFF’s Statistics Department by making an application for use in this report. The author identified individual data that appeared to be consecutive for three years through matching based on the names of entities, the names of their representatives, and the entity addresses,1) and analyzed these data in comparison to
the statistical data on entities that were new as of 2007 and 2008.
This report aims to clarify regional differences between the structure of CBFC established under the influence of MAFF’s management stabilization program and the structure of those created earlier, thereby unraveling the impact of the implementation of FISP on different regions and examining how these different types of CBFC can influence local agriculture.
Status of Participation in the FISP and
Continuity of MAFF Survey Data
Incentives under the Program and the Number of CBFC Participating in the Program
As discussed above, the number of CBFC sharply increased around 2007, when the FISP was implemented, and the increase is likely to be a result of incentives under the program. Now let us look at Table 1, which shows the relationship between numbers of CBFC participating in the program as reported in the MAFF Survey on CBFC and the actual numbers of program participants published by MAFF’s office in charge of the
Fig. 1 Changes in the Total Number of CBFC
program. In the latter data, incorporated CBFC were counted as “certified farmers” and hence precise num-bers of incorporated participants to the program are not available. Because of this, the table compares the numbers of non-incorporated entities extracted from among CBFC participating in the FISP found in the MAFF surveys and the numbers of program participants published by the office in charge of the program.
In the May 2006 survey, 5,859 entities said they were planning to participate in the FISP, of which 2,409 entities were not incorporated. The actual number of program participants counted by the office in charge of the program as of November 2006 was 3,054 entities. The data by region as of November 2006 show that Kyushu had the largest number of program participants, at 1,101 entities. With regard to the proportions of the numbers of program participants as of November 2006 to the numbers as of June 2007, which are the final num-bers of participants to the program for crops produced in 2007, the percentages are higher mainly in areas that produce autumn-sown wheat, such as Shikoku (96.0 percent), Kinki (90.5 percent), Hokkaido (89.6 percent), and Kyushu-Okinawa (81.4 percent). As such, the statistics confirm that participation in the FISP increased rapidly in autumn-sown wheat production areas ahead of other areas. It is also notable that the actual numbers of program participants as of November 2006 are similar to those found in the February 2007 survey. The similarity indicates that the survey captured the numbers of pro-gram participants almost completely.
Many observers have noted that a significant number of CBFC rushed to make application later, from around April to June 2007, for the implementation of the FISP that year, as the deadline for application was the end of
June 2007. The author infers that the number of entities that rushed to participate in the program during this period should be almost equal to the difference between the number reported in the February 2007 survey and the actual number of participants as of June 2007. The difference is 2,366 entities in total, which means that 44 percent of the participants to the 2007 program made application hastily to meet the deadline. By region, Tohoku accounted for the largest number of such pants, at 1,328 entities. The proportion of these partici-pants who are thought to have rushed to meet the deadline to the total number of participants as of June 2007 is higher in Tohoku (84.2 percent), Chugoku (64.1 percent), and Kanto/Tosan (54.1 percent).
Based on the relationship between the survey dates and the date of the program implementation described above, it is fair to assume that the February 2007 survey captured the number of CBFC that entered the program mainly in areas that produce autumn-sown wheat, while the number of entrants to the program in areas that have converted to soybean production from rice produc-tion and areas dedicated to rice producproduc-tion was reflected in the February 2008 survey. Based on this, it is appropriate to consider that most of the increase in CBFC established or reorganized under the influence of the MAFF FISP was recorded as new entities in the statistics over these two years.
Confirmation of Continuity in Three-Year Data and Classification of New and Existing Entities
As stated earlier, in order to examine the data from MAFF’s Survey on CBFC over three years, the author extracted individual data that are consecutive for three years. This work was aimed at analyzing the difference
in nature between conventional CBFC that have contin-ued to exist since before the introduction of the FISP and those established or reorganized to meet the pro-gram requirements.
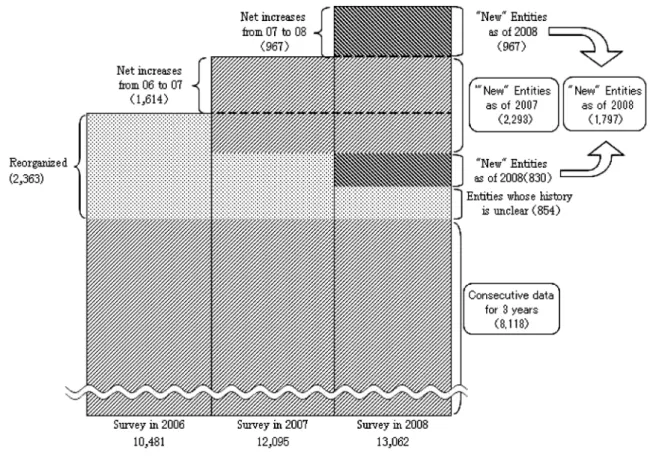
Fig. 2 is a conceptual diagram based on findings from this work. It shows changes in the number of new and existing CBFC. The matching of individual data found 8,118 entities that had consecutive data for three years. It is fair to assume that these entities experienced no major organizational changes in the three years.2)
Although this assumption may not be precise, because among all the entities covered in the statistics there were a few consolidated or split entities, it is possible to consider that the difference between the total number of CBFC reported in the 2006 survey (10,481 entities) and the number of entities with three-year consecutive data (8,118 entities) approximately represents the number of entities that underwent reorganization in the three years (2,363 entities). It can also be inferred that the net increases in the total number of entities from May 2006 to February 2007 (1,614 entities) and from February 2007 to February 2008 (967 entities) respectively represent the
numbers of entities that are likely to have been newly established, regardless of whether they had a prede-cessor organization or not.3)
The upper part of Fig. 2 shows the relationship between entities other than those with three-year con-secutive data and entities that were labeled as “new” as of 2007 or 2008 in the MAFF statistical data.4) Among
the 1,797 “new” entities as of 2008, 967 entities corre-spond to the net increase between 2007 and 2008, but the remaining 830 entities are mostly considered to have existed since 2006 or earlier.5) Therefore these 830
entities are shown under the entities that were “new” as of 2007. Similarly, the 2,293 entities that were “new” as of 2007 can be classified into 1,614 entities that corre-spond to the net increase between 2006 and 2007, and the remaining 679 entities that are thought to have existed since 2006 or earlier and undergone some reor-ganization. Entities that do not fall under the above described categories-the entities with three-year consecu-tive data and the entities that were “new” as of 2007 or 2008- are entities whose history is unclear (854 entities). Table 2 compares the numbers of CBFC and the
Fig. 2 Changes in the Number of New and Existing CBFC after 2006 (Conceptual Diagram)
Source : Survey on CBFC, MAFF (2006, 2007, 2008).
Notes : 1) The numerical value of new entities in 2007 or 2008 is the numerical value which is “new” on the statistical repartition.
2) There ware 102 cases of “integration” in 2007 and 67 cases in 2008, therefore the number of entities decreased for a short while. But this decrease is not considered in this figure.
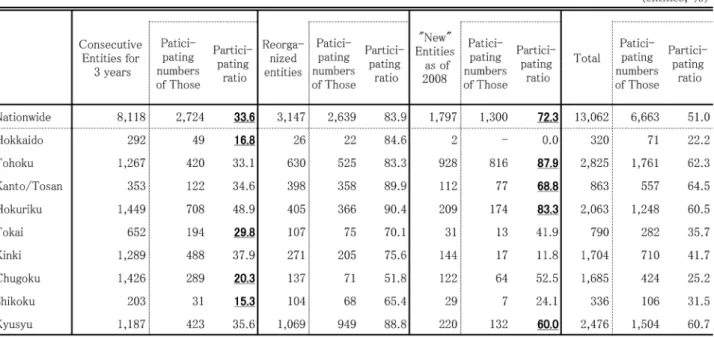
numbers of participants to the FISP by category (new, reorganized or existing). Although the data on entities labeled as “new” in the MAFF survey shown here are only for entities that were “new” as of 2008, the table shows that the percentage of FISP participants among the existing entities with three-year consecutive data is lower (33.6 percent) while the percentages of program participants were very high among the entities that were “new” as of 2008 (72.3 percent) and among the entities that underwent reorganization, which includes the “new” entities as of 2007 (83.9 percent). These data shown in Table 2 appear to be consistent with the findings from a survey and analysis by the PRIMAFF in 2008, which indicated that most of the CBFC participating in the FISP that were covered by the survey had under-gone some kind of organizational change before entering the program (Research team on income stabilization ject, PRIMAFF [7]). By region, the percentage of pro-gram participants among CBFC that were “new” as of 2008 was higher in Tohoku (87.9 percent) and in Hokuriku (83.3 percent). The percentage of program participants among reorganized CBFC was higher in Hokuriku (90.4 percent) and Kanto-Tosan (89.9 percent), as well as in Kyushu (88.8 percent) and Hokkaido (84.6 percent). The latter two are areas where many farmers grow autumn-sown wheat. On the other hand, among CBFC with three-year consecutive data, the percentage of the pro-gram participants was particularly lower in Shikoku (15.3 percent), Hokkaido (16.8 percent), and in Chugoku (20.3
percent).
As such, a substantial portion of CBFC participating in the FISP were newly established or had undergone reor-ganization. What is then the nature of entities that had continued to exist for at least three years prior to the introduction of the program and then participated in the program when it was introduced? An answer to this question can be found in Table 3. The table confirms that the percentage of incorporated entities among these existing CBFC participating in the program is nearly ten
Table 2 Number of CBFC and participating racio every connection repartition
Table 3 Corporation ratio according to participation
times higher than the percentage of incorporated entities among existing entities not participating in the program, and also far higher than the percentage of incorporated entities (12.2 percent) among all CBFC as of 2008 (13,062 entities).
By region, the percentage of incorporated entities was particularly higher in Shikoku (67.7 percent), Chugoku (62.6 percent), and Hokkaido (44.9 percent). The per-centage in Hokuriku, where the number of program participants with three-year consecutive data was the largest among all regions, stood at 39.0 percent. The lowest percentage of incorporated entities among all regions was reported in Kinki (7.6 percent), which is probably affected by the fact that the percentage of incorporated entities as of 2006 was originally the lowest among all regions at 2.5 percent, compared to the nation-wide average of 8.0 percent.
The reason why the percentage of incorporated enti-ties was higher among FISP participants is probably because incorporated CBFC were more stable compared to non-incorporated entities and were already engaged in substantial operations, thereby being eligible to partici-pate in the program as they were.6) On the other hand,
the reason why non-incorporated entities were likely to undergo reorganization can be because some of them had to revise the scope of community farming in order to participate in the program ; and some others, which had been traditional farming associations with no
sub-stance as management bodies, had to reorganize themselves to meet the requirements such as accounting of sales for the entity as a whole (centralized accounting).
Characteristics of CBFC with and without
Three-Year Consecutive Data
What are the characteristics of CBFC with three-year consecutive data and those without such data (new or reorganized entities)? The author analyzed both types of entities in terms of the percentage of consolidated farm-land and the percentage of certified farmers incorporated in such an entity out of all the certified farmers in each community.
Let us look at the percentage of consolidated farmland in each community, which is calculated by dividing the area of farmland consolidated under the CBFC’s control (the sum of the area managed by the entity and the area for which farm work is contracted to the entity) by the total area of farmland in the community where the entity is located, and multiplying by 100. The percentage shows how much of the land in a community is covered by the CBFC.
Fig. 3 shows this percentage of consolidated farmland by region. The nationwide data shows the percentage was almost the same for new or reorganized entities and for entities with three-year consecutive data. By region, however, there were two types of regions with different tendencies : the farmland consolidation rate was higher
Fig. 3 Difference among regions of the farmland consolidation rate
Source : Survey on CBFC, MAFF (2008).
Note : Farmland consolidation rate=Consolidated farmland area (Farm management area+Operational trusting area)/Total plowland area of the community×100.
for new or reorganized entities than for entities with three-year-consecutive data in Kyushu (65.3 percent of new or reorganized entities had a rate of farmland con-solidation of 50 percent or more), Tohoku (57.8 percent), Kanto-Tosan (47.6 percent) ; and the farmland consolida-tion rate was lower for new or reorganized entities in Kinki (28.8 percent of new or reorganized entities had a rate of farmland consolidation of 50 percent or more), Shikoku (39.1 percent), Hokuriku (47.9 percent), Tokai (58.3 percent), and Chugoku (62.4 percent). The first type of regions tended to have many certified farmers and other core actors, hence they did not need to establish CBFC, while the second type of regions had faced a decrease of solid core actors and hence developed many CBFC especially in paddy rice production areas.
With regard to the reason why these regional charac-teristics appeared, it is easy to imagine that newly estab-lished CBFC in regions facing a shortage of core farmers were not able to achieve high rates of farmland
consoli-dation as they were not likely to incorporate sufficient numbers of rice farmers (although this cannot be con-firmed using data from the Survey on CBFC because the survey items do not cover such points). However, the higher rates of farmland consolidation achieved by new or reorganized entities in regions where many core farmers had existed, such as Kyushu, Tohoku, and Kanto-Tosan, should be treated carefully : farmland in such regions may have been consolidated only nominally by what were touted as CBFC but actually were indi-vidual farming operations put together to receive grants. Sakai [5] indicates that in such entities income distribu-tion to member farmers and their substantial use of machinery remained the same as before the formation of these entities. Further analysis would be required to determine whether the high percentages of consolidated farmland reflect the real status of the CBFC in each community.
Table 4 shows rates of participation in new and
existing CBFC among certified farmers. The rate was calculated for each community by dividing the number of certified farmers participating in the CBFC by the number of all certified farmers in the community and multiplying by 100. The rate would be lower when certified farmers or other core actors coexist alongside with a CBFC based on an arrangement to cover different areas in the community or because of other reasons. Conversely, the rate would be higher when a CBFC was organized by including certified and other core actors. The nationwide data shows the rates of participation among certified farmers tended to be lower for new entities as of 2008 than for existing entities. While 82.0 percent of existing entities had a 50 percent or more participation rate and 66.3 percent had a 100 percent participation rate, the percentages of new entities as of 2008 with a 50 percent or more participation rate and those with a 100 percent participation rate were 4.5 points and 15.5 points lower, respectively, compared to the percentages for existing entities. By region, the percentages of new entities with a 50 percent or more participation rate and those with a 100 percent participa-tion rate were both lower compared to the percentages for existing entities in almost all regions. The differences were the largest in Kanto-Tosan : in the region, the percentages of new entities with a 50 percent or more participation rate and those with a 100 percent participa-tion rate were 26.9 points and 33.7 points lower, respec-tively, compared to the percentages for existing entities. It is noteworthy that in the Kinki region the rate of participation among certified farmers tended to be higher for new entities : the percentages of new entities with a 50 percent or more participation rate and those with a 100 percent participation rate were 18.8 points and 16.2 points higher, respectively, compared to the percentages for existing entities. Further examination of the region by prefecture confirmed that the tendency was particularly notable in Hyogo (sample size 26 groups), Kyoto (7 groups), and Shiga (6 groups), and that Hyogo, which had a relatively large number of new entities as of 2008, had a major influence on the entire region’s tendency. The reasons why participation rates for new entities tended to be higher only in the Kinki region may have been because (a) certified farmers who grew vegetables, had orchards, or kept livestock and at the same time also produced rice were involved in CBFC in terms of the rice production portion of their farming operations ; (b) a number of new CBFC were created by actively involving paddy rice farmers in the region ; or (c) some CBFC members were able to meet the requirements for certi-fied farmers as the criteria were relaxed in a number of municipalities recently. However, it is difficult to
conclusively determine the reasons, because the Survey on CBFC provides no data on how different types of certified farmers operate their business.
On the other hand, the table shows the numbers of certified farmers included in CBFC differed greatly among regions depending on whether the region had ample core actors or not : Hokkaido had a far higher average number, and Tohoku, Kanto-Tosan, Chugoku-Shikoku, and Kyushu had relatively larger numbers of certified farmers, at 4 to 5 on average, while Hokuriku, Tokai and Kinki had less than 3 certified farmers on average. The data also confirmed that new entities in the Chugoku-Shikoku region had particularly fewer certified farmers compared to existing entities : the average numbers of certified farmers in new entities as of 2008 with a participation rate of 50 percent or more and those with a participation rate of 100 percent were 2.7 and 3.0 lower, respectively, compared to the average numbers for existing entities.
Status of Inclusion of Core Actors in
CBFC and Their Structures
In this section, the author analyzes how the status of inclusion of certified and other core actors in CBFC affected their structure and nature, by focusing on differences among entities with three-year consecutive data and those established in 2007 or 2008.
Rate of Participation in CBFC among Farmers and Rate of Entities that had Members Mainly Engaged in Farming
Let us look at Fig. 4, which explains how new CBFC as of 2007 or 2008 were structured differently from existing entities that had mainly developed, involving the entire community, into farming operations. The horizontal axis of the figure shows the percentage of farmers par-ticipating in CBFC. The vertical axis shows the percent-age of CBFC that had members mainly engpercent-aged in farming. Entities with a higher tendency to involve the entire community appear closer to the lower right cor-ner, while entities similar to traditional farming associa-tions or entities created by hastily putting together core actors are shown closer to the upper left corner.7)
Looking at entities with three-year consecutive data, the point indicating the nationwide average indicates a slight shift toward the upper left from 2006 to 2008 : the percentage of farmers participating in CBFC declined from 81.3 percent in 2006 to 79.6 percent in 2008, while the percentage of entities that had members mainly engaged in farming increased from 57.7 percent in 2006 to 66.6 percent in 2008. By region, the positions of Hokuriku, Kinki, and Chugoku in 2006 are close to the
lower right corner, but Hokuriku and Kinki show a significant shift upward in three years (Group 1). On the other hand, the points for Hokkaido, Tohoku, Kanto-Tosan, Tokai, and Kyushu as of 2006 are located to the left of and/or higher than the former three regions, and in 2008 the percentage of farmers participating in CBFC in the latter five regions declined and the percentage of entities that had members mainly engaged in farming increased, although these shifts are small except for Kyushu (Group 2).
In contrast, newly established CBFC are mostly shown further toward the upper left corner of the Fig. 4.8) New
entities in Kanto-Tosan, Kyushu, Hokuriku, Tohoku, and Tokai are shown to the left of entities with three-year consecutive data. This should be interpreted as an indi-cation that relatively many new entities in these regions were established with the aim of receiving grants under MAFF policies by putting together individual farming operations as a formality (Group 3). On the other hand, new entities in Chugoku and Kinki are closer to the lower right corner compared to those in the former five re-gions. It can be considered that new CBFC in Chugoku and Kinki were formed with an entity similar to a traditional farming association at their core instead of being created as entities aimed at receiving grants by putting together core farmers (Group 4).
As such, many CBFC with lower tendency to involve the entire community were born from 2006 through 2008. In particular, most of the entities established in these three years were actually organizations similar to tradi-tional farming associations or entities aimed at receiving grants. These entities similar to traditional farming associations and entities created to receive grants by assembling individual farming operations were probably the type of organizations with no centralized accounting system, which were widely viewed as likely to lack substance as management bodies.
Status of Inclusion of Certified Farmers in New CBFC and Consolidation of Farmland
Fig. 5 shows the relationship between the percentage of CBFC that include certified farmers and areas of farmland consolidated by such entities.
Regarding CBFC with three-year consecutive data, the figure shows a trend of increase in the percentage of entities that included certified farmers. The increase appears especially sharp in the Kinki, Hokuriku, and Kyushu regions. This may be because of a relaxation of requirements for certified farmers across the country around 2006 (lowering of the target income stipulated in the basic plan of each municipality, which may have resulted in new designation of existing members as
Fig. 4 Relation between farmers participation rate and rate of entities that had members mainly engaged in farming
Source : Survey on CBFC, MAFF (2006, 2007, 2008).
certified farmers. Another possible reason is participa-tion in CBFC of certified farmers with less than 4 hectares of farmland who wanted to benefit from the FISP.
People in general would likely think that the larger the number of certified and other core actors participating in a CBFC, the larger the area of farmland consolidated by the entity. However, Fig. 5 indicates that there are two different tendencies especially among new entities. Newly established entities in Kanto-Tosan, Tohoku, Kyushu, and Tokai had higher percentages of entities that included certified farmers and larger areas of farm-land consolidated per entity (the average percentage of entities that included certified farmers in the four regions was 87.9 percent ; the average area of farmland consolidated was 47.1 hectares) (Group 1). However, areas of farmland consolidated by entities in Hokuriku, Chugoku, Kinki and Shikoku were far smaller than by those in the former four regions (the average percentage of entities that included certified farmers in the latter three regions was 78.0 percent ; the average area of farmland consolidated by an entity was 16.1 hectares) (Group 2).
The former four regions were almost in line with the tendency for entities with three-year consecutive data. Some of the new entities in these regions are considered to have undergone a merger to cover larger areas, and a
substantial proportion of new entities in these regions may have been aimed at receiving grants simply by putting together individual farming operations. In contrast, the areas of farmland consolidated by entities in the latter three regions were mostly smaller. In Hokuriku, this may be because farmers in areas suitable for operation of CBFC had already established such entities before the introduction of the FISP and new entities formed in response to the program tended to cater to conditions in areas that were relatively less suitable for farming. In Chugoku and Kinki, the smaller sizes of entire communities are thought to be related to the smaller areas of farmland consolidated.
As such, the percentage of new CBFC that included certified farmers tended to be considerably higher compared to entities with three-year consecutive data both in Kanto-Tosan, Tohoku, and other regions where the sizes of entities were larger and in Hokuriku, Chugoku, and Kinki, which had smaller sizes of entities. However, regional differences can be confirmed from the viewpoint of areas of farmland consolidated.
Observations and Conclusion
This report has analyzed the latest trends in CBFC before and after the introduction of the FISP using data from the MAFF Survey on CBFC over three years. This has been done by identifying entities for which
Fig. 5 Relationship between the percentage of CBFC that include farmers and consolidated farmland area by such entities
Source : Survey on CBFC, MAFF (2006, 2007, 2008).
survey data existed for three consecutive years from 2006 to 2008 and comparing them with new entities indicated in the MAFF statistics. The author believes this method was quite effective in analyzing how CBFC evolved in the three years.
The analysis found regional differences in terms of the rates of farmland consolidated by CBFC out of the total farmland in each community. In Kinki, Hokuriku, and Chugoku-Shikoku, where traditionally many CBFC had been set up, entities with three-year consecutive data covered larger farmlands than new entities. Conversely, in Kyushu, Tohoku, and Kanto-Tosan, where many CBFC were created to meet the requirements for the FISP, these new entities had higher rates of farmland consolidation than entities with three-year consecutive data.
Notably, the analysis has confirmed that in general many of the new CBFC as of 2007 or 2008 that have been examined in this report─although not all of them were completely new with no predecessor organizations ─ involved certified and other core actors as members and were established as large-scale entities with large areas of farmland consolidated under their control. However, major regional differences have been observed in this regard as well. In Tohoku, Kanto-Tosan, and Kyushu, probably because many of the new CBFC were entities similar to traditional farming associations or entities set up to receive grants by putting together core farmers, new entities in these regions were mostly larger in scale but had lower participation rates among farmers in the community. On the other hand, in Kinki and Chugoku, which have traditionally faced a shortage of core actors, statistical observations have found many new entities that included certified and other core actors to some ex-tent but not having high rates of farmland consolidation ─which can be described as relatively smaller versions of conventional CBFC.
As for future directions of CBFC, firstly, conventional unincorporated entities may maintain their core struc-tures that involve the entire community members and continue to play the role of managing local resources. However, some CBFC making earnest efforts to incorpo-rate themselves may consolidate their functions and evolve as management bodies in which specified opera-tors undertake farming activities.
In contrast, CBFC established in 2007 and 2008 in response to MAFF policies are, except for some that had substance, mostly considered to have been similar to traditional farming associations aimed only at change of crops or created to receive grants under the MAFF pro-gram. Discussions are still continuing on whether such government policy-induced entities can develop as
man-agement bodies. Based on the current status, it is diffi-cult to say they are likely to do so in the short term. In the medium to long term, however, it seems that these government policy-induced entities have not only disadvantages but also advantages : they are likely to be less constrained by various ties within the community than conventional entities, for example. It is fair to say whether such newly established entities can develop as management bodies depends on the capabilities of their current leaders and the extent to which these entities can secure the next-generation core actors who are now in their 50s or 60s. If these entities can incorporate a system to secure the next generation core actors smoothly, they may be able to compete with conventional CBFC in efforts to stabilize management of farm operations. Some examples of these efforts have already been observed. State assistance should never be assistance to eutha-nize farming operations. In this regard, it is worth noting how steadily efforts will be made in such areas as incorporation of new entities as well as of conventional CBFC that have substance to a certain degree. Depending on the amount of progress made in such efforts, new discussions will probably arise among policymakers on whether assistance for developing systems for CBFC should be enhanced. In addition, the analysis on this research will be the primary source for the support on the consideration for the development of the entities maintenance.
This analysis of data from the MAFF Survey on CBFC has clearly indicated the extent of impacts from the implementation of the MAFF FISP. The analysis also elucidated that the FISP has, unexpectedly, resulted in the creation of CBFC that are quite different from the conventional image of such entities. The author will discuss in other research how government policy-induced entities will develop communities while concurrently solving its current problem and communities being activated and revitalized.
Notes
1) CBFC for which MAFF survey data existed for three consecutive years were identified based on the name, the name of the representative, and the address of each entity. Individual data from the MAFF survey were integrated by hand when they included identical data on all of the above three items or they were considered to belong to the same entity with high probability because of one of the following reasons :
a. The data included the same representative name and address although part of the entity name had been changed (for example, from “X Farming Association” to “X Community Farming”).
b. The data included the same entity name and address although the representative’s name had been changed.
c. The data included the same entity name and represen-tative name although the address had been changed within the same district.
d. The circumstances are considered to be similar to those in a, b, or c above.
Some of the entities identified as having three-year consecutive data through the above process had been classified as new entities in the MAFF statistics (71 cases in the 2007 survey and 61 cases in the 2008 survey). Although consecutive data effectively existed in these 132 cases, these entities were likely to have experienced some kind of reorganization in terms of their formats. Therefore, these entities were not treated as entities with three-year consecutive data.
2) It cannot be said that all entities identified as having three-year consecutive data in the above matching pro-cess escaped any organizational changes. As stated in the criteria in 1) above, these entities include those that had seen minor changes to entity names, changes of represen-tatives, etc.
3) It is difficult to determine that new entities as of 2007 or 2008 were established as completely new entities with no predecessor organizations. Specifically, some CBFC may have been developed from groups similar to traditional farming associations aimed at facilitating the switching from rice to other crops. There are probably different opinions on whether such entities can be described as having no predecessor organizations.
4) This report assumes that no entities were counted as new in 2007 and in 2008 at the same time, although it cannot be precisely determined whether this assumption is true without carrying out the matching of data concerning new entities as of 2007.
5) It is possible that entities established in 2007 underwent some kind of organizational changes in 2008. But this report does not take into consideration such cases that are regarded as rare.
6) The reasons why the Chugoku and Shikoku regions had many incorporated entities may include Hiroshima Prefecture’s policy of establishing all CBFC as incorporated entities and incorporation in Shimane and Kagawa Prefec-tures of smaller entities that were unable to meet the size requirement.
7) In Fig. 4, the vertical axis represents the percentage of entities that had members mainly engaged in farming. But some observers have pointed out that the number of members mainly engaged in farming in each CBFC is based on prospective data shown on application forms for the FISP or other documents. The author is aware of this,
and does not necessarily consider that the data reflect the true status precisely. A similar indicator is the number of certified farmers in a CBFC, but this includes certified farmers engaged in production of crops other than paddy rice. Therefore, the number of certified farmers cannot be considered to indicate the number of potential operators either. Based on the above, Fig. 4 uses data based on the numbers of members mainly engaged in farming as a second-best indicator.
8) The analyses on Fig. 4 and 5 did not refer to Shikoku because its data show moves that are isolated from those of CBFC in general. This is because of the creation of farming organizations at each branch of the local agricul-tural cooperative in line with Kagawa Prefecture’s policy.
Bibliography
[1]Arai, S. (2011). “Reorganization of CBFC encouraged by
income stabilization program for farmers.” Reorganization of CBFC and core actors in paddy rice farming. Tsukuba-shobo. 23-48.
[2]Ando, M. et al. (2006). Aiming for sustainable development
of community-based farm cooperatives : How to operate entities after the creation. National Chamber of Agriculture. [3]Umemoto, M. (2008). Development and strategy for paddy
field farming under the turning points on policy, technology and market conditions. Agricultural research series. 60. [4]KatSura, A. (2006). Village group farming and agricultural
management policy. Japanese journal of farm manage-ment. 43-4 : 28-29.
[5]Sakai, T. (2008). Exploring directions for next generation
CBFC. Local farming and agricultural cooperatives. 38-2 : 6.
[6]Nagahama, K. (2008). “Local resource management and
structural problems from a viewpoint of agricultural poli-cies : Focusing on examples from the Tohoku region”. Structural problems in agriculture and roles of the state ; A new vision for research in structural problems in agri-culture. Challenges in today’s agriagri-culture. 4 : Tsukuba-shobo.
[7]Research team on income stabilization project, PRI-MAFF (2008). “Impacts on local agriculture, consolidation of farmland use, etc. from establishment of agricultural management organizations under income stabilization policy, etc”. PRIMAFF review. 28.
[8]Research team on income stabilization project, PRI-MAFF (2009). “Analytical report on CBFC under income stabiliza-tion policy for paddy and upland farming” Research report on income stabilization project 4 : 15-33.