Citation
沖縄県立看護大学紀要 = Journal of Okinawa Prefectural
College of Nursing(3): 57-69
Issue Date
2002-03
URL
http://hdl.handle.net/20.500.12001/5061
Joint intakes of milk, meat and fish and mortality from
the six-prefecture cohort study (1966-1981) in Japan
Kinjo Yoshihide, D.H.S.U Akiba Suminori, M.D.,Ph.D.2)
BACKGROUND: From prior analyses on dietary data from the six-prefecture cohort in Japaa we found a possible protective effect of milk, meat and fish for cerebrovascular disease mortality from 1966 to 1981. However, this protective effect had not been examined for cancer and other causes of death.
OBJECTIVES: The purpose of the present analysis is to further elucidate the associations between the joint intakes of dairy milk, meat and fish as main sources of animal protein and fat and the main causes of death in the subjects of the six-prefecture cohort study.
METHODS: The subjects for this analysis were 225,019 men and women aged 40 to 69 at the baseline in December 1965, with neither prior disease history of cancer nor other diseases except for chronic stomach dis ease. There were 23,108 deaths for men and 16,785 deaths for women during the study period To evaluate the joint intakes of dairy milk, meat and fish (DMF), data were re-categorized into binary data. For example,
DMF (D, M, F) means the combination of dairy milk (1-3 times/week or more), meat (1-3 times/week or more)
and fish (4 times/week or more). Thus DMF (d, m, f) was the reference group having dairy milk (less than 1 time/week), meat (less than 1 time/week) and fish (less than 4 times/week). Rate ratio (RR) adjusted for attained age, sex, prefecture, occupation, alcohol drinking, cigarette smoking and DMF was used for comparisoa
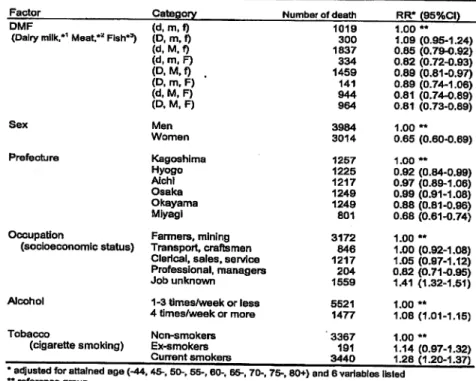
RESULTS: A weak joint effect on all cancer mortality was observed in DMF (D, M, F) (RR: 1.09, 95%CI: 1.00-1.17), although no statistically significant effect was found in cancer of the colon, rectum, breast, prostate, stom ach, lung, oesophagus, gall bladder, liver, pancreas, cervix-uteri and urinary bladder. Neither all respiratory disease nor all external causes of death showed significant association between DMF and mortality* On the other hand, possible protective effects in DMF (D, M, F) were observed for the mortalities of all causes of death
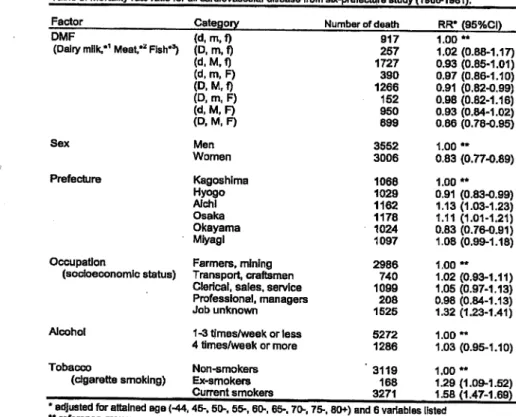
(RR=0.85, 95%CI: 0.81-0.88), all cerebrovascular diseases (RR=0.68, 95%Ct 0.62-0.73), all cardiovascular disease
(RR=0.86, 95%CI: 0.78-0.95) and all other causes of death (RR=0.83, 95%CI: 0.73-0.89).
CONCLUSION: The present analysis indicates that animal protein and fat was not strongly associated with cancer mortality. On the other hand, relatively high animal protein and fat intake, although much lower than that in the western countries, may have helped to reduce mortality from vascular disease in this cohort
Key word: milk, meat, fish, mortality, dietary habits, cohort study
INTRODUCTION
In Japan, the Ministry of Health and Welfare has conducted an annual nutritional survey, the National Survey, since 1947. The survey is the
most important source of information on the nutri
tional status of the Japanese, including average per capita daily intake of major nutrients and foods.
After the second world war, the Japanese experi
enced dramatic changes in their dietary habits.
The most increased, among other things, was milk consumption, followed by meat oil, fat and fruit,
1) Okinawa Prefectural College of Nursing,
2) Department of Public Health, Kagoshima University Faculty of Medicine, Kagoshima, Japan
while the intake of rice gradually decreased1} Also
changed in the post World War n era of Japan was
cause-specific mortality. After the second world war, infectious diseases such as tuberculosis mark
edly decreased Afterwards, apoplexy began to de
crease whereas chronic diseases related to
westernized lifestyle rapidly increased Thus, the leading cause of death in Japan changed from tu
berculosis to cerebrovascular attack in the 1960s,
and later, in 1981, malignant neoplasms became the leading cause of death.50 Those changes in causes
of death resulted in the longer life expectancy.
During the period from 1965 to 1995, the life expec tancy increased from 67 to 72 years old and from
76 to 82 years old in men and women,
respectively.3*
The Six-Prefecture Cohort Study conducted by late Dr Hirayama was the largest prospective co hort study in Japan. This study selected six pre fectures from northern to southern prefectures in Japan, and collected data on dietary habits and other factors from over two hundred fifty thou sand residents. The most important product from this study was the dose-response relationship be tween passive smoking and lung cancer mortality. 4> Epidemiological findings from the six-prefecture cohort study have also contributed to the cancer prevention on dietary habits including smoking and alcohol drinking.5) The notion that they were avoidable risks was strongly supported by other studies.6~8) From further analyses on dietary data of the six-prefecture cohort in Japan, we have found a possible protective effect of milk, meat and fish for cerebrovascular disease mortal ity from 1966 to 1981.9) However, that protective effect had not been examined for cancer and other main causes of death. The purpose of the present analysis is to further elucidate the associations be tween the joint intakes of milk, meat and fish as main sources of animal protein and fat and mortal ity in the subjects of the six-prefecture cohort
study.
MATERIALS AND METHODS
Profile of cohort
A cohort of 265,070 residents, aged 40 or over, from 29 public health districts in six prefectures
(Kagoshima, Okayama, Hyogo, Osaka, Aichi and
Miyagi) was followed-up from 1966 to 1981 by late Dr. Hirayama and his colleagues.5) A one-page Questionnaire used in the baseline survey included questions about occupation, cigarette smoking, al cohol drinking, tea drinking, and other dietary fac tors (rice, miso soup, green-yellow vegetables, pickles, meat, fish and dairy milk). At the begin ning of each follow-up year, a migration survey was conducted through reference to the local resi dence registration. During the follow-up period, the deaths were annually ascertained by thorough-checking against death certificates kept at each public health center. The causes of deaths were
coded by Dr. Hirayama according to the 7th revi sion of the International Classification of Disease (ICD-7). The study method, age and sex distribu tion of the cohort have been reported else where Sil0).
In the present analysis, sex, prefecture, at tained age, occupation, smoking and alcohol drink ing were treated as potential confounding factors. Occupation was classified into the following 5 cate gories taking into account average years of school ing: (1) farmers, lumbermen, fishermen, and workers in mining and Quarrying, (2) workers in transport and communication, craftsmen, produc tion process workers and labourers (3) clerical and related workers, sales workers, and service workers, (4) professional and technical workers, managers and officials, (5) job unknown including in housewives. These categories can be consid ered as one of surrogates for socioeconomic
status.5)
Cigarette smoking was categorized into the three categories, Le., non-smokers (never smoked), ex-smokers, and current smokers (a cigarette per day or more). Alcohol drinking was divided to two categories, i.e., not-daily drinkers (1-3 times/-week or less) and daily drinkers (4 times/day or more). To examine the joint effect of animal pro tein and fat, dairy milk, meat and fish (DMF) were combined For example, DMF (D, M, F) means the combination of dairy milk (1-3 times/week or more), meat (1-3 times/week or more), and fish (4 times/week or more). Thus DMF (d, m, f) was the reference group, which was for dairy milk (less than 1 time/week), meat (less than 1 time/week), and fish (less than 4 times/week).
Analysis of prior disease history at the base line showed that the mortality rate of all causes of death among the subjects with cancer or other dis ease except for chronic stomach disease at recruit ment was higher than that among those with no prior disease history at recruitment However, this mortality among the subjects with prior disease
history of stomach disease was not significantly
different from that among those with no prior dis ease. Therefore, the following cohort members were excluded from the present analysis on the
58
basis of the information at the baseline: (1) those
with a history of cancer and other diseases except for chronic stomach diseases (n=7,612), (2) those aged 70 years or older (n=4,490), and (3) those who had missing information on dietary habits and smoking (n=27,949). After this exclusion, a total of 225,019 cohort members remained for analysis. Statistical procedure
The person-years and the numbers of deaths were aggregated and stratified by attained age (-44, 45-, 50-, 55-, 60-, 65-, 70-, 75-, 80+), prefecture, oc cupation, cigarette smoking, and other dietary fac
tors using DATAB computer program.10
Thereafter, AMFIT regression program was used for survival analysis with Poisson regression modeL12) The rate ratio (RR) and its 95 % confi
dence interval (95%CI) were also estimated by the
method of maximum likelihood. A more detailed description of the statistical methods is available
elsewhere.10- 12)
RESULTS
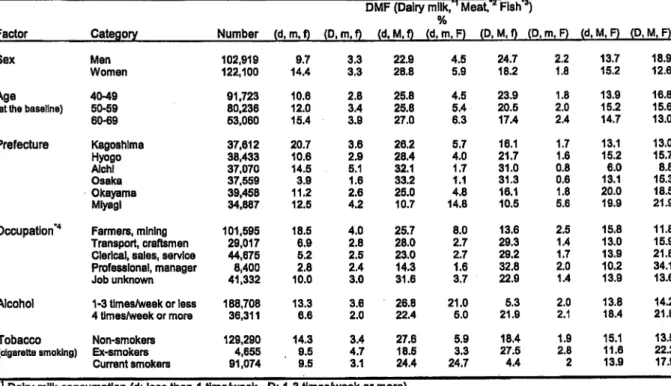
Distribution of sex, age, prefecture, occupation, alcohol and tobacco were shown in Table 1 ac cording to the combination of dairy milk, meat and fish consumption (DMF). The proportion of DMF (D, M, F) was slightly higher among men, and de creased with the advancement of age at the base
line. The proportion of DMF (d, m, f) was more prevalent in Kagoshima (20.7%) than in Osaka (3.9%). The proportion of DMF (d, m, F) was the
highest in Miyagi prefecture (14.8%). The propor tion of DMF (D, M, F) was higher in professionals and managerial workers (34.1%) than in other job groups, suggesting the relationship between die tary habits" and socioeconomic status. Frequencies of alcohol and tobacco were associated with the proportion of DMF (D, M, F). Thus, current smok
ers or daily drinkers (4 times/week or more)
tended to consume milk, meat and fish frequently. Table 2 gives the result for all causes of death. There were 39,893 deaths in the cohort during the
period from January 1966 to December 1981.
Table 1. Distribution of sex, age, prefecture, occupation, alcohol and tobacco by combination of dairy milk, meat and fish intake among the subjects from the six-prefecture study in Japan (1966-1981).
DMF (Dairy milk,"1 Meat.'* Fish"*)
%
Factor Category Number (d.m.f) (D.m.f) (d.M.f) (d.m.F) (D,M,f) (D.m.F) (d,M,F) (D.M.F) Sex
Age (at the baseline)
Prefecture Occupation"4 Alcohol Tobacco (cigarette smoking) Men Women 40-49 50-59 60-69 Kagoshima Hyogo AJchl Osaka Okayama Miyagi Farmers, mining Transport, craftsmen Clerical, sales, service Professional, manager Job unknown 1-3 times/weak or less 4 times/week or more Non-smokers Ex-smokers Current smokers 102,919 122,100 91,723 80,236 53,060 37,612 38,433 37.070 37.559 39,458 34,887 101,595 29,017 44,675 8,400 41,332 188,708 36,311 129,290 4,655 91,074 9.7 14.4 10.6 12.0 15,4 20.7 10.6 14.5 3.9 11.2 12.5 18.5 6.9 5.2 2.8 10.0 13.3 6.6 14.3 9.5 9.5 3.3 3.3 2.8 3.4 3.9 3.6 2.9 5.1 1.6 2.6 4.2 4.0 2.8 2.5 2.4 3.0 3.6 2.0 3.4 4.7 3.1 22.9 28.8 25.8 25.8 27.0 26.2 28.4 32.1 33.2 25.0 10.7 25.7 28.0 23.0 14.3 31.6 26.8 22.4 27.6 18.5 24.4 4.5 5.9 4.5 5.4 6.3 5.7 4.0 1.7 1.1 4.8 14.8 8.0 2.7 2.7 1.6 3.7 21.0 5.0 5.9 3.3 24.7 24.7 18.2 23.9 20.5 17.4 16.1 21.7 31.0 31.3 16.1 10.5 13.6 29.3 29.2 32.8 22.9 5.3 21.9 18.4 27.5 4.4 2.2 1.8 1.8 2.0 2.4 1.7 1.6 0.8 0.6 1.8 5.6 2.5 1,4 1.7 2.0 1.4 2.0 2.1 1.9 2.8 2 13.7 15.2 13.9 15.2 14.7 13,1 15.2 6.0 13.1 20.0 19.9 15.8 13.0 13.9 10.2 13.9 13.8 18.4 15.1 11.6 13.9 18.9 12.6 16.8 15.6 13.0 13.0 15.7 8.8 15.3 18.5 21.9 11.8 15.9 21.8 34.1 13.6 14.2 21.8 13.5 22.2 17.9
"1 Dairy milk consumption (d: less than 1 time/week, D: 1-3 times/week or more)
#2 Meat consumption (m: less than 1 time/week, M: 1-3 times/week or more) '3 Fish consumption (f: less than 4 times/week, F: 4 times/week or more) *4 see text in detail
Person-years at risk were 3,140,966 in total, 1,393,344 for men, and 1,747,622 for women. Respective RRs were mutually adjusted for at tained age and six variables listed in this table. This type of calculation was applied for other causes of death presented in the subsequent tables. For all causes of deaths, significant associations were observed in the DMF ((d, M, f), (d, m, F), (D, M, f), (d, M, F), (D, M, F)), sex, and occupation (ex cept for job unknown). The RR for DMF (D, M, F) was 0.85 with 95%CI of 0.81 to 0.88 compared to DMF (d, m, f) as a reference group. The RR for women was 0.65 with 95%CI of 0.63 to 0.67 com pared to men. When compared to Kagoshima pre fecture, mortalities in Aichi and Osaka prefectures were significantly higher, and Hyogo and Okayama prefectures were significantly lower. The professionals and managerial workers had the lowest RR when compared to farmers (RR=0.80, 95%CI: 0.75-0.85). Mortality risks were statistically significant among the ex-smokers (RR=L17, 95%CI: 1.09-1.24) and current smokers (RR=L30, 95%CI:
1.26-1.34). In alcohol, daily drinkers (RR=1.14, 95%CI: 1.10-1.17) were slightly higher risk than the
non-daily drinkers.
Table 3 gives the result for all cancer. Statistically significant risks were observed in the DMF combinations of (d, M, f), (d, M, F), and (D, M, F). In tobacco, the RR for current smokers was 1.50 with 95%CI of 1.42 to 1.58 compared to non-smokers. Alcohol was also associated with this mortality (daily drinkers, RR=1.12, 95%CI: 1.06-1.17).
The DMF was strongly associated with all cerebrovascular diseases (Table 4). In comparison with DMF (d, m, f), a statistically significant RR was observed in all combinations except for DMF (D, m, f). Thus, the RR for DMF (D, M, F) was 0.68 with 95% CI of 0.62 to 0.73. On the contrary to that alcohol (daily drinkers, RR=1.26, 95%Ct 1.19-1.32) and tobacco (current smokers, RR=1.10, 95%CI: 1.04-1.16) were adverse risk factors for this mortal ity. When compared to farmers, other job groups showed lower mortality rates of cerebrovascular disease. An exception was no-job group, having
Table 2. Mortality rate ratio for all causes of death from six-prefecture cohort (1966-1981*.
Factor DMF
(Dairy milk,*1 Meat,** Fish*3)
Sex Prefecture Occupation (socloeconomrc status) Alcohol Tobacco (cigarette smoking) Category (d,m,f) (D. m, f) (d. M, f) (d, m, F) (D,M,f) (D, m, F) (d, M, F) <D, M, F) Men Women Kagoshima Hyogo Aichi Osaka Okayama Mlyagi Farmers, mining Transport, craftsmen Clerical, sales, service Professional, managers Job unknown 1-3 times/week or less 4 times/week or more Non-smokers Ex-smokers Current smokers Number of death 5516 1552 10546 2228 7785 901 5803 5560 23108 16785 6565 6516 6948 6735 6843 6286 , 19093 4773 6652 1167 8208 31142 8751 18877 1071 19945 RR* (95%CI) 1.00 •• 1.02(0.96-1.08) 0.94 (0.90-0.97) 0.93 (0.87-0.97) 0.90 (0.87-0.94) 0.95 (0.88-1.02) 0.91 (0.87-0.95) 0.85 (0.81-0.88) 1.00 *• 0.65 (0.63-0.67) 1.00 *• 0.95 (0.92-0.99) 1.11 (1.07-1.15) 1.07 (1.02-1.11) 0.92 (0.89-0.96) 1.03 (0.99-1.07) 1.00 " 0.95 (0.91-0.98) 0.96 (0.93-0.99) 0.80 (0.75-0.85) 1.24 (1.20-1.27) 1.00 •• 1.14 (1.10-1.17) 1.00 ** 1.17 (1.09-1.24) —§ —._.._.,,„«. «»£,,, ^ -r-T, -rwi ww, %**r-, ww, us*-,I v*-,19*, wT/ ana O VaficlDI
** reference group
*1 Dairy milk consumption (d: less than 1 time/week, D: 1-3 times/Week or more) •2 Meat consumption (m: less than 1 time/week, M: 1-3 times/week or more) *3 Fish consumption (f: less than 4 times/week. F: 4 times/week or more)
Table 3. Mortality rate ratio for all cancer from six-prefecture study (1966-1981). Factor
DMF
(Dairy milk,*1 Meat,*2 Fish*3)
Sex Prefecture Occupation (socloeconomic status) Alcohol Tobacco (cigarette smoking) Category (d,m,f) (D, m. f) <d.M,f) (d,m,F) <D,Mff) <D,m,F) (d, M. F) (D.M.F) Men Women Kagoshima Hyogo Aichl Osaka Okayama Miyagl Farmers, mining Transport, craftsmen
Clerical, sales, service
Professional, managers Job unknown 1-3 times/week or less 4 times/week or more Non-smokers Ex-smokers Current smokers Number of death 1270 387 2885 574 2247 246 1651 1745 6616 4389 1660 1832 1944 2044 1794 1731 5192 1495 2060 368 1890 8468 2537 4782 273 5950 RR* (95%CI) 1.00 ** 1.09 (0.96-1.22) 1.07 (1.00-1.14) 1.02 (0.91-1.12) 1.04 (0.97-1.12) 1.11 (0.96-1.27) 1.08 (1.00-1.16) 1.09 (1.00-1.17) 1.00** 0.71 (0.67-0.75) 1.00** 1.06 (0.98-1.13) 1.22(1.14-1.31) 156 (1.17-1.35) 0.94 (0.87-1.01) 1.11 (1.03-1.19) 1.00** 0.96 (0.90-1.02) 0.97 (0.92-1.03) 0.83 (0.74-0.92) 1.01 (0.95-1.07) 100 ** 1.12 (1.06-1.17) 1.00** 121 (1.06-1.37) 1.50 (1.42-1.58) * adjusted for attained age (-44,45-, 50-, 55-, 60-, 65-, 70-, 75-, 80+) and 6 variables listed
** reference group
*1 Dairy milk consumption (d: less than 1 time/week, D: 1-3 times/Week or more) *2 Meat consumption (m: less than 1 time/Week, M: 1-3 times/week or more) *3 Fish consumption (f: less than 4 times/week, F: 4 times/week or more)
Table 4. Mortality rate ratio for all cerebrovascuiar disease from six-prefecture study (1966-1981).
Factor DMF
(Dairy milk,*1 Meat,*2 Fish*8)
Sex Prefecture Occupation (socioeconomic status) Alcohol Tobacco (cigarette smoking) Category (d, m, f) (D, m, f) (d,M,f) (d, m. F) (D,M,f) (D,m,F) (d, M. F) (D, M, F) Men Women Kagoshima Hyogo Aichi Osaka Okayama Miyagi Farmers, mining Transport, craftsmen Clerical, sales, service Professional, managers Job unknown 1-3 times/week or less 4 times/week or more Non-smokers Ex-smokers Current smokers Number of death 1730 429 3057 717 1931 260 167B 1324 6231 4895 1806 1704 1919 1605 2026 2066 5679 1166 1610 273 2398 6685 2441 5714 294 5118 RR* (95%CI) 1.00** 0.91 (0.81-1.01) 0.92 (0.86-0.98) 0.89 (0.81-0.97) 0.79 (0.73-0.84) 0.84 (0.73-0.96) 0.85 (0.79-0.92) 0.68 (0.62-0.73) 1.00** 0.63 (0.59-0.67) 1.00** 0.94 (0.87-1.00) 1.16 (1.08-1.24) 0.98 (0.91-1.06) 1.02(0.95-1.09) 1.28 (1.20-1.37) 1.00** 0.88 (0.82-0.95) 0.88 (0.82-0.93) 0.72 (0.64-0.82) 1.26 (1.19-1.32) 1.00** 1.26 (1.19-1.32) 1.00** 1.06(0.93-1.20) 1.10 (1.04-1.16)
* adjusted for attained age (-44,45-, 50-, 55-, 60-, 65-, 70-, 75-, 60+} and 6 variables listed ** reference group
*1 Dairy milk consumption (d: less than 1 time/week, D: 1-3 times/week or more)
*2 Meat consumption (m: less than 1 time/Week, M: 1-3 times/Week or more)
"3 Fish consumption (f: less than 4 times/week. F: 4 times/week or more)
61
the RR of 1.26.
The DMF as a protective factor was also found in all cardiovascular disease, although it was
not more evident than all cerebrovascular diseases
(Table 5). Tobacco was associated with the mor
tality of this disease (current smokers* RR=1.58, 95%CI: 1.47-1.69), but alcohol was not significant.
The mortality of all respiratory disease was modified by sex and area (Table 6). Mortality rate of respiratory disease was much higher in men than in women. The high mortality in kagoshima prefecture might be related to air pollution by vol cano activity. Respiratory disease mortality among workers with unknown job was higher than that among the rest of the cohort members (RR=1.86, 95%CI: 1.65-2.09). The RR from ex-smokers was higher than that from current smok ers (ex-smokers, RR=1.63, 95%CI: 1.31-2.03). Both alcohol and DMF were not associated with this
mortality.
Table 7 shows that the results for mortality of external cause. The DMF did not show any sig
nificant associations except for DMF (D, M, f).
Area difference was also small. Alcohol, but not tobacco, was adversely associated with mortality from this cause of death. The RR among profes sionals and managerial workers was 0.50 with 95%CI of 0.37 to 0.67.
Table 8 shows the results for all other causes of death A statistically significant RR was also observed in several combinations of DMF, Le., (d M, f), (4 m, F), (D, M, f), (d, M, F) and (D, M, F). The mortality rate in Miyagi prefecture was lower than that in other prefectures (RR=0.68, 95%CI: 0.61-0.74). On the contrary, alcohol and tobacco were
risk factors.
Figures 1 to 3 show the RR by the DMF com binations for the cancer sites of colon, rectum, breast, prostate, stomach and lung. The mortality risks of these cancer sites were not associated with the DMF combinations. No associations were also obtained from the oesophagus, gall bladder, liver, pancreas, cervix-uterus and urinary bladder (data not shown).
Table 5. Mortality rate ratio for all cardiovascular disease from six-prefecture study (1966-1981).
Factor Category Number of death RR* (95%Cl)
DMF
(Dairy milk,*1 Meat,*2 Fish*3)
Sex Prefecture Occupation (sotfoeconomic status) Alcohol Tobacco (cigarette smoking) <d,m,f) <D,m,f) (d, M, f) (d, m, F) <D. M, f) (D, m, F) (d, M, F) (D, M, F) Men Women Kagoshima Hyogo Afchl Osaka Okayama Miyagi Farmers, mining Transport, craftsmen
Clerical, sales, service Professional, managers Job unknown 1-3 times/week or less 4 times/week or more Non-smokers Ex-smokers Current smokers 917 257 1727 390 1266 162 950 699 3552 3006 1068 1029 1162 1178 1024 1097 2986 740 1099 208 1525 5272 1286 3119 168 3271 1.00** 1.02(0.88-1.17) 0.93 (0.85-1.01) 0.97 (0.86-1.10) 0.91 (0.82-0.99) 0.98 (0.82-116) 0.93 (0.84-1.02) 0.86 (0.78-0.95) 1.00 ** 0.83 (0.77-0.89) 1.00 ** 0.91 (0.83-0.99) 1.13(1.03-1.23) 1.11 (1.01-1.21) 0.83 (0.76-0.91) 1.08(0.99-1.18) 100" 1.02 (0.93-111) 1.05 (0.97-113) 0.98 (0.84-113) 132 (1.23-141) 1.00** 1.03 (0.95-110) 100 ** 129(109-152) 158 (147-169)
* adjusted for attained age (-44,45-, 50*. 55-, 60-, 65-. 70-, 75-, 80+) and 6 variables listed
** reference group
•1 Dairy milk consumption (d: less than 1 timetoeek, D: 1-3 times/week or more) •2 Meat consumption (m: less than 1 time/week. M: 1-3 times/week or more) *3 Fish consumption (f: less than 4 times/week, F: 4 times/Week or more)
Table 6. Mortality rate ratio for all respiratory disease from six-prefecture study (1966-1981).
Factor DMF
(Dairy milk,*1 Meat.^ Fish*3)
Sex Prefecture Occupation (socioeconomic status) Alcohol Tobacco (cigarette smoking) Category (d.m,1) (D, m, f) (d.M,f) (d, m, F) (D.M.f) (D, m, F) (d, M, F) (D, M, F) Men Women Kagoshlma Hyogo Aichl Osaka Okayama Miyagi Farmers, mining Transport, craftsmen Clerical, sales, service Professional, managers Job unknown 1-3 times/week or iess 4 times/week or more Non-smokers Ex-smokers Current smokers Number of death 305 101 493 111 504 52 281 323 1413 757 441 326 356 359 365 323 1006 236 315 67 546 1709 461 ' 955 100 1115 RR* (95%CI) 1.00** 1.19(0.95-1.49) 0.62 (0.70-0.95) 0.B7 (0.69-1.09) 1.09 (0.93-1.26) 1.01 (0.74-1.36) 0.84 (0.71-1.00) 0.92 (0.77-1.08) 1.00** 0.39 (0.34-0.44) 1.00** 0.67 (0.57-0.77) 0.78 (0.67-0.90) 0.77 (0.66-0.89) 0.72 (0.62-0.83) 0.73 (0.63-0.85) 1.00** 0.89 (0.76-1.03) 0.91 (0.79-1.04) 0.78 (0.60-1.01) 1.86(1.65-2.09) 1.00** 0.93 (0.83-1.04) 1.00** 1.63 (1.31-2.03) 1.20 (1.07-1.34)
* adjusted for attained age (-44,45-. 50-, 55-, 60-, 65-, 70-, 75-, 80+) and 6 variables iisted ** reference group
*1 Dairy rnilk consumption (d: less than 1 time/week. D: 1-3 times/week or more)
*2 Meat consumption (m: less than 1 time/week, M: 1-3 times/week or more) *3 Fish consumption (f: less than 4 times/week, F: 4 times/week or more)
Table 7. Mortality rate ratio for ail external causes of death from six-prefecture study (1966-1981).
Factor
DMF
(Dairy milk*1 Meat,*" Fish*3)
Sex Prefecture Occupation (socioeconomic status) Alcohol Tobacco (cigarette smoking) Category (d, m, f) (D, m, f) (d, M, f) (d. m. F) (D, M, f) (D, mt F) (d, M, F) (D, M, F) Men Women Kagoshima Hyogo Aichi Osaka Okayama Miyagi Farmers, mining Transport, craftsmen Clerical, sales, service Professional, managers Job unknown 1-3 times/week or less 4 times/week or more Non-smokers Ex-smokers Current smokers Number of death 277 78 547 102 378 50 299 305 1312 724 333 400 350 300 385 268 1058 290 351 47 290 1487 549 940 45 1051 RR* (95%CI) 1.00 ** 1.03 (0.79-1.32) 0.93(0.80-1.08) 0.86(0.68-1.08) 0.80 (0.68-0.94) 1.07 (0.78-1.45) 0.88 (0.74-1.04) 0.65 (0.72-1.01) 1.00 ** 0.45 (0.39-0.51) 1.00** 1.22 (1.04-1.41) 1.15 (0.98-1.34) 1.03(0.87-1.22) 1.08(0.93-1.25) 0.87 (0.73-1.03) 1.00 ** 0.85 (0.73-0.97) 0.81 (0.71-0.92) 0.50 (0.37-0.67) 0.95 (0.82-1.09) 1.00** 1.40 (1.25-1.57) 1.00 ** 0.76 (0.55-1.04) 0.94 (0.83-1.06) * adjusted for attained age (-44.45-. 50-, 55-. 60-. 65-, 70-, 75-, 80+) and 6 variables listed
** reference group
*1 Dairy milk consumption (d: less than 1 time/week, D: 1-3 times/week or more) *2 Meat consumption (m: less than 1 time/week. M: 1-3 times/week or more) *3 Fish consumption (f: less than 4 times/week, F: 4 times/week or more)
63
Table 8. Mortality rate ratio for all other causes of death from six-prefecture study H 966-1981).
Factor
DMF
(Dairy milk,*1 Meat.*2 Fish**5)
Sex Prefecture Occupation (socioeconomic status) Alcohol Tobacco (cigarette smoking) Category (d, m, f) (D, m. f) (d, M, f) (d, m( F) (D, M, f) <D,m,F) (d, M, F) (D, M, F) Men Women Kagoshima Hyogo Aichl Osaka Okayama Miyagi Farmers, mining Transport, craftsmen Clerical, sales, service Professional, managers Job unknown 1-3 times/week or less 4 times/week or more Non-smokers Ex-smokers Current smokers Number of death 1019 300 1837 334 1459 141 944 964 3984 3014 1257 1225 1217 1249 1249 801 3172 646 1217 204 1559 5521 1477 3367 191 3440 RR* (95%CI> 1.00 ** 1.09 (0.95-1.24) 0.85 (0.79-0.92) 0.82 (0.72-0.93) 0.89 (0.81-0.97) 0.89 (0.74-1.06) 0.81 (0.74-0.89) 0.81 (0.73-0.89) 1.00** 0.65 (0.60-0.69) 1.00 •• 0.92 (0.84-0.99) 0.97 (0.89-1.06) 0.99(0.91-1.08) 0.88 (0.81-0.96) 0.68 (0.61-0.74) 1.00 ** 1.00 (0.92-1.08) 1.05 (0.97-1.12) 0.82 (0.71-0.95) 1.41 (1.32-1.51) 1.00 ** 1.08 (1.01-1.15) 1.00 ** 1.14 (0.97-1.32) 1.28 (1.20-1.37) ** reference group
*1 Dairy milk consumption (d: less than 1 time/Week, D: 1-3 times/week or more) *2 Meat consumption (m: less than 1 time/Week, M: 1-3 times/week or more)
*3 Fish consumption (f: less than 4 times/week, F: 4 times/week or more)
0.0
(d. m, f) (D, m, f) (dt M, f) (d, m, F) (D, M, 0 (D, m, F) (d, M, F) (D, M, F)
DMF(Dairy milk,*1 Meat,*2 Fish*3)
RR
0.5
0.0
000 100 010 001 110 101 011 111
(Mlk, Meat, Fish)
Figure 1. Mortality rate ratio (RR) by the combination of DMF for the cancer sites of colon and rectum
A square and a bar are corresponding to the RR and its 95% confidence interval, where DMF (d, m, f)
is reference group.
*1 Dairy milk consumption (ct less than 1 time/week, D: 1-3 times/week or more)
*2 Meat consumption (m: less than 1 time/week, M: 1-3 times/week or more)
*3 Fish consumption (f: less than 4 times/week, F: 4 times/week or more)
RR 5.0 4.0 ao ZO 1.0 0.0
Breast
000 100 010 001 110 101 011 111(Milk, Meat, Fish)
8.0 7.0 6.0 5.0 RR4.0 3.0 ZO 1.0
Prostate
—■—■ \ l
. i\ i
i i 0.0 I ' ' 1—l—i 1 1 1 1 000 100 010 001 110 101 011 111(Milk, Meat, Fish)
Figure 2. Mortality rate ratio (RR) by the corrbination of DMF for the cancer sites of breast and prostate. A square and a bar are correspondng to the RR and its 95% confidence interval, where DIVF (d, m, f)
is reference group.
*1 Dairy milk consumption (ck less than 1 time/week, D: 1-3 times/week or more) *2 Meat consumption (rrc less than 1 time/week, M: 1-3 times/week or more) *3 Fish consumption (f: less than 4 times/week, F: 4 times/week or more)
000 100 010 001 110 101 011 111
(Mlk, Meat, FisN)
I ill m
000 100 010 001 110 101 011 111
(Mlk, Meat, Fish)
Figure 3. MortaJity rate ratio (RR) by the combination of DMF for the cancer sites of stomach and lung. A square and a bar are corresponding to the RR and its 95% confidence interval, where DMF (d, m, f)
is reference group.
*1 Dairy milk consurption (d less than 1 time/week, D: 1-3 times/week or more) *2 Meat consurrption (rrt less than 1 time/week, M: 1-3 times/week or more) *3 Fish consumption (f: less than 4 times/week, F: 4 times/week or more)
DISCUSSION
Life-styles and dietary habits can vary with
time. In this cohort study, the second survey was
conducted for the randomly selected
sub-population of 3 % of the cohort in 1971, six years
after the initial survey. Comparison between the
results of two surveys showed good correlation and agreement185 Those results could be due to
the age at the baseline, mainly 40 or over, where
individual life-style would be stable. Possibly, the period between the two surveys, which was only 6 years, might be too short to examine the change
of life-style over years.
Over 90 percent of the cohort members con
sumed rice, vegetables including pickles, and miso soup 1-3 times/week or more. Thus, these were
popular dietary styles for the Japanese in the 1960s. Associations between respective food items
and cancer mortality risk were intensively exam ined and reported by Dr Hirayama5'13) In the pre
sent multivariate analysis, the joint effect of animal protein and fat from dairy milk, meat and
fish were targeted with adjustment for not only cigarette smoking but prefecture and occupation. Other dietary factors in this cohort did not signifi-cantly contribute to the risk estimation, which might be due to the fact that mortality risk was largely explained by age and cigarette smoking.
The present results, suggesting the inverse as sociation between mortalities from main causes of death except for all cancer and the joint effect of animal protein and fat are in line with the changes of leading causes of death in Japan over the years. It changed from cerebrovascular dis ease to malignant neoplasms in the last 50 years. Time trends of Japanese food consumption re ported by the National Nutritional Survey support the present findings to some extent. According to the survey, the increased animal protein and fat intake during the period from the 1960s to the 1980s may have contributed to the extension of life expectancy and the decreasing trend of cerebrovascular disease mortality starting from around 1965. Macroscopic analysis presented in this paper is useful for understanding the changes of mortality and food consumption nationwide.
The present study showed that cancer mortal ity was relatively lower within the dietary pattern of DMF ((d, m, f) and (d, m, F)). Contrary to that, the adverse joint effect of animal protein and fat
on cancer was only marginally significant. On top
of that, the present analysis could not confirm such an effect in cancer of the colon, rectum, breast or prostate (Figures 1 and 2) although those
cancers are considered to be related to animal fat
and their incidence rates in Japan gradually in creased since 1960. But the increase in animal fat consumption virtually stopped after 1974. Incidentally, 1973 was the year of the first oil em bargo crisis, which might have affected the in creasing trend of both breast and prostate cancer&13> Therefore, it might be an unexpected nationwide dietary intervention against these can cers. Recent trend analysis using WHO mortality
database over the past three decades suggests that the colorectal and prostate cancer mortality rates
in Japan may never reach rates similar to those of several western countries.14) Stomach cancer,
whose mortality steadily decreased during the last 20 years, has been the primary cause of cancer in both men and women until the lung cancer death
rate in men became the leading cause of cancer
death in 1993. This decline of stomach cancer risk in Japan may be due to the nationwide campaigns including an active public educatioa and the use of electric refrigerator, which contributed to the re duction of salty food intake and the increase of fresh fruit and vegetable consumption.110
It is well known that several aspects of the
traditional Japanese life-style such as heavy work, alcohol drinking and a largely plant-based diet with high salt intake are associated with a high in cidence of hypertension and cerebrovascular dis ease.16* In the previous analysis of the six-prefecture cohort data, the joint effect of animal
protein and fat from dairy milk, meat and fish was strongly associated with a reduction in mortality
from haemorrhagic stroke.9) This result is in line with the Ni-Hon-San study and recent meta-analysis of 13 cohorts.17'I8) In Japan, the success of a community-based hypertension control program in the early 1970s saw a reduction in salt intake from 13.7 g/day in 1976 to 11.7g/day in 1987.119) Although fat intake had increased with economic growth, the level of animal fat intake in Japanese is still lower than the levels in the US and European countries. This may explain why no large increase in the ischaemic heart disease mor tality has been seen alongside the decrease in stroke mortality in Japan.20> In the present analy sis, the DMF was related to cardiovascular disease in total but not to ischaemic heart disease only (re sults not shown).
Data obtained from the National Nutritional Survey in Japan showed the increased consump tion of green-yellow vegetables, milk and dairy to
present, stabilization in animal fat consumption
after 1974, and reduction of salt consumption until 1987. However, salt intake increased after 1987, and animal protein intake and fat consumption
increased slightly in the corresponding period Those trends may be related to increasing mortal ity rates of heart disease, colon and breast cancers. The possibility can be examined in depth by the
recent cohort studies in Japan.21*22)
In conclusion, the joint effect of animal protein and fat on the basis of the DMF combination was not strongly associated with the cancers in the present analysis. On the other hand, substantial rises in animal protein and fat intake may have had a protective role for mortality from vascular diseases in this cohort.
ACKNOWLEDGEMENT
The authors wish to express their sincere ap preciation to the late Dr. Takeshi Hirayama, who gave us the chance to analyze the six-prefecture cohort data. This study was supported in part by
a Grant-in-Aid for Cancer Research (8-1) by
Ministry of Health, Labor and Welfare, Japan
REFERENCES
1. Ministry of Health and Welfare of Japan, Division of Health and Nutrition.
Kokumin-Eiyo-no-Genjo (Current Status of National Nutrition) 1955-1993, Dai-ichi Shuppan, Tokyo (1957-1995).
2. Ministry of Health and Welfare of Japan, Health and Welfare Statistics and Information Department. Vital Statistics 1993, Vol. 1, Koseitokei Kyokai, Tokyo 1995.
3. Health and Welfare Statistics Association.
Kokumin-Eisei-no-Dokou (Trend of National
Health), Koseitokei Kyokai, Tokyo 2000.
4. Hirayama T. Non-smoking wives of heavy smokers have a higher risk of lung cancer: a study from Japaa BMJ, 282: 183-185, 1981. 5. Hirayama T. Life style and mortality: a
Large-scale Census-based Cohort Study in Japan. Basel, Switzerland Karger, 1990.
6. Doll R, Peto R. The cause of cancer, quantita tive estimates of avoidable risks of cancer in the
United States. J Nat Cancer Inst, 66, 1192-1308,
1981.
7. World Cancer Research Fund and American Institute for Cancer Prevention. Food, nutrition
and the prevention of cancer: A global
perspective. Washington DC: World Cancer
Research Fund and American Institute for
Cancer Prevention, 1997.
8. Trichopoulos D, Lagiou P, Trichopoulou A. Evidence-based nutrition. Asia Pacific J Clin Nutr, 9(Suppl), s4-s9, 2000.
9. Kinjo Y, Beral V, Akiba S, Key T, Mizuno S, Appleby P, Yamaguchi N, Watanabe S, Doll R. Possible protective effect of milk, meat and fish for cerebrovascular disease mortality in Japan. J Epidemiol, 9: 268-274, 1999.
10. Akiba S, Hirayama T. Cigarette smoking and cancer mortality risk in Japanese men and
women -Results from reanalysis of
Six-prefecture Cohort Study data Environ Health Perspect, 87, 19-26, 1990.
11. Preston DL, Lubin JH, Pierce DA. In; Epicure
User's Guide. Seattle: Hirosoft International, 1991.
12. Preston DL, Kato H, Kopecky KJ, Fujita S. Life span study report 10, Part 1, Cancer mortality among A-bomb survivors in Hiroshima and Nagasaki, 1950-1982. Radiatin Res, 111, 151-178, 1987.
13. Hirayama T. Japanese studies on diet and cancer. IN: Epidemiology of Diet and Cancer, Hill MI, et aL Eds. Ellis Horwood, London, 17-64, 1994.
14. Boyle P, Kevi R, Lucchuni F, La Vecchia C. Trends in diet-related cancers in Japan: a conun drum ? Lancet, 342, 752, 1993.
15. Hirohata T, Kono S. Diet/nutrition and stom
ach cancer in Japan. Int. J. Cancer, 10(Suppl.),
s34-s36, 1997.
16. Tanaka H, Yokoyama T. Cerebrovascular dis eases. In: Oxford textbook of public health. Oxford University Pres, Oxford plO65-plO79, 1996.
17. Yano K, Reed DM, MacLean CJ. Serum choles terol and hemorrhagic stroke in the Honolulu Heart Program. Stroke 20, 1460-1465, 1989. 18. Eastern Stroke and Coronary Heart Disease
Collaborative Research Group. Blood pressure, cholesterol, and stroke in eastern Asia Lancet 352, 1801-1807, 1998.
19. Shimamoto T, Isao H, Iida M, Komachi Y. Epidemiology of cerebrovascular disease: Stroke
epidemic in Japan. J Epidemiol 6(Suppl.), s43-s47,
1996.
20. Willett WC. Diet and health: What should we
eat? Science, 264, 532-537, 1994.
21. Watanabe S, Sobue T, Kinjo Y. Research ac tivities of cancer epidemiology in Japan. J Epidemiol, 3(SuppL), sl9-s29, 1996.
22. Yoshinaga A, Sasaki S, Tsugane S, and JPHC (Japan Public Health Center) Study Group. Sensitivity of self-reports of cancer in a population-based prospective study: JPHC Study Cohort I. J Clin Epidemiol, 54, 741-746, 2001.