TITLE: Upper airway evaluation of children with unilateral cleft lip and palate using
computational fluid dynamics
Authors:
Tomonori Iwasaki 1)
D.D.S., Ph.D, Associate Professor
Substantial contributions to conception and design, analysis and
interpretation of data, drafting the article, revising it critically
for important intellectual content, and final approval of the
version to be published.
Hokuto Suga 1)
D.D.S., Research Associate
Analysis and interpretation of data, revising it critically for
important intellectual content, and final approval of the
version to be published.
Ayaka Minami-Yanagisawa 1)
D.D.S., Graduate Student
Analysis and interpretation of data, revising it critically for
important intellectual content, and final approval of the
version to be published.
Makiko Hashiguchi-Sato 1)
D.D.S., Ph. D., Asistant professer
Analysis and interpretation of data, and final approval of the version
to be published.
Title Page © 2019. This manuscript version is made available under the CC-BY-NC-ND 4.0 license http://creativecommons.org/licenses/by-nc-nd/4.0/
Hideo Sato 1) D.D.S., Ph.D., Lectour
Analysis and interpretation of data, and final approval of the version
to be published.
Yuushi Yamamoto 1) D.D.S., Graduate Student
Analysis and interpretation of data, and final approval of the
version to be published.
Yoshito Shirazawa 1) D.D.S., Graduate Student
Analysis and interpretation of data, and final approval of the
version to be published.
Toshiya Tsujii 1) D.D.S., Graduate Student
Analysis and interpretation of data, and final approval of the
version to be published.
Ryuzo Kanomi 2) D.D.S., Ph.D
Acquisition of data, revising it critically for important intellectual
content, and final approval of the version to be published.
Youichi Yamasaki 1)
D.D.S., Ph.D, Professor and Chairman
Substantial contributions to conception and design, revising it
critically for important intellectual content, and final approval
of the version to be published.
1) Field of Developmental Medicine, Health Research Course, Graduate School of Medical
and Dental Sciences, Kagoshima University
2) Kanomi Orthodontic Office
Corresponding Author:
Tomonori Iwasaki, D.D.S., Ph.D
Affiliation & Address:
Field of Developmental Medicine, Health Research Course, Graduate School of Medical
and Dental Sciences, Kagoshima University,
8-35-1, Sakuragaoka Kagoshima-City, Kagoshima, 890-8544, Japan.
TEL: +81-99-275-6262
FAX: +81-99-275-6268
HIGHLIGHTS
Upper airway obstruction in children with UCLP resulted from both nasal and pharyngeal airway.
Nasal resistance was large in children with UCLP.
Adenoid was large in children with UCLP.
Pharyngeal airway volume was small in children with UCLP.
The hyoid bone was low in children with UCLP.
INTRODUCTION AND LITERATURE REVIEW
Clefts of the lip and/or palate (CLP) are the most frequently occurring congenital facial
deformities, with an incidence rate of 0.65% in newborns. In subjects with unilateral cleft lip and
palate (UCLP), maxillary retrognathism, a smaller mandible with an obtuse gonial angle, greater
anterior facial heights, and retroclined maxillary incisors are observed.1,2 Furthermore, children
with UCLP experience both morphological and breath problems.3-6 Parents of children with UCLP
have often reported that their children snore and breathe noisily during sleep,5 and patients with
reduced nasal airways have been reported to be predisposed to mouth breathing.3,4 Sobral et al.7
reported that patients with UCLP exhibited mild obstructive sleep apnea syndrome (OSAS).
Therefore, these upper airway (nasal to hypopharyngeal airway) problems have been studied in
both two-5,8 and three-dimensional (3D) approaches.5,9-12
In previous nasal airway studies, cross-sectional area13,14 and volume5,10,14 of nasal airway
were reported to be smaller in children with UCLP than in non-CLP children. However, in cases of
UCLP, it is more difficult (because of altered nasal septum15 and nasal mucosa hypertrophy16) to
determine nasal airway ventilation condition using morphological evaluations.
Rhinomanometry3,14,17 allows the evaluation of the nasal airway ventilation, regardless of nasal
airway shape. In contrast, pharyngeal airway axial cross-sectional area5,8 and pharyngeal airway
volume9 of UCLP children were smaller than that of non-CLP children. *Manuscript (no author identifiers please)
However, upper airway ventilation condition does not comprise separate ventilation of
nasal or pharyngeal airways; rather, it comprises the combined ventilation conditions of nasal and
pharyngeal airway. Recently, computational fluid dynamics (CFD) has been used for evaluation of
the airway ventilation condition.18,19 CFD reproduces the flow of air regardless of the shape of the
upper airway and provides an analysis of the range of the airway. Importantly, this study aimed to
evaluate the upper airway ventilation condition for children with UCLP using CFD, which had
previously been restricted to studies of the nasal5,10,13,14,17 or pharyngeal5,8,9,12,20 airway ventilation
condition.
MATERIAL AND METHODS
Due to the retrospective nature of this study, an exemption was granted in writing by the
institutional review board of our university, and the requirement to obtain informed consent was
waived (#657). Patients who visited a large private orthodontic practice for orthodontic treatment
from 2010 to 2015 in our city were included in this retrospective study. The inclusion criteria for
the study were: (1) patients who were 7–11 years of age; (2) patients who had undergone
diagnostic cone beam computed tomography (CBCT) for non-routine orthodontic treatment (to
minimize radiation exposure, we performed the scans only when the diagnostic benefits
of 95–105 degrees.21 Exclusion criteria comprised previous orthodontic, tonsillectomy, or
adenoidectomy treatment. However, it has been reported that nasopharyngeal size3 and nasal
ventilation conditions17 differ according to the cleft type. Thus, our study only involved patients
with UCLP. Lip closure by Millard-type lip repair had been performed (average age, 3.8 ± 1.2
months) in most patients, and closure of the palate had been performed by pushback palatoplasty
and the Furlow method (average age, 8.6 ± 3.9 months). No patient had undergone bone graft.
Control patients exhibited Class I malocclusion (2 degrees < A-nasion-B angle (ANB) < 4 degrees),
a Frankfort mandibular plane angle (FMA) of 25 to 33 degrees, which is the normal value for
Japanese children, and other conditions (asymmetries, transverse relationships, impacted teeth,
supranumerary teeth, ectopic eruption patterns, root health, skeletal growth, incidental pathology)
that can benefit from advanced 3D imaging using similar or even less radiation than a 2D series.22
Exclusion criteria for the control group were (1) craniofacial or growth abnormalities, (2) systemic
disease, (3) temporomandibular joint disorder, and (4) Suffering from a nasal disease at the time of
examination. The UCLP and control groups consisted of 12 boys and nine girls (average age, 9.1 ±
0.9 years) and 13 boys and 12 girls (average age, 9.2 ± 0.8 years), respectively. Children in the
control group were closely matched for sex and age with children in the UCLP group.
Each child was seated in a chair with the Frankfort horizontal plane parallel to the floor,
and was asked to hold their breath at the end of expiration without swallowing, because the
pharyngeal airway caliber (when awake) is the smallest at this time. The head and neck were
supported and fixed during the CBCT scan.19 CBCT (Alphard 3030, Asahi Roentgen, Kyoto,
Japan) was set to a maximum of 80 kV, a maximum of 2 mA, and an exposure time of 17 s. Using
a modified protocol, we obtained cephalogram-like data by performing CBCT. A 3D coordinate
system and image were constructed with a medical image analysis system (Imagnosis VE, Kobe,
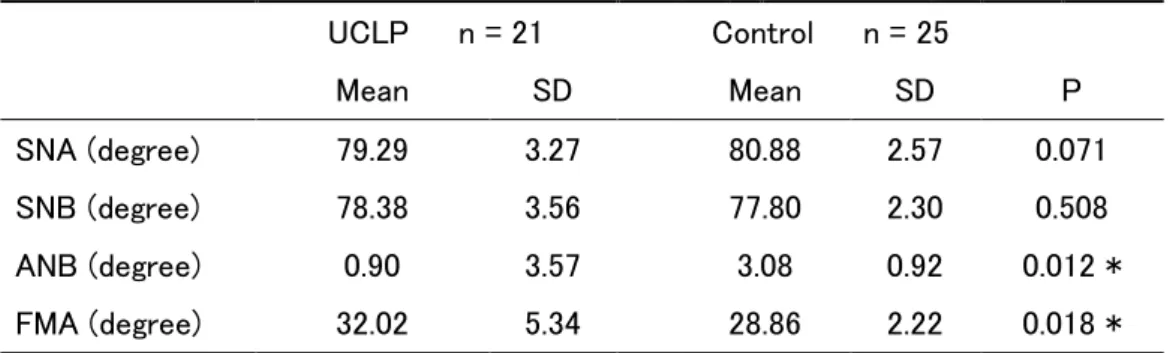
Japan). The planes were defined as described previously.23 From these constructed cephalometric
images, the anteroposterior positions of both maxilla and mandible were evaluated using the
sella-nasion-A (SNA) angle, sella-nasion-B (SNB) angle, ANB angle, and FMA. (Table I)
Morphological evaluation (nasal and intermaxillary molar width, hyoid height, and pharyngeal
and intraoral airway volume)
Volume rendering software (INTAGE Volume Editor; Cybernet, Tokyo, Japan) was used
to manually create 3D images and evaluate the intermaxillary molar and nasal width,24 hyoid
height, and pharyngeal and intraoral airway volume (Figure 1). Hyoid height comprised the
Pharyngeal and intraoral airway volumes were measured between the palatal plane and base of
epiglottis plane, and the palate and tongue, respectively.25
Evaluation of airway ventilation condition
1) Nasal resistance (Figure 2)
The 3D nasal airway was manually generated from CBCT data by volume-rendering
software (INTAGE Volume Editor; Cybernet Systems, Tokyo, Japan).25 The airway was segmented
primarily on the basis of image intensity with the threshold set midway between the soft tissue and
clear airway value. Subsequently, using mesh-morphing software (DEP Mesh Works/Morpher;
IDAJ, Kobe, Japan), the 3D model was converted to a smoothed model without losing the
patient-specific pattern of the airway shape. The models were exported to CFD software
(Phoenics; CHAM Japan, Tokyo, Japan) in stereo lithographic format. CFDs of the nasal airway
models were analyzed under the following conditions: airflow at a velocity of 200 mL/s;
non-slippery wall surface; simulations were repeated 1000 times to calculate mean values. The
simulation estimated airflow pressure; in this simulation, air flowed from the choanae horizontally
and was exhaled through both external nares. The nasal airway model resistance conformed to
postnasal rhinomanometry and was calculated from air mass flow and the difference in pressure
airway model resistance values vary based on the threshold of air in the airway model construction.
Therefore, we regulated the threshold of the nasal airway model so that the nasal airway model
resistance value obtained in CFD corresponded to the nasal resistance value for rhinomanometry.
2) Upper airway ventilation (Figure 3)
Additionally, we conducted an expiration simulation (air flowing in perpendicular to the
lower pharyngeal plane at a velocity of 200 mL/s) using a method similar to that described above
for the nasal airway.26 We estimated maximal pressure and maximum velocity upper airway (from
nare to base of epiglottis). The nasopharyngeal and pharyngeal airway (total pharyngeal airway;
from choanae to base of epiglottis) pressure was calculated from a difference between the pressure
of the base of epiglottis (BEp) and that of the choanae (Cp).
Adenoid and tonsil size measurements
The distance in the midsagittal plane from the posterior outline of the soft palate to the
closest point of the adenoid tissue on CBCT images was used to classify the relative sizes of the
adenoids into four groups (Grade 1, <25% obstruction; Grade 2, 25–50% obstruction; Grade 3,
the mid-coronal plane was also used to classify the relative sizes of the tonsils into five groups
(Grade 1, no hyperplasia of the tonsils; Grade 2, the tonsils extend one-quarter of the way to the
midline; Grade 3, tonsils extend halfway to the midline; Grade 4, tonsils extend three-quarters of
the way to the midline; Grade 5, tonsils completely obstruct the airway, also known as “kissing”
tonsils).19
Statistical analysis
For each measurement, t-test and the Mann-Whitney U test were used to compare
differences between UCLP and control groups, depending upon the data distribution. Fisher’s
exact test clarified the distributions of airflow types, adenoid sizes, and tonsil sizes in both groups.
For all tests, P < 0.05 was considered statistically significant.
To estimate statistical power, power analysis was conducted using the obtained mean
and standard deviation (SD) values. All measurements were repeated after 1 week by the same
investigator (T.I.), and Dahlberg's formula27 was used for the calculation of the measurement error.
The measurement errors for the cephalometric images were from 0.353° to 0.426°. The error of the
nasal width was 0.082 mm, of intermaxillary width 0.052 mm, of hyoid position 0.062 mm,
pharyngeal airway volume 0.012 cm3, and of intraoral airway volume 0.007 cm3. And the error of
0.05 m/s, and of total pharyngeal airway pressure 0.432 Pa. According to all repeated analyses, the
method error was considered negligible.
RESULTS
Morphological evaluation
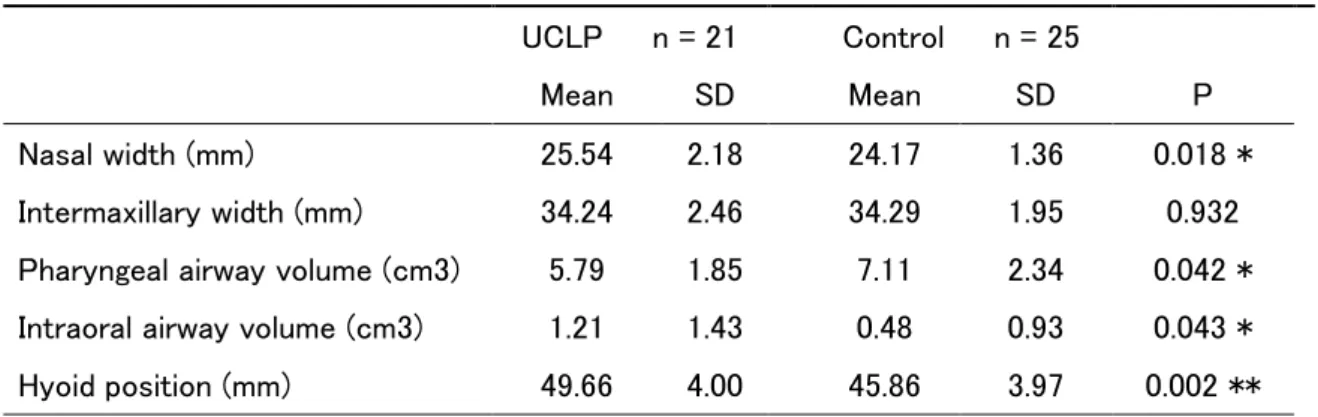
The nasal width of the UCLP group (25.54 ± 2.18 mm) was significantly larger than
that of the control group (24.17 ± 1.36 mm) (Table II, P = 0.018). However, the intermaxillary
molar width did not differ significantly between the groups. The pharyngeal airway volume of the
UCLP group (5.79 ± 1.85 cm3) was significantly smaller than that of the control group (7.11 ± 2.34
cm3) (P = 0.042) (Table II). The intraoral airway volume of the UCLP group (1.21 ± 1.43 cm3) was
significantly larger than that of the control group (0.48 ± 0.93 cm3) (P = 0.043). The hyoid height
of the UCLP group (49.66 ± 4.00 mm) was significantly lower than that of the control group
(45.87 ± 3.97 mm) (P = 0.002).
Ventilation condition
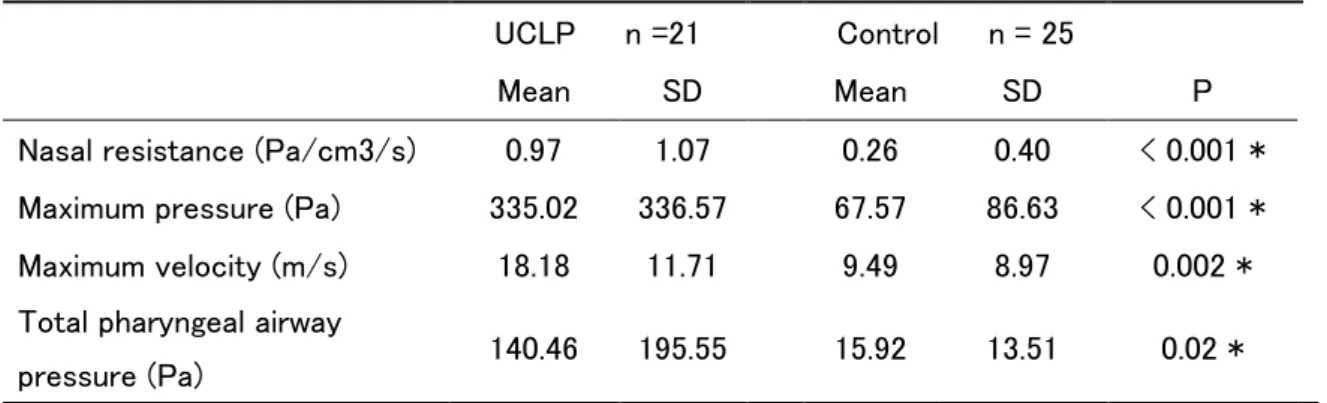
Nasal resistance of the UCLP group (0.97 ± 1.07 Pa/cm3/s) was significantly
pressure of the upper airway in the UCLP group (335.02 ± 336.57 Pa) was significantly higher
than that of the control group (67.57 ± 86.63 Pa) (P < 0.001). Maximum velocity of the upper
airway in the UCLP group (18.18 ± 11.71 m/s) was significantly faster than that of the control
group (9.49 ± 8.97 m/s) (P = 0.002). Total pharyngeal airway pressure of the UCLP group (140.46
± 195.55 Pa) was significantly higher than that of the control group (15.92 ± 13.51 Pa) (P < 0.02).
Incidence of adenoid and tonsil hypertrophy
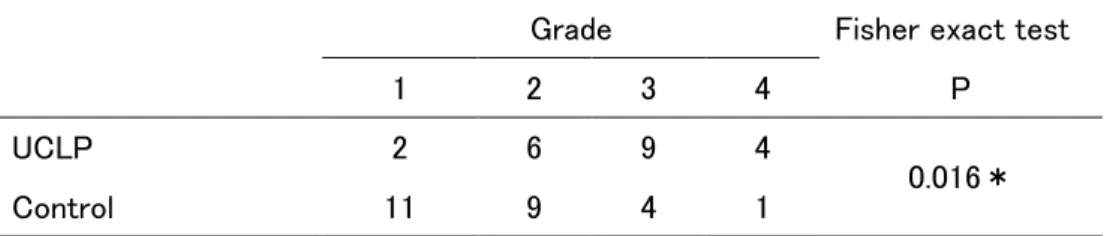
The incidence of adenoid hypertrophy (grades 3 and 4) in the UCLP group was 61.9%,
whereas the incidence in the control group was 20.0% (Table IV). The distribution of adenoid
hypertrophy between the two groups was statistically significant according to Fisher’s exact test (P
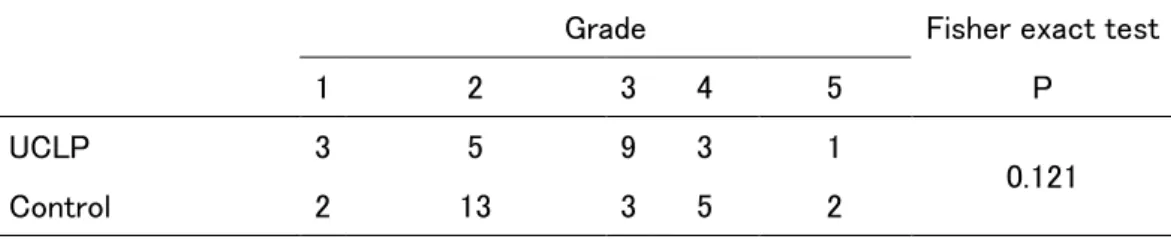
= 0.033). The distribution of tonsil hypertrophy between the two groups was not significantly
different (Table V).
DISCUSSION
The main purpose of this study was to evaluate the ventilation condition of the upper
that upper airway obstruction in children with UCLP resulted from the effects of both nasal and
total pharyngeal airways (Table III, Figures 4, 5).
Previous methods of evaluating the nasal airway ventilation condition of patients with
UCLP include X-rays,5,8 computed tomography5,10, rhinomanometry,13,14,17 and acoustic
rhinometry.14 Because the nasal airway has a complicated lumen, evaluation of the nasal airway
ventilation condition is extremely difficult when solely using morphologic data. One must evaluate
the cross-sectional area, as well as the cross-sectional form and continuity of the lumen.
Rhinomanometry data is thought to be affected by adenoid, soft palate, and tonsil; acoustic
rhinometry could not evaluate the rear section of a narrowing area. However, CFD simulates the
magnitudes of air pressure and velocity, such that the function of the entire nasal airway can be
evaluated more precisely than in morphologic evaluation. Furthermore, CFD can evaluate the
ventilation conditions of (1) the nasal airway alone, without the effects of the adenoids, palatine
tonsils, and soft palate, and (2) the upper airway, from the nasal airway to the hypopharyngeal
airway. Furthermore, it can show the air flow of the nasal airway. Thus, we used CFD to evaluate
the ventilation conditions in the nasal and upper airways of UCLP children.
In our results, the nasal resistance of the control group was 0.26 Pa/cm3/s (Table III).
Crouse et al.28 reported that nasal resistance in 9- to 10-year-old normal children ranged from
3.0–5.0 cmH2O/L/s. This value corresponds to approximately 0.3–0.5 Pa/cm 3
/s in our study unit.
Kobayashi et al.29 reported normal nasal airway resistance of elementary school children
(approximately 9 years old) to be 0.35±0.17 Pa/cm3/s. So, in our study, we defined that the nasal
obstruction value was 0.5 Pa/cm3/s and it was considered to indicate obstruction with 100 Pa of
pressure at an inflow of 200 mL per second.26 From these studies, because nasopharyngeal airway
and soft palate are not included in assessment of our control group, our values were slightly
smaller than those of the reported normal groups. However, we suspect that values similar to those
of an approximately normal person were obtained. Moreover, the ventilation condition evaluation
by CFD confirmed a value similar to that obtained by conventional rhinomanometry.
The nasal resistance of the UCLP group (0.97 Pa/cm3/s) was approximately four times
larger than that of the control group (0.26 Pa/cm3/s, Table III). A previous morphological study
reported13 that, in adult subjects with UCLP, a cross-section of the affected side nasal airway is
50% smaller than a cross-section of the unaffected side nasal airway. Farzal et al.10 reported that
the nasal airway volume of 7–12-year-olds with UCLP (7097 ± 2596 mm3) and bilateral CLP
(6715 ± 2115 mm3) was significantly smaller than that of the control group (9932 ± 1807 mm3).
al.14 reported nasal resistance of adults with UCLP using rhinomanometry, showing that the
affected side was 2.7 Pa s/cm3, unaffected side was 0.95 Pa s/cm3, and both sides together were 0.8
Pa s/cm3. Their value was four times the resistance level of the normal adult (0.2 Pa/cm3/s).
Further, they reported that large nasal resistance occurred because nasal airway cross-section of the
affected side showed 50–70% smaller area and 80% smaller volume. However, the nasal resistance
of our UCLP group (0.97 Pa/cm3/s) was different from the value of Mani et al. (0.8 Pa/cm3/s)14
Laine-Alava et al.31 evaluated growth changes in nasal resistance of normal children (8–17 years
old), reporting that the nasal resistances of normal 9-year-old boys and girls were 2.8 Pa/cm3/s and
3.7 Pa/cm3/s, respectively; the resistances of normal 17-year-old boys and girls were 1.5 Pa/cm3/s
and 2.4 Pa/cm3/s, respectively. Thus, because the ages of the subjects (9 and 17 years old) were
different, we expected that the nasal resistances would be different. However, the ratio of the
resistance level in cases of UCLP, compared with control children, showed a four-fold change,
similar to that observed by Mani et al.14 Thus, the nasal resistance values of the UCLP group in our
study were reliable and children with UCLP were shown to have nasal obstruction.
Upper airway ventilation condition
Upper airway maximum pressure and velocity of the UCLP group were 335.02 Pa and
obstruction at inspiration (nasal resistance was 0.83 Pa/cm3/s) using CFD (flow rate was 281
cm3/s); they reported that the upper airway maximum pressure at inspiration was -253.99 Pa (-2.59
cmH2O). Because they measured CFD of inspiration, the signs of the values are different.
Therefore, comparing the absolute values of their results and our results, the pressure of their
obese group is relatively smaller than that of our UCLP group. However, the upper airway pressure
of obese children with nasal obstruction showed a value that was similar to our children with
UCLP, when considering differences in nasal resistance (0.97 Pa/cm3/s vs 0.83 Pa/cm3/s) and flow
rate (200 cm3 vs 281 cm3) (Table III). A previous study reported that Class II children (mean age,
9.3 years) with nasal obstruction, but without adenoid and tonsil hypertrophy, had considerable
expiration upper airway pressure (220.26 Pa).32 When upper airway obstruction is observed, it is
reported that the upper airway velocity is fast.26 The maximum upper airway velocity of
dolichofacial Class II children with upper airway obstruction was reported as 15.5 m/s.
From these reports18,26,32, CFD showed that the upper airway maximum pressure and
velocity in our children with UCLP had tendencies similar to those observed in patients with upper
airway obstruction. Thus, we conclude that children with UCLP exhibit upper airway obstruction.
In our study, adenoid hypertrophy of the UCLP group was detected (Table IV). Imamura
et al.8 reported that at 9.2 years, children with UCLP had significantly larger hypertrophy than
control children. As a result, anterior-posterior depth of nasopharyngeal airways of UCLP was
shorter than in control children. Shahidi et al.11 found that the nasopharyngeal airway volume of
subjects with UCLP was smaller than that of control subjects. Therefore, nasopharyngeal airway
part of children with UCLP was small, and nasopharyngeal airway obstruction could easily occur.
In contrast, the present study showed that the UCLP group had smaller pharyngeal airway volume
(from palatal plane to base of epiglottis plane) (Table II). In previous studies, the pharyngeal
airway size of patients with UCLP was evaluated by axial cross-section area5 and volume.9,11
These studies and our results showed that the pharyngeal airway sizes of children with UCLP were
small. These morphological data showed that airway obstruction occurred in pharyngeal airway,
similar to the nasopharyngeal airway.
Furthermore, we used CFD as a functional evaluation method, and found that the total
pharyngeal airway (from choanae to base of epiglottis) pressure of the UCLP group was 140.46 Pa.
A previous study reported that in children18 with OSAS who had adenoids and hyperplasia of
palatine tonsil ventilation obstruction, the pharyngeal airway pressure (from choanae to the base of
the epiglottis) was 200.79 Pa. The pressure of children with UCLP in our study is slightly smaller
CLP is regarded as indicating airway obstruction. In contrast, the total pharyngeal airway pressure
of control group was 15.92 Pa. In a previous study, the pharyngeal airway pressure (between
palatal plane and base of epiglottis plane) of 11.9-year-old normal children was 5.57 Pa.33 Because
the adenoid size of our control group was relatively small (Table IV), we suspect that the effect on
the total pharyngeal airway (from choanae to base of epiglottis) pressure in our control group was
small. Thus, we considered that the pressure of the total pharyngeal airway (from choanae to base
of epiglottis) of our control group was similar to that of normal children and that they did not
exhibit total pharyngeal airway obstruction.
From these observations, we conclude that children with UCLP had total pharyngeal
airway (from choanae to base of epiglottis) obstruction because of adenoid hypertrophy and small
pharyngeal airway.
Relationship between upper airway ventilation condition and maxillofacial form
The nasal resistance value of the UCLP group (0.97 Pa/cm3/s) in our study is larger than
the value that was associated with nasal obstruction in a previous study (0.57 Pa/cm3/s).34 When
nasal airway resistance is beyond nasal airway resistance (0.5 Pa/cm3/s) that mouth breathing
produces, mouth breathing occurs as well as nasal breathing.19 And the breathing ratio of a nose
(0.97 ± 1.04 Pa/cm3/s) in our study was large and varied. Therefore although we did not evaluate
the breathing situation of UCLP children directly, from previous study,35 UCLP children had
various breathing ratio of a nose and the mouth and expected that there was much case where the
ratio of the mouth breathing was high. Previous studies have reported that patients with UCLP
exhibited mouth breathing,3,4 a more inferiorly positioned hyoid,6,36 and larger craniocervical
angulation.2 In our results, the morphological features of children with UCLP were a lower hyoid
position, larger intraoral airway volume, and larger FMA. In a previous study, larger intraoral
airway volume was indicative of low tongue posture.25
It is thought that children with UCLP begin mouth breathing as a result of upper airway
obstruction, and exhibit lower tongue and hyoid positions.19The UCLP children who are high in a
ratio of the mouth breathing with nasal obstruction similar to previous reports.19 Furthermore,
lower growth direction has been reported in children with UCLP.2 From our study results, FMA
appeared to grow larger through low tongue and lower hyoid position as a result of the upper
airway obstruction, such that growth direction became downward. Thus, upper airway obstruction
may be a contributing factor of the reported maxillofacial morphological characteristics of
CLP.2,6,9,20
The main limitation of this study is that our CFD analysis is based on several assumptions,
including steady flow, homogeneous fluid, and rigid walls, which limit its applicability to normal
physiological conditions. Therefore, we believe that our findings simply suggest tendencies similar
to actual breathing. This study is not a clinical study. It is necessary to confirm these results in a
clinical study which measured volume of air respired orally and nasally in the future.Because of
slightly undersized samples, the results had a small chance of accepting a false hypothesis (Type II
error). However, because each variable accepted significant difference. It thought that there was
little effect on results. And due to the small study sample, to verify our data, independent study of
another racial group or a much larger scale of study in our population is needed in future.
CONCLUSIONS
Children with UCLP had large nasal resistance, large adenoid, and small pharyngeal airway
volume. Moreover, they showed upper airway obstruction because of nasal, nasopharyngeal, and
pharyngeal airway alterations. The UCLP children had a bigger nasal airway resistance than
control children. And the adenoids of UCLP children were enlarged than that of control children.
Conversely, the pharyngeal airway of UCLP children was smaller than that of control children.
From these things, the possibility that the upper airway ventilation obstruction of UCLP children
Acknowledgements
This work was supported by KAKENHI from Japan Society for the Promotion of
Science (No. 17K11965, 16K15841) and Mitsui Sumitomo Insurance welfare Foundation. We
REFERENCES
1. Holst AI, Holst S, Nkenke E, Fenner M, Hirschfelder U. Vertical and sagittal growth in patients with unilateral and bilateral cleft lip and palate-a retrospective cephalometric evaluation. Cleft Palate Craniofac J 2009;46:512-20.
2. Lin Y, Fu Z, Ma L, Li W. Cone-beam computed tomography-synthesized cephalometric study of operated unilateral cleft lip and palate and noncleft children with Class III skeletal relationship. Am J Orthod Dentofacial Orthop 2016;150:802-10.
3. Warren DW, Hairfield WM, Dalston ET, Sidman JD, Pillsbury HC. Effects of cleft lip and palate on the nasal airway in children. Arch Otolaryngol Head Neck Surg 1988;114:987-92.
4. Drake AF, Davis JU, Warren DW. Nasal airway size in cleft and noncleft children. Laryngoscope 1993;103:915-7.
5. Aras I, Olmez S, Dogan S. Comparative evaluation of nasopharyngeal airways of unilateral cleft lip and palate patients using three-dimensional and two-dimensional methods. Cleft Palate Craniofac J 2012;49:e75-81.
6. Rose E, Staats R, Thissen U, Otten JE, Schmelzeisen R, Jonas I. Sleep-related obstructive disordered breathing in cleft palate patients after palatoplasty. Plast Reconstr Surg 2002;110:392-6.
7. Sobral DS, Faller GJ, Collares MVM. Respiratory Polysomnographic Findings in Patients Treated Primarily for Unilateral Cleft Lip and Palate. Cleft Palate Craniofac J 2018;55:287-91.
8. Imamura N, Ono T, Hiyama S, Ishiwata Y, Kuroda T. Comparison of the sizes of adenoidal tissues and upper airways of subjects with and without cleft lip and palate. Am J Orthod Dentofacial Orthop 2002;122:189-94; discussion 94-5.
9. Celikoglu M, Buyuk SK, Sekerci AE, Ucar FI, Cantekin K. Three-dimensional evaluation of the pharyngeal airway volumes in patients affected by unilateral cleft lip and palate. Am J Orthod Dentofacial Orthop 2014;145:780-6.
10. Farzal Z, Walsh J, Lopes de Rezende Barbosa G, Zdanski CJ, Davis SD, Superfine R et al. Volumetric nasal cavity analysis in children with unilateral and bilateral cleft lip and palate. Laryngoscope 2016;126:1475-80.
11. Shahidi S, Momeni Danaie S, Omidi M. Comparison of the Pharyngeal Airway Volume between Non-Syndromic Unilateral Cleft Palate and Normal Individuals Using Cone Beam Computed Tomography. J Dent (Shiraz) 2016;17:268-75.
12. Pimenta LA, de Rezende Barbosa GL, Pretti H, Emodi O, van Aalst J, Rossouw PE et al. Three-dimensional evaluation of nasopharyngeal airways of unilateral cleft lip and palate patients. Laryngoscope 2015;125:736-9.
13. Fukushiro AP, Trindade IE. Nasal airway dimensions of adults with cleft lip and palate: differences among cleft types. Cleft Palate Craniofac J 2005;42:396-402.
14. Mani M, Moren S, Thorvardsson O, Jakobsson O, Skoog V, Holmstrom M. EDITOR'S CHOICE: objective assessment of the nasal airway in unilateral cleft lip and palate--a long-term study. Cleft Palate Craniofac J 2010;47:217-24.
15. Suri S, Utreja A, Khandelwal N, Mago SK. Craniofacial computerized tomography analysis of the midface of patients with repaired complete unilateral cleft lip and palate. Am J Orthod Dentofacial Orthop 2008;134:418-29.
16. Kunkel M, Wahlmann U, Wagner W. Nasal airway in cleft-palate patients: acoustic rhinometric data. J Craniomaxillofac Surg 1997;25:270-4.
17. Sandham A, Solow B. Nasal respiratory resistance in cleft lip and palate. Cleft Palate J 1987;24:278-85.
18. Wootton DM, Luo H, Persak SC, Sin S, McDonough JM, Isasi CR et al. Computational fluid dynamics endpoints to characterize obstructive sleep apnea syndrome in children. J Appl Physiol (1985) 2014;116:104-12.
19. Iwasaki T, Sato H, Suga H, Takemoto Y, Inada E, Saitoh I et al. Relationships among nasal resistance, adenoids, tonsils, and tongue posture and maxillofacial form in Class II and Class III children. Am J Orthod Dentofacial Orthop 2017;151:929-40.
20. Akarsu-Guven B, Karakaya J, Ozgur F, Aksu M. Growth-related changes of skeletal and upper-airway features in bilateral cleft lip and palate patients. Am J Orthod Dentofacial Orthop 2015;148:576-86.
21. Muto T, Takeda S, Kanazawa M, Yamazaki A, Fujiwara Y, Mizoguchi I. The effect of head posture on the pharyngeal airway space (PAS). Int J Oral Maxillofac Surg 2002;31:579-83.
22. Carlson SK, Graham J, Mah J, Molen A, Paquette DE, Quintero JC. Let the truth about CBCT be known. Am J Orthod Dentofacial Orthop 2014;145:418-9.
23. Iwasaki T, Takemoto Y, Inada E, Sato H, Saitoh I, Kakuno E et al. Three-dimensional cone-beam computed tomography analysis of enlargement of the pharyngeal airway by the Herbst appliance. Am J Orthod Dentofacial Orthop 2014;146:776-85.
24. Iwasaki T, Saitoh I, Takemoto Y, Inada E, Kanomi R, Hayasaki H et al. Improvement of nasal airway ventilation after rapid maxillary expansion evaluated with computational fluid dynamics. Am J Orthod Dentofacial Orthop 2012;141:269-78.
25. Iwasaki T, Saitoh I, Takemoto Y, Inada E, Kakuno E, Kanomi R et al. Tongue posture improvement and pharyngeal airway enlargement as secondary effects of rapid maxillary expansion: a cone-beam computed tomography study. Am J Orthod Dentofacial Orthop 2013;143:235-45.
26. Iwasaki T, Saitoh I, Takemoto Y, Inada E, Kanomi R, Hayasaki H et al. Evaluation of upper airway obstruction in Class II children with fluid-mechanical simulation. Am J Orthod Dentofacial Orthop 2011;139:e135-45.
27. Dahlberg G. Stastistical methods for medical and biological syudents. New York: Interscience Publications; 1940.
28. Crouse U, Laine-Alava MT, Warren DW. Nasal impairment in prepubertal children. Am J Orthod Dentofacial Orthop 2000;118:69-74.
29. Kobayashi R, Miyazaki S, Karaki M, Kobayashi E, Karaki R, Akiyama K et al. Measurement of nasal resistance by rhinomanometry in 892 Japanese elementary school children. Auris Nasus Larynx 2011;38:73-6.
30. Warren DW, Duany LF, Fischer ND. Nasal pathway resistance in normal and cleft lip and palate subjects. Cleft Palate J 1969;6:134-40.
31. Laine-Alava MT, Murtolahti S, Crouse UK, Warren DW. Upper airway resistance during growth: A longitudinal study of children from 8 to 17 years of age. Angle Orthod 2016;86:610-6.
32. Iwasaki T, Sato H, Suga H, Takemoto Y, Inada E, Saitoh I et al. Influence of pharyngeal airway respiration pressure on Class II mandibular retrusion in children: A computational fluid dynamics study of inspiration and expiration. Orthod Craniofac Res 2017;20:95-101.
33. Iwasaki T, Sato H, Suga H, Minami A, Yamamoto Y, Takemoto Y et al. Herbst appliance effects on pharyngeal airway ventilation evaluated using computational fluid dynamics. Angle Orthod 2017;87:397-403.
34. White BC, Woodside DG, Cole P. The effect of rapid maxillary expansion on nasal airway resistance. J Otolaryngol 1989;18:137-43.
35. Warren DW, Drake AF, Davis JU. Nasal airway in breathing and speech. Cleft Palate Craniofac J 1992;29:511-9.
36. Cheung T, Oberoi S. Three dimensional assessment of the pharyngeal airway in individuals with non-syndromic cleft lip and palate. PLoS One 2012;7:e43405.
FIGURE CAPTIONS
Figure 1. Measurement of airway volumes and hyoid height: A, landmarks and planes for the axial
airway section; B, pharyngeal airway between the PL and EB planes; intraoral airway between the
palate and the tongue; PNS, posterior nasal spine; EB, base of the epiglottis; H, the most superior
and anterior point of the hyoid bone; 1, PL plane, a plane parallel to the hard palate passing
through the PNS; 2, EB plane, a plane parallel to the PL plane passing through the EB; 3, hyoid
height, the distance from PL plane to H.
Figure 2. Evaluation of upper airway ventilation condition by computational fluid dynamics. A,
Extraction of the upper airway. B, Construction of the three-dimensional upper airway model and
numeric simulation (Expiration air mass flow 200 mL/s, light orange arrow). C, Evaluation of the
upper airway ventilation condition (left, pressure; right, velocity); Cp, choanae pressure, EBp, base
of epiglottis pressure.
Figure 3. Calculation of nasal resistance by computational fluid dynamics. A, Extraction of the
nasal airway. B, Construction of the three-dimensional nasal airway model and numeric simulation
(Expiration air mass flow 200 mL/s, light orange arrow). C, Evaluation of the nasal airway
Figure 4. Upper airway ventilation condition of control children by computational fluid dynamics.
A, Left; sagittal view, adenoid and tonsil hypertrophy is not found, Right; frontal view, deviated
nasal septum and mucosal hypertrophy is not found. B, Left; the pressure of all parts of the upper
airway is low (blue part). Right; the velocity of all parts of the upper airway is slow (blue part).
Upper airway obstruction of control children was not detected.
Figure 5. Upper airway ventilation condition of children with unilateral cleft and palate by
computational fluid dynamics. A, Left; sagittal view, adenoid hyper trophy was revealed (yellow
arrow), Right; deviated nasal septum and nasal mucosal hypertrophy were revealed (blue arrow).
B, Left; backward part of the nasal airway pressure was large (orange part), and abrupt pressure
change was shown at adenoid (yellow arrow); furthermore, pharyngeal airway part pressure was
extremely large (red part). Right; nasal airway (red arrow) and nasopharyngeal airway (yellow
arrow) velocity were fast, because deviated nasal septum and nasal mucosa exhibit hypertrophy
and adenoid exhibits hypertrophy. Pharyngeal airway velocity was relatively fast in comparison
with control children (light green part). As a result, upper airway obstruction in children with
unilateral cleft and palate was indicated by nasal, nasopharyngeal, and pharyngeal airway
Figure 1
Figure 2
Figure 3
Figure 4
Figure 5
Table I Maxillofacial form UCLP n = 21 Control n = 25 Mean SD Mean SD P SNA (degree) 79.29 3.27 80.88 2.57 0.071 SNB (degree) 78.38 3.56 77.80 2.30 0.508 ANB (degree) 0.90 3.57 3.08 0.92 0.012 * FMA (degree) 32.02 5.34 28.86 2.22 0.018 * * Statistically significant at P < 0.05. Table I
Table II Comparison of CLP and control children
UCLP n = 21 Control n = 25
Mean SD Mean SD P
Nasal width (mm) 25.54 2.18 24.17 1.36 0.018 *
Intermaxillary width (mm) 34.24 2.46 34.29 1.95 0.932
Pharyngeal airway volume (cm3) 5.79 1.85 7.11 2.34 0.042 *
Intraoral airway volume (cm3) 1.21 1.43 0.48 0.93 0.043 *
Hyoid position (mm) 49.66 4.00 45.86 3.97 0.002 **
** Statistically significant at P < 0.01, * Statistically significant at P < 0.05.
Table III Comparison of ventilation condition between CLP and control children
UCLP n =21 Control n = 25
Mean SD Mean SD P
Nasal resistance (Pa/cm3/s) 0.97 1.07 0.26 0.40 < 0.001 *
Maximum pressure (Pa) 335.02 336.57 67.57 86.63 < 0.001 *
Maximum velocity (m/s) 18.18 11.71 9.49 8.97 0.002 *
Total pharyngeal airway
pressure (Pa) 140.46 195.55 15.92 13.51 0.02 *
** Statistically significant at P < 0.01, * Statistically significant at P < 0.05.
Table IV Subject distributions based on adenoid size
Grade Fisher exact test
1 2 3 4 P UCLP 2 6 9 4 0.016* Control 11 9 4 1 * Statistically significant at P < 0.05 Table IV
Table V Subject distributions based on tonsil size
Grade Fisher exact test
1 2 3 4 5 P
UCLP 3 5 9 3 1
0.121
Control 2 13 3 5 2