Genome-wide meta-analysis identi
fies multiple
novel loci associated with serum uric acid levels in
Japanese individuals
Masahiro Nakatochi
et al.
#Gout is a common arthritis caused by elevated serum uric acid (SUA) levels. Here we
investigated loci influencing SUA in a genome-wide meta-analysis with 121,745 Japanese
subjects. We identi
fied 8948 variants at 36 genomic loci (P<5 × 10
–8) including eight novel
loci. Of these, missense variants of SESN2 and PNPLA3 were predicted to be damaging to the
function of these proteins; another
five loci—TMEM18, TM4SF4, MXD3-LMAN2,
PSORS1C1-PSORS1C2, and HNF4A—are related to cell metabolism, proliferation, or oxidative stress; and
the remaining locus, LINC01578, is unknown. We also identified 132 correlated genes whose
expression levels are associated with SUA-increasing alleles. These genes are enriched for
the UniProt transport term, suggesting the importance of transport-related genes in SUA
regulation. Furthermore, trans-ethnic meta-analysis across our own meta-analysis and the
Global Urate Genetics Consortium has revealed 15 more novel loci associated with SUA. Our
findings provide insight into the pathogenesis, treatment, and prevention of hyperuricemia/
gout.
https://doi.org/10.1038/s42003-019-0339-0
OPEN
Correspondence and requests for materials should be addressed to H.M. (email:[email protected]).#A full list of authors and their af
filiations appears at the end of the paper.
123456789
S
erum uric acid (SUA) is reported to have an antioxidative
effect
1,2, whereas elevated SUA, or hyperuricemia, results in
crystal deposition and causes gout
3. Gout is a common
disease characterized by noninfectious acute arthritis. Both gout
and hyperuricemia can result from an unhealthful lifestyle
4–6, but
recent genetic studies, including genome-wide association studies
(GWASs), have also revealed a genetic contribution to the
development of these conditions, with this contribution being
larger than that for other common diseases
7–12. Moreover,
epi-demiologic studies have revealed their relationship among other
diseases such as cardiovascular diseases
13,14, indicating the
importance of elucidation of the pathophysiology of these
con-ditions. To date, several GWASs of SUA have been performed
with Caucasian populations
15–24as well as Asian populations
including Japanese subjects
25,26. Although there are genetic
dif-ferences between Caucasian and Asian populations, they have
many shared associated genes
3,27that exert major effects, such as
ABCG2, SLC2A9, and SLC22A12, all of which are well-known
representative urate transporters in humans and which are
important as therapeutic target molecules for gout and
hyperur-icemia. Therefore, identifying new loci may not only help
eluci-date the pathophysiology of these diseases, but may also reveal
their target molecules, taking into account the fact that these
diseases have a broader genetic basis than other common diseases
as described above. Furthermore, the gene expression patterns to
which the identified loci contribute should enable us to estimate
effective pathways for drug delivery. In the present study, we have
investigated the genetic loci that influence SUA with more than
120,000 Japanese individuals in a genome-wide meta-analysis and
have compared our
findings with those of previous GWASs
24,28.
We identified 36 loci for SUA, including eight previously
unre-ported loci, that suggest key cellular processes which contribute to
elevated serum uric acid levels, followed by the identification of
15 more loci by trans-ethnic meta-analysis.
Results
Genome-wide meta-analysis. We performed a genome-wide
meta-analysis based on three Japanese cohorts including those of
the Japan Multi-institutional Collaborative Cohort (J-MICC)
Study
29,30, the Kita-Nagoya Genomic Epidemiology (KING)
Study
31,32, and the BioBank Japan (BBJ) Project
33,34. Detailed
information regarding the baseline characteristics of the study
subjects, genotyping arrays, and imputation is summarized in
Supplementary Tables 1 and 2. We performed a genome-wide
meta-analysis for SUA with data sets encompassing 121,745
Japanese subjects. Intercepts of linkage disequilibrium (LD) score
regression and the genomic control lambda for each study are
shown in Supplementary Table 2. The intercepts of LD score
regression and the genomic control lambda for our meta-analysis
were 1.043 and 1.165, respectively. Genomic control adjustment
was not applied for genomic control at the level of each study
because intercepts of LD score regression did not show inflation
of test statistics. The quantile–quantile (Q–Q) plot for P values is
shown in Supplementary Fig. 1. The results of the meta-analysis
identified 8948 variants at 36 genetic loci with a P value of <5 ×
10
–8for SUA (Fig.
1
). Among these 36 genetic loci, 8 were not
previously reported, 10 were recently identified in a GWAS for
SUA in Japanese performed by BBJ
28, and 18 were previously
identified by other GWASs for SUA
15–17,19,20,24–26. The eight
novel loci were the following: rs74896528 of SESN2, rs10188118
of LOC105373352 - TMEM18, rs6774054 of TM4SF4, rs11952102
of
MXD3-LMAN2,
rs16898823
of
PSORS1C1-PSORS1C2,
rs8024067 of LINC01578, rs6031598 of HNF4A, and rs2281293 of
PNPLA3.
Sentinel single-nucleotide polymorphisms (SNPs) with the
lowest P values for SUA at each of the 36 loci are shown in
Table
1
. Association results of each study are shown in
Supplementary Data 1. We determined the effect allele
frequen-cies (EAFs) of these sentinel SNPs for each population in 1000
Genomes phase 3 (Supplementary Data 2). The EAFs indicated
that rs74896528 of SESN2 at chromosome 1p35.3 is an East
Asian–specific SNP. Regional association plots for the eight loci
newly identified in the present study are shown in Fig.
2
. The BBJ
data recently revealed that SNPs located at 27 loci showed
genome-wide significant associations with SUA including 10
novel loci (Table
1
)
28. About the 27 reported SNPs, we compared
the results in our meta-analysis with the recent results by BBJ
28(Supplementary Data 3), with regional association plots for the 10
loci also identified in the present study being shown in
Supplementary Figure 2. The results for these 27 SNPs, identified
in our meta-analysis, revealed a higher level of significance for the
association with SUA in our meta-analysis than in the BBJ study.
A European GWAS for SUA was previously performed by the
Global Urate Genetics Consortium (GUGC)
24. We examined
the publicly available data provided by the GUGC-based study for
1 2 20 15 10 –log 10 ( P v alue) 5 0 3 4 5 6 7 8 Chromosome 9 10 11 12 13 14 15 16 171819 22 20 21
Fig. 1 Manhattan plot for the meta-analysis of SUA. The horizontal line represents the genome-wide significance level (α = 5 × 10⁻⁸). Eighteen loci shown in orange were also recently identified by BBJ as being associated with SUA, 10 loci in blue were also identified by other studies and those in red indicate eight novel loci identified in the present study. Blue triangles represent loci containing SNPs with P values of <1 × 10⁻²⁰. SUA serum uric acid, BBJ BioBank Japan
the sentinel SNPs or SNPs showing high LD (r
2of
≥0.8 in JPT of
1000 Genomes phase 3) with the sentinel SNPs at the eight novel
loci identified in the present study. Three of these loci, including
5q35.3, 20q13.12, and 22q13.31, were significantly associated with
SUA in the GUGC-based GWAS, with the same direction of
effect size as in our study (Supplementary Table 3). The 2p25.3
locus was nominally significantly associated with SUA. Although
the 3q25.1 locus was not significantly associated with SUA in the
GUGC-based study, it was nominally significantly associated with
gout in the same study.
Functional annotations for novel loci. We searched for SNPs at
the newly identified loci associated with SUA that were associated
with gene expression level or amino acid substitution of protein
and that were in high LD (r
2of
≥0.8 in JPT of 1000 Genomes
phase 3) with sentinel SNPs and had a P value of <1 × 10
–6for
SUA in our meta-analysis. We identified two nonsynonymous
SNPs of SESN at the 1p35.3 locus and PNPLA3 at the 22q13.31
locus (Supplementary Table 4), and we found that six of the eight
novel loci harbor variants with expression quantitative trait loci
(eQTLs) for at least one tissue in the Genotype-Tissue Expression
(GTEx) database
35(Supplementary Data 4). The two
non-synonymous
SNPs,
rs738409
(I148M)
of
PNPLA3,
and
rs74896528 (P87S) of SESN2, were predicted by SIFT, PolyPhen2
HVAR, and PolyPhen2 HDIV to be damaging or probably
damaging.
Gene set enrichment analysis of SUA-associated loci. We
searched for genes whose expression level was associated with
SUA-associated SNPs in at least one tissue in the GTEx database.
We found that 24 of the 36 loci identified in the present study
harbor variants with eQTLs in at least one tissue in the GTEx
database. We also identified 71 positively correlated genes whose
expression level is increased by SUA-increasing alleles and 76
negatively correlated genes whose expression level is decreased by
SUA-increasing alleles (Supplementary Data 5). Functional
ana-lysis of the sets of positively correlated genes and negatively
correlated genes were performed with the Database for
Annota-tion, VisualizaAnnota-tion, and Integrated Discovery (DAVID)
36. For the
positively
correlated
genes,
the
terms
“Williams-Beuren
Table 1 Sentinel SNPs associated with SUA in Japanese as identi
fied in the meta-analysis
SNP Locus Chr Position Gene Alleles EAF Betaa± SE P value I2
Effect Noneffect Novel loci rs74896528 1p35.3 1 28598287 SESN2 T C 0.057 −0.057 ± 0.010 8.42 × 10⁻⁹ 0 rs10188118 2p25.3 2 653623 LOC105373352, TMEM18 C G 0.864 0.035 ± 0.006 8.60 × 10⁻⁹ 48.7 rs6774054 3q25.1 3 149211699 TM4SF4 A G 0.337 0.024 ± 0.004 1.58 × 10⁻⁸ 0 rs11952102 5q35.3 5 176740704 MXD3, LMAN2 A G 0.448 0.022 ± 0.004 4.24 × 10⁻⁸ 0 rs16898823 6p21.33 6 31106606 PSORS1C1, PSORS1C2 A T 0.900 0.037 ± 0.007 2.55 × 10⁻⁸ 0 rs8024067 15q26.1 15 93439224 LINC01578 T G 0.158 −0.034 ± 0.006 8.41 × 10⁻⁹ 40.9 rs6031598 20q13.12 20 43056149 HNF4A T G 0.378 −0.023 ± 0.004 2.90 × 10⁻⁸ 27.5 rs2281293 22q13.31 22 44334842 PNPLA3 T C 0.559 0.024 ± 0.004 4.99 × 10⁻⁹ 0
Loci also identified by BBJ28
rs811372 2p15 2 61429568 USP34 T C 0.367 0.026 ± 0.004 7.97 × 10⁻¹⁰ 4 rs10857147 4q21.21 4 81181072 PRDM8, FGF5 A T 0.699 0.032 ± 0.005 1.31 × 10⁻¹¹ 17.2 rs13230625 7p22.3 7 1286244 UNCX, MICALL2 A G 0.318 0.027 ± 0.004 4.82 × 10⁻¹⁰ 0 rs7835379 8q22.1 8 95975080 TP53INP1, NDUFAF6 A G 0.755 0.032 ± 0.005 7.41 × 10⁻¹² 46.6 rs9416703 10q21.1 10 60283008 BICC1 A C 0.525 −0.036 ± 0.004 1.70 × 10⁻¹⁸ 0 rs11202346 10q23.2 10 88908912 FAM35A T G 0.225 0.035 ± 0.005 4.12 × 10⁻¹² 0 rs1886603 10q26.11 10 119482303 EMX2, RAB11FIP2 A G 0.374 0.027 ± 0.004 3.22 × 10⁻¹¹ 0 rs2220970 11p15.4 11 9857749 SBF2 A G 0.342 0.024 ± 0.004 1.12 × 10⁻⁸ 0 rs963837 11p14.1 11 30749090 MPPED2, DCDC1 T C 0.656 0.028 ± 0.005 8.41 × 10⁻¹⁰ 5.6 rs6026578 20q13.32 20 57463472 LOC101927932 C G 0.278 0.028 ± 0.005 5.48 × 10⁻¹⁰ 0 Loci also identified by other studies
rs1797052 1q21.1 1 145727683 PDZK1 T C 0.185 0.041 ± 0.005 2.57 × 10⁻¹⁵ 0 rs4072037 1q22 1 155162067 MUC1 T C 0.828 −0.048 ± 0.005 6.93 × 10⁻²⁰ 62.7 rs1260326 2p23.3 2 27730940 GCKR T C 0.559 0.036 ± 0.004 7.56 × 10⁻¹⁹ 0 rs16856823 2q31.1 2 170200452 LRP2 A T 0.808 −0.039 ± 0.005 6.61 × 10⁻¹⁴ 0 rs6445559 3p21.1 3 53099466 SFMBT1, RFT1 A G 0.561 0.029 ± 0.004 2.53 × 10⁻¹² 2.6 rs7679724 4p16.1 4 9985376 SLC2A9 T G 0.586 0.130 ± 0.004 1.67 × 10−224 81.6 rs4148155 4q22.1 4 89054667 ABCG2 A G 0.705 −0.115 ± 0.004 2.05 × 10−149 0 rs2762353 6p22.2 6 25794431 SLC17A1 A G 0.160 −0.054 ± 0.005 8.68 × 10⁻²⁴ 11.5 rs9394948 6p21.1 6 43334755 ZNF318 A C 0.341 0.032 ± 0.004 1.65 × 10⁻¹³ 9 rs17145750 7q11.23 7 73026378 MLXIPL T C 0.102 −0.038 ± 0.007 5.85 × 10⁻⁹ 0 rs1828911 8q21.11 8 76462547 HNF4G T C 0.575 −0.038 ± 0.004 8.08 × 10⁻²¹ 0 rs57633992 11q13.1 11 64424967 NRXN2 A C 0.054 −0.668 ± 0.010 <1 × 10−300 68.8 rs79105258 12q24.12 12 111718231 CUX2 A C 0.254 −0.078 ± 0.005 1.91 × 10−56 0 rs73436803 15q24.2 15 75619201 GOLGA6D, COMMD4 T C 0.099 −0.043 ± 0.008 1.38 × 10⁻⁸ 0 rs4966024 15q26.3 15 99295570 IGF1R A G 0.486 −0.033 ± 0.004 4.43 × 10⁻¹⁶ 0 rs244423 16q22.1 16 69610002 NFAT5 A G 0.156 0.035 ± 0.006 2.00 × 10⁻¹⁰ 40.5 rs73575095 16q23.2 16 79750332 MAF, MAFTRR T C 0.719 0.035 ± 0.005 4.03 × 10⁻¹⁵ 0 rs9895661 17q23.2 17 59456589 BCAS3 T C 0.475 0.044 ± 0.005 9.20 × 10⁻²³ 0
Chr chromosome, SUA serum uric acid
10
a
b
c
d
e
f
g
h
rs74896528 rs6774054 rs16898823 rs6031598 rs2281293 rs8024067 rs11952102 rs10188118 EYA3 PTAFR TM4SF18 DPCR1GDAP1L1 FITM2 HNF4A C20orf62 ADA
EFCAB6 SULT4A1 PNPLA5 SAMM50 PNPLA3 PARVB HNF4A–AS1 LOC101927242 TTPAL PKIG MIR3646 R3HDML SERINC3 MUC22 HCG22 PSORS1C1 C6orf15 CDSN POU5F1 PSORS1C2 PSORS1C3 CCHCR1 TCF19 HCG27 HLA–C ASB9P1 LOC100507217 CHD2 MIR3175 RGMA MUC21 TM4SF1 TM4SF4 WWTR1 UNC5A ZNF346 NSD1 RGS14 PRELID1 F12 MXD3 LMAN2 DDX41 PRR7–AS1 PRR7 SLC34A1 FAM193B GRK6 DOK3 LOC202181
RAB24 PFN3 PDLIM7 B4GALT7
DBN1 TMED9 FAM153A FGFR4 HK3 UIMC1 WWTR1–AS1 TM4SF1–As1 DNAJC8 SESN2 ATPIF1 MED18 PHACTR4 TMEM18 LINC0115 0.8 r2 0.6 0.4 0.2 0.8 r2 0.6 0.4 0.2 0.8 r2 0.6 0.4 0.2 0.8 r2 0.6 0.4 0.2 0.8 r2 0.6 0.4 0.2 0.8 r2 0.6 0.4 0.2 0.8 r2 0.6 0.4 0.2 0.8 r2 0.6 0.4 0.2 8 –log 10 ( P v alue) 6 4 2 0 10 8 –log 10 ( P v alue) 6 4 2 0 10 8 –log 10 ( P v alue) 6 4 2 0 10 8 –log 10 ( P v alue) 6 4 2 0 10 8 –log 10 ( P v alue) 6 4 2 0 28.4 149.1 31 42.9 43 43.1 43.2 44.2 44.3 44.4 44.5 31.1 31.2 31.3 93.3 93.4 93.5 93.6 149.2 149.3 149.4 176.4 176.6 176.8 177 177.2 28.5 28.6 28.7 0.5 0.6 0.7 0.8 Position on chr1 (Mb) Position on chr3 (Mb) Position on chr6 (Mb) Position on chr15 (Mb) Position on chr20 (Mb) Position on chr22 (Mb) Position on chr5 (Mb) Position on chr2 (Mb) 3q25.1 6q21.33 20q13.12 22q13.31 15q26.1 1p35.3 100 Recombination r ate (cM/Mb) 80 60 40 20 0 100 Recombination r ate (cM/Mb) 80 60 40 20 0 100 Recombination r a te (cM/Mb) 80 60 40 20 0 100 Recombination r a te (cM/Mb) 80 60 40 20 0 100 Recombination r ate (cM/Mb) 80 60 40 20 0 10 8 –log 10 ( P v alue) 6 4 2 0 10 8 –log 10 ( P v alue) 6 4 2 0 10 8 –log 10 ( P v alue) 6 4 2 0 100 Recombination r ate (cM/Mb) 80 60 40 20 0 100 Recombination r a te (cM/Mb) 80 60 40 20 0 100 Recombination r a te (cM/Mb) 80 60 40 20 0 2p25.3 5q35.3
Fig. 2 Regional association plots for the eight novel loci identified in the meta-analysis of SUA. The vertical axis represents –log10(P value) for assessment of the association of each SNP with SUA. Panelsa–h present plots for chromosome (chr) 1p35.3, 2p25.3, 3q25.1, 5q35.3, 6p21.33, 15q26.1, 20q13.12, or 22q13.31, respectively. Colors indicate LD (r2) between each sentinel SNP and neighboring SNPs based on JPT of 1000 Genomes phase 3. SUA serum uric acid
syndrome”, “sodium”, “transport”, “sodium transport”, and
“alternative splicing” were enriched (Supplementary Table 5). For
the negatively correlated genes, the term
“Williams–Beuren
syn-drome” was enriched.
Comparison between Japanese and European GWASs for SUA.
SNPs located at 28 loci were recently found to show genome-wide
significant associations with SUA based on data from individuals
of European ancestry in the GUGC
24. We examined the results
obtained for these SNPs in our meta-analysis (Supplementary
Data 6). Twenty-one of these 25 SNPs showed nominal or
genome-wide significant associations with SUA in our
meta-analysis, with the same direction of effect size in both studies.
We compared the SNP-based heritability (h
2) of SUA in our
Japanese meta-analysis and the GUGC-based study
24. The
heritability estimates were calculated from summary statistics of
1,447,573 SNPs, which were assessed in both studies and have
MAF
≥1% in both studies. The h
2(standard error (SE)) estimates
were 14.0 % (4.3%) for our Japanese study and 14.4% (3.9%) for
the European study. Furthermore, we calculated the genetic
correlation between Japanese and European studies employing
the same data sets. The genetic correlation
ρ
ge(SE) was analyzed
(0.591 (0.294), P value
= 0.164), and was not significantly less
than 1.
Trans-ethnic meta-analysis with the use of GUGC-based study.
We performed the trans-ethnic analysis across our
meta-analysis and the GUGC-based study to carry out
fine-mapping
analysis and identify further novel loci associated with SUA. We
observed genome-wide significant (log
10(Bayes’ factor) of >6)
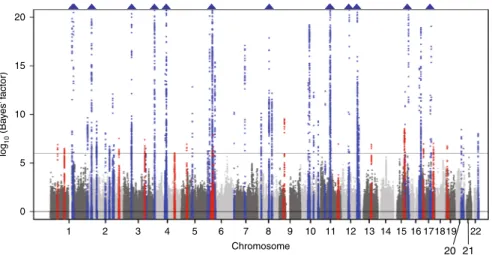
association signals at 59 loci (Fig.
3
), of which 15 were novel.
Shown in Supplementary Data 7 are sentinel SNPs with the
highest log
10(Bayes’ factor) for SUA at each of these 15 novel loci
(rs302684 of TRABD2B-SKINT1L, rs2765545 of CCDC18, rs715
of CPS1, rs9942075 of TFDP2, rs10471103 of
INPP4B-LOC105377623, rs461660 of RAI14, rs2760181 of KIAA0319,
rs6928482 of HLA-DQB1, rs10971419 of B4GALT1, rs2195525 of
USP2, rs626277 of DACH1, rs2957742 of MYO9A, rs12451900 of
ZBTB4, rs164009 of QRICH2, and rs1035941 of INSR).
Discussion
In a genome-wide meta-analysis performed with 121,745
Japa-nese subjects, we have here identified eight novel loci significantly
associated with SUA. Moreover,
five of these loci were replicated
in Caucasian populations.
Gout, which develops as a consequence of hyperuricemia, is a
form of arthritis known from the time of ancient Egypt
37, and
modern Japanese are genetically known to be more susceptible to
hyperuricemia and gout,
10,38. To our knowledge, the present
study is the largest genome-wide meta-analysis performed for
SUA to date, and it thus provides important insight into the
genetic background of hyperuricemia and gout.
Uric acid or urate is an end metabolite of purines such as
adenosine derived from ATP and guanine derived from DNA.
Urate is produced predominantly in the liver and is excreted by
the kidneys and the intestine
9,39,40. Genes for urate transporters
and proteins associated with cell metabolism might therefore be
expected to be associated with SUA. Indeed, urate transporter
genes such as SLC22A12 (also known as URAT1), SLC2A9
(GLUT9), and ABCG2 (BCRP) have been markedly associated
with SUA, hyperuricemia, and gout
7–12.
Among the eight novel loci identified in our study, TMEM18,
TM4SF4, MXD3, and HNF4A are related to cell metabolism or
proliferation. TMEM18 is a highly conserved gene related to
obesity and plays a role in the central control of appetite and body
weight regulation
41–43. TM4SF4 is associated with gallstone
dis-ease and has been implicated in both liver regeneration and
pancreas development
44,45. Both MXD3 and HNF4A encode
transcription factors. MXD3 forms a heterodimer with the
cofactor MAX and is thought to promote uncontrolled cell
pro-liferation and tumorigenesis
46,47. HNF4A is associated with
nonalcoholic steatohepatitis
48and plays a role in hepatic
gluco-neogenesis and lipid metabolism
49. In addition, HNF4A controls
gene expression in pancreatic islets, with HNF4A mutations
having been associated with maturity-onset diabetes of the young
type 1 and hyperinsulinemic hypoglycemia
50. Furthermore, three
of the eight novel loci identified in the present study harbor genes
related to oxidative stress and inflammation: SESN2, PSORS1C1,
and PNPLA3. SESN2 encodes a highly conserved stress-inducible
metabolic protein that protects cells from stressors such as
hypoxia, starvation, DNA damage, and oxidative stress
51,52.
PSORS1C1 and PSORS1C2 encode psoriasis susceptibility 1
can-didates 1 and 2, respectively. PSORS1C1 is implicated in synovial
inflammation and bone destruction in rheumatoid arthritis
53,
which, like gout, is a common type of arthritis. Its expression is
inhibited in synovial
fibroblasts affected by rheumatoid arthritis,
which results in a reduction in interleukin-17, osteoclastogenic
factor, and interleukin-1 levels as well as attenuation of cell
20 15 10 log 10 (Ba y es’ f actor) 5 0 1 2 3 4 5 6 7 8 Chromosome 9 10 11 12 13 14 15 16 171819 22 20 21
Fig. 3 Manhattan plot for the trans-ethnic meta-analysis of SUA. The horizontal line represents the genome-wide significance level (log10(Bayes’ factor) = 6). Loci shown in blue were identified by our Japanese meta-analysis and other studies and those in red indicate 15 novel loci identified in the trans-ethnic meta-analysis. Blue triangles represent loci containing SNPs with log10(Bayes’ factor) of >20. SUA serum uric acid
proliferation
54. PNPLA3 encodes a membrane protein located at
the surface of hepatocyte lipid droplets
55. A GWAS of
nonalco-holic fatty liver disease identified PNPLA3 as a major genetic
determinant of fatty liver and hepatic fat content
56. PNPLA3 is
also associated with inflammation, fibrosis, and the development
of hepatocellular carcinoma
55,57. Thus, novel loci associated with
SUA were also related to oxidative stress and inflammation.
Given that uric acid has an antioxidative effect
1,2, loci related to
oxidative stress or inflammation might also be expected to be
associated with SUA. However, further molecular functional
analyses are required to confirm these associations. The
func-tional relation of the last of the eight novel loci identified in the
present study, LINC01578, to SUA is unknown. Indeed,
LINC01578 encodes a long intergenic non-protein-coding RNA
of unknown function. It is also possible that a gene located near
LINC01578 is actually responsible for the observed association
with SUA.
Previous candidate analyses
7,8and GWASs
11,12,58of clinically
defined gout identified nonsynonymous variants of gout
sus-ceptibility genes such as ABCG2 (rs72552713, Q126X; rs2231142,
Q141K) and GCKR (rs1260326, L446P). SLC22A12 (URAT1) and
SLC2A9 (GLUT9) are also genetic loci that influence SUA and
encode urate transporters that mediate physiological urate
reab-sorption in the kidney
59,60. We previously showed that
dys-functional nonsynonymous variants of SLC22A12 and SLC2A9
are responsible for renal hypouricemia type 1
59,60and type 2
43,
respectively. The present study also identified missense SNPs at
two loci, rs738409 (I148M) of PNPLA3 and rs74896528 (P87S) of
SESN2, that are predicted to impair the function of the encoded
proteins (Supplementary Table 4). The rs738409 (I148M)
poly-morphism of PNPLA3 is in LD with rs2281293, which showed the
most significant association with SUA at this locus in our
genome-wide meta-analysis. The rs2281293 SNP of PNPLA3 is
also an eQTL for this gene (Supplementary Data 4). On the other
hand, rs74896528 of SESN2 has not been identified as an eQTL
(Supplementary Data 4), and its SNP was not reported in the
previous study based on GUGC data
24because of its low
fre-quency in Caucasian populations (Supplementary Data 2). These
results suggest that this missense (P87S) variant of SESN2
(rs74896528) is a novel locus that is associated with SUA
speci-fically in Japanese or Asian populations.
The 28 loci identified in the European population of the GUGC
study, SNPs at 21 loci showed a nominal or genome-wide
sig-nificant association with SUA in our meta-analysis
(Supplemen-tary Data 6), again with the same direction of effect size. The
SNP-based heritability for Japanese was 14.0%, and was similar to
the 14.6% seen in Europeans. The genetic correlation between
Japanese and Europeans was not significantly <1. These results
suggest the possibility that most genetic causal variants of SUA
are shared across ancestries.
The present study also identified 132 correlated genes whose
expression levels are associated with SUA-increasing alleles
(Supplementary Data 5). UniProt term enrichment analysis
showed that these correlated genes are enriched in genes related
to
“transport” (Supplementary Table 5). A novel locus, rs6031598
of HNF4A, is correlated with the expression level of HNF4A. Of
note, a noncoding genetic variant, rs1967017 of PDZK1, which
encodes a scaffold protein for urate transporters
61,62, has been
shown to be functionally linked to HNF4-dependent PDZK1
expression
63.
For SNP rs9394948 of ZNF318, ABCC10 (MRP7), an ABC
transporter gene, was a positively correlated gene, and SLC22A7
(OAT2), an SLC transporter gene, was a negatively correlated
gene (Supplementary Data 5). SLC22A7 encodes organic anion
transporter 2 (OAT2), which mediates urate transport
64and is
expressed in kidney and liver. Furthermore, for SNP rs11952102
of MXD3, RAB24, and PRELID1 were positively correlated genes,
and MXD3 was a negatively correlated gene. RAB24 is localized to
the endoplasmic reticulum and is thought to participate in
autophagosome maturation
65. RAB24 may influence SUA via
autophagy, because there is a report on relationship between SUA
and autophagy which is promoted by NLRP3 and results in
phagocytosis of urate crystals by human osteoblasts
66. PRELID1
encodes PRELI, which forms a complex with TRIAP1 and
mediates intramitochondrial transport of phosphatidic acid
67. It
is possible that PRELI may function as a urate transporter that
directly affects SUA or that it indirectly influences SUA via its
function as a phosphatidic acid transporter.
In trans-ethnic meta-analysis across our own meta-analysis
and the GUGC study, we have here identified 15 more novel loci
significantly associated with SUA. Out of these, rs2760181 of
KIAA0319 at 6p22.3 showed different direction of regression
coefficients between Japanese and European studies, but showed
genome-wide significant association (log
10Bayes’ factor >6).
Future studies will therefore be necessary to validate our
findings
in independent cohorts.
The present genome-wide meta-analysis of SUA in Japan
identified eight novel loci. Furthermore, trans-ethnic
meta-ana-lysis of SUA in the present study revealed 15 more novel loci
associated with SUA. The present study also demonstrated that
SUA is regulated by multiple
“transport”-related genes, that is,
not only urate transporter genes but also non-transporter genes
such as PDZK1 and HNF4A. Our
findings thus provide important
insight into SUA regulation and the pathogenesis of
hyperur-icemia and gout, and they provide a potential basis for the
development of new treatments for these diseases.
Methods
Study subjects and genotyping. We performed a genome-wide meta-analysis based on three Japanese cohorts including those of the J-MICC Study29,30, KING Study31,32, and BBJ Project33,34. An overview of the characteristics of the study populations is provided in Supplementary Table 1. Information regarding study-specific genotyping, imputation, and analysis tools is provided in Supplementary Table 2. Data and sample collection for the cohorts participating in the present study were approved by the respective research ethics committees. All participants provided written informed consent.
Details of cohorts. The Japan Multi-institutional Collaborative Cohort (J-MICC) Study was launched in 2005. Through March 2014, 92,642 Japanese participants aged 35 to 69 years had provided blood samples and lifestyle data based on a questionnaire after having given their informed consent29,30. The present study included 14,539 J-MICC Study participants randomly selected from the 12 targeted areas (Chiba, Shizuoka-Sakuragaoka, Shizuoka, Daiko, Okazaki, Aichi, Takashima, Kyoto, Tokushima, Fukuoka, Kagoshima, and Kyushu-KOPS (Kyushu Okinawa Population Study)). After preimputation quality control, 14,091 participants remained for the imputation process (Supplementary Table 2). SUA was measured with the uricase-peroxidase method or the uricase–3,5-dimethoxy-4-fluoroanilide (F-DAOS) method in 10,794 of the 14,091 participants. Individuals receiving treatment for hyperuricemia or gout were excluded. Finally, 10,621 participants remained for the association analysis (Supplementary Table 1). This study was approved by the ethics committees of Nagoya University Graduate School of Medicine (approval no. 939-14), Aichi Cancer Center, and all other participating institutions. All research procedures were conducted according to the Ethical Guidelines for Human Genome and Genetic Sequencing Research in Japan and the Declaration of Helsinki.
The Kita-Nagoya Genomic Epidemiology (KING) Study (ClinicalTrials.gov identifier NCT00262691) is an ongoing community-based prospective observational study of the genetic basis of cardiovascular disease and its risk factors31,32. It recruited 3975 Japanese subjects aged 50–80 years who underwent community-based annual health checkups between May 2005 and December 2007. A total of 2095 of the KING Study samples was included in the present study. SUA was measured with the uricase method (Mizuho Medy, Saga, Japan). Individuals under treatment for hyperuricemia or gout were excluded. The study was performed according to the guidelines of the Declaration of Helsinki; the study protocol was approved by the ethics committees of Aichi Gakuin University, Jichi Medical University, Nagoya University, and Kyushu University; and all participants provided written informed consent.
The BioBank Japan (BBJ) Project (http://biobankjp.org/english/index.html) was initiated in 2003 at the Institute of Medical Science, The University of Tokyo, and it
has constructed a large-scale, multi-institutional, hospital-based biobank. The BBJ collected DNA, serum, and clinical information from ~200,000 Japanese patients with any of 47 target diseases betweenfiscal years 2003 and 200733,34. Patients were recruited from 66 hospitals of 12 medical institutes throughout Japan (Osaka Medical Center for Cancer and Cardiovascular Diseases, Cancer Institute Hospital of Japanese Foundation for Cancer Research, Juntendo University, Tokyo Metropolitan Geriatric Hospital, Nippon Medical School, Nihon University School of Medicine, Iwate Medical University, Tokushukai Hospitals, Shiga University of Medical Science, Fukujuji Hospital, National Hospital Organization Osaka National Hospital, and Iizuka Hospital). All patients were diagnosed with one or more of the 47 target diseases by physicians at the cooperating hospitals. Clinical information, including SUA measurements, was collected through interviews and reviews of medical records with the use of a standard questionnaire. The present study included 109,029 individuals aged between 18 and 85 years with valid SUA measurements as described elsewhere28. Subjects receiving urate-lowering therapy (allopurinol, febuxostat, probenecid, or benzbromarone) or with renal insufficiency (estimated glomerularfiltration rate of <15 ml min–11.73 m–2) were excluded. We obtained written informed consent from all participants, and this study was approved by the ethics committees of RIKEN Center for Integrative Medical Sciences and the Institute of Medical Science, The University of Tokyo. Association analysis for SNPs and SUA. Individuals taking urate-lowering drugs were excluded from the present study. SUA was adjusted for age, sex, the top 10 principal components, and study-specific covariates in a linear regression model. We then standardized the resulting residuals. The association of the z-score of the residuals with SNP allele dose was tested by linear regression analysis. The effect sizes and standard errors estimated in linear regression analysis were used in the subsequent meta-analysis.
Quality control after genotype imputation. After genotype imputation, quality control was applied to each study. SNPs with an imputation quality of r2< 0.3 or a minor allele frequency of <0.005 were excluded. SNPs that passed quality control in both the J-MICC Study and BBJ cohorts were subjected to meta-analysis. To identify studies with inflated GWAS significance, which can result from population stratification, we computed the genomic control lambda68and the intercept of LD score regression69. We calculated the genomic control lambda in R. A study showing a score of >1.1 for both measures was regarded as inflated. Inflation was not detected in any study included in the present meta-analysis, and so genomic control adjustment was not applied.
Meta-analysis. The meta-analysis was performed with a total of 121,745 Japanese subjects from the three cohorts (Supplementary Table 1). The association results for each SNP across the studies were combined with METAL software70by the fixed-effects inverse-variance-weighted method. Heterogeneity of effect sizes was assessed with the I2index. The meta-analysis included 5,864,938 SNPs and the results from at least both the J-MICC Study and BBJ Project. The genome-wide significance level α was set to a P value <5 × 10⁻⁸.
Replication study for novel loci with the GUGC-based study. To employ a replication study and compare our meta-analysis with publicly available results from Europeans conducted by the GUGC, we downloaded the summary statistics from their website. The EAF of the HapMap project phase 2 CEU samples for each SNP was added to the summary statistics of the GUGC because the results of the GUGC study did not include EAFs. We excluded variants with MAF < 0.01. P-values for the GUGC study were corrected for genomic control (lambda= 1.12 for SUA and 1.03 for gout)24. Genomic inflation did not occur in the GUGC study because the intercepts of the LD score regression, based on the raw P-values, were 1.01 for SUA and 1.09 for gout. We therefore calculated the raw P values from the corrected P values, and used the raw P values as a replication study for novel loci in our meta-analysis. For the replication offive novel loci, the significance level α was determined by dividing 0.05 by the number of loci for Bonferroni correction (α = 0.05/5= 0.01).
Functional annotations. For prioritization of associated SNPs at the novel loci, we adopted a series of bioinformatics approaches to collate functional annotation. We first used ANNOVAR71to obtain an aggregate set of functional annotations— including gene location and impact of amino acid substitution based on the pre-diction tools SIFT and PolyPhen-2—for the sentinel SNPs and SNPs in high-LD (r2 of≥0.8 in JPT of 1000 Genomes phase 3) with the sentinel SNPs and with a P value of <1 × 10⁻⁶for SUA. We also examined these sentinel and high-LD SNPs for identification of eQTLs in 14 tissues considered relevant to SUA regulation using the GTEx v7 database. The significant criteria for eQTL were based on the GTEx project:21variants with a nominal P value below the gene-level threshold were regarded as significant. The gene level threshold was determined by the permu-tation test in the GTEx project21. UniProt term enrichment analysis for the sets of positively correlated genes and negatively correlated genes was performed with DAVID and with the threshold of a false discovery rate of <0.05 as calculated by the Benjamini–Hochberg adjustment method.
SNP-based heritability in Japanese and European samples. We estimated the SNP-based heritability of SUA for our Japanese meta-analysis and GUGC-based study24with the use of LD score regression69. As explained in our replication study section, the EAF of the HapMap project phase 2 CEU samples for each SNP was added to the summary statistics of the GUGC because the results of the GUGC study did not include EAFs. The heritability estimates were calculated from the summary statistics of 1,447,573 SNPs, which were assessed in both studies and have MAF≥ 1% in both studies and were not palindromic SNPs. The P values for the GUGC study were corrected for genomic control (lambda= 1.12)24. Genomic inflation did not occur in GUGC because the intercept of LD score regression based on the raw P values was 1.01. Thus, we used raw P values calculated from corrected P values. Furthermore, we calculated the genetic correlation between Japanese and Europeans using the same data sets. The genetic correlation was calculated with the use of Popcorn72.
Trans-ethnic meta-analysis with the use of GUGC-based study. For our trans-ethnic meta-analysis across our meta-analysis and the GUGC-based study, we used MANTRA v.1 software73, which has been developed for trans-ethnic meta-analysis allowing heterogeneity in allelic effects. The trans-ethnic meta-analysis was cal-culated from the summary statistics of 1,986,983 SNPs, which were assessed in both studies and have MAF≥ 1% in both. In our meta-analysis, the effect sizes were calculated from a linear regression analysis in which the z-score of residual values of SUA values after adjustment for covariates was used as a dependent variable. In the GUGC project, the effect sizes were calculated from the linear regression analysis in which the SUA value was used as a dependent variable. The scale of effect size for these studies was therefore different. Thus, before the MANTRA analysis, the effect sizes and standard errors of the GUGC study were divided by the standard deviation of SUA in the GUGC study (=1.4 mg/dl) to approximate the scale of effect sizes. A prior model of the relatedness between the studies was estimated by employing a dmatcal script in the software using the allele frequency of the analyzed SNPs. We regarded log10Bayes’ factor >6 as a significant threshold in line with the previous simulation study74.
Reporting Summary. Further information on experimental design is available in the Nature Research Reporting Summary linked to this article.
Data availability
The summary statistics of our genome-wide meta-analysis based on three Japanese cohorts is available at the National Bioscience Database Center (Research ID: hum0167. v1.meta.v1).
Received: 29 June 2018 Accepted: 22 January 2019
References
1. Ames, B. N., Cathcart, R., Schwiers, E. & Hochstein, P. Uric acid provides an antioxidant defense in humans against oxidant- and radical-caused aging and cancer: a hypothesis. Proc. Natl Acad. Sci. USA 78, 6858–6862 (1981). 2. Matsuo, H. et al. ABCG2 variant has opposing effects on onset ages of
Parkinson’s disease and gout. Ann. Clin. Transl. Neurol. 2, 302–306 (2015). 3. Dalbeth, N., Merriman, T. R. & Stamp, L. K. Gout. Lancet 388, 2039–2052
(2016).
4. Choi, H. K., Atkinson, K., Karlson, E. W., Willett, W. & Curhan, G. Alcohol intake and risk of incident gout in men: a prospective study. Lancet 363, 1277–1281 (2004).
5. Choi, H. K., Atkinson, K., Karlson, E. W., Willett, W. & Curhan, G. Purine-rich foods, dairy and protein intake, and the risk of gout in men. N. Engl. J. Med. 350, 1093–1103 (2004).
6. Choi, H. K. & Curhan, G. Soft drinks, fructose consumption, and the risk of gout in men: prospective cohort study. BMJ 336, 309–312 (2008).
7. Matsuo, H. et al. Common defects of ABCG2, a high-capacity urate exporter, cause gout: a function-based genetic analysis in a Japanese population. Sci. Transl. Med. 1, 5ra11 (2009).
8. Woodward, O. M. et al. Identification of a urate transporter, ABCG2, with a common functional polymorphism causing gout. Proc. Natl Acad. Sci. USA 106, 10338–10342 (2009).
9. Ichida, K. et al. Decreased extra-renal urate excretion is a common cause of hyperuricemia. Nat. Commun. 3, 764 (2012).
10. Nakayama, A. et al. Common dysfunctional variants of ABCG2 have stronger impact on hyperuricemia progression than typical environmental risk factors. Sci. Rep. 4, 5227 (2014).
11. Matsuo, H. et al. Genome-wide association study of clinically defined gout identifies multiple risk loci and its association with clinical subtypes. Ann. Rheum. Dis. 75, 652–659 (2016).
12. Nakayama, A. et al. GWAS of clinically defined gout and subtypes identifies multiple susceptibility loci that include urate transporter genes. Ann. Rheum. Dis. 76, 869–877 (2017).
13. Feig, D. I., Kang, D. H. & Johnson, R. J. Uric acid and cardiovascular risk. N. Engl. J. Med. 359, 1811–1821 (2008).
14. Edwards, N. L. The role of hyperuricemia in vascular disorders. Curr. Opin. Rheumatol. 21, 132–137 (2009).
15. Li, S. et al. The GLUT9 gene is associated with serum uric acid levels in Sardinia and Chianti cohorts. PLoS Genet. 3, e194 (2007).
16. Döring, A. et al. SLC2A9 influences uric acid concentrations with pronounced sex-specific effects. Nat. Genet. 40, 430–436 (2008).
17. Vitart, V. et al. SLC2A9 is a newly identified urate transporter influencing serum urate concentration, urate excretion and gout. Nat. Genet. 40, 437–442 (2008). 18. McArdle, P. F. et al. Association of a common nonsynonymous variant in
GLUT9 with serum uric acid levels in old order amish. Arthritis Rheum. 58, 2874–2881 (2008).
19. Dehghan, A. et al. Association of three genetic loci with uric acid concentration and risk of gout: a genome-wide association study. Lancet 372, 1953–1961 (2008).
20. Kolz, M. et al. Meta-analysis of 28,141 individuals identifies common variants withinfive new loci that influence uric acid concentrations. PLoS Genet. 5, e1000504 (2009).
21. Yang, Q. et al. Multiple genetic loci influence serum urate levels and their relationship with gout and cardiovascular disease risk factors. Circ. Cardiovasc. Genet. 3, 523–530 (2010).
22. Tin, A. et al. Genome-wide association study for serum urate concentrations and gout among African Americans identifies genomic risk loci and a novel URAT1 loss-of-function allele. Hum. Mol. Genet. 20, 4056–4068 (2011). 23. Sulem, P. et al. Identification of low-frequency variants associated with gout
and serum uric acid levels. Nat. Genet. 43, 1127–1130 (2011). 24. Köttgen, A. et al. Genome-wide association analyses identify 18 new loci
associated with serum urate concentrations. Nat. Genet. 45, 145–154 (2013). 25. Kamatani, Y. et al. Genome-wide association study of hematological and
biochemical traits in a Japanese population. Nat. Genet. 42, 210–215 (2010). 26. Okada, Y. et al. Meta-analysis identifies multiple loci associated with kidney
function-related traits in east Asian populations. Nat. Genet. 44, 904–909 (2012).
27. Reginato, A. M., Mount, D. B., Yang, I. & Choi, H. K. The genetics of hyperuricaemia and gout. Nat. Rev. Rheumatol. 8, 610–621 (2012). 28. Kanai, M. et al. Genetic analysis of quantitative traits in the Japanese
population links cell types to complex human diseases. Nat. Genet. 50, 390–400 (2018).
29. Hamajima, N. & Group, J.-M. S. The Japan Multi-Institutional Collaborative Cohort Study (J-MICC Study) to detect gene-environment interactions for cancer. Asian Pac. J. Cancer Prev. 8, 317–323 (2007).
30. Wakai, K. et al. Profile of participants and genotype distributions of 108 polymorphisms in a cross-sectional study of associations of genotypes with lifestyle and clinical factors: a project in the Japan Multi-Institutional Collaborative Cohort (J-MICC) Study. J. Epidemiol. 21, 223–235 (2011). 31. Asano, H. et al. Plasma resistin concentration determined by common
variants in the resistin gene and associated with metabolic traits in an aged Japanese population. Diabetologia 53, 234–246 (2010).
32. Nakatochi, M. et al. The ratio of adiponectin to homeostasis model assessment of insulin resistance is a powerful index of each component of metabolic syndrome in an aged Japanese population: results from the KING Study. Diabetes Res. Clin. Pract. 92, e61–e65 (2011).
33. Nagai, A. et al. Overview of the BioBank Japan Project: study design and profile. J. Epidemiol. 27, S2–S8 (2017).
34. Hirata, M. et al. Cross-sectional analysis of BioBank Japan clinical data: A large cohort of 200,000 patients with 47 common diseases. J. Epidemiol. 27, S9–S21 (2017).
35. GTEx Consortium et al. Genetic effects on gene expression across human tissues. Nature 550, 204–213 (2017).
36. Huang da, W., Sherman, B. T. & Lempicki, R. A. Systematic and integrative analysis of large gene lists using DAVID bioinformatics resources. Nat. Protoc. 4, 44–57 (2009).
37. Nuki, G. & Simkin, P. A. A concise history of gout and hyperuricemia and their treatment. Arthritis Res. Ther. 8(Suppl 1), S1 (2006).
38. Okada, Y. et al. Deep whole-genome sequencing reveals recent selection signatures linked to evolution and disease risk of Japanese. Nat. Commun. 9, 1631 (2018).
39. Matsuo, H. et al. ABCG2 dysfunction causes hyperuricemia due to both renal urate underexcretion and renal urate overload. Sci. Rep. 4, 3755 (2014). 40. Matsuo, H. et al. Hyperuricemia in acute gastroenteritis is caused by decreased
urate excretion via ABCG2. Sci. Rep. 6, 31003 (2016).
41. Thorleifsson, G. et al. Genome-wide association yields new sequence variants at seven loci that associate with measures of obesity. Nat. Genet. 41, 18–24 (2009).
42. Almen, M. S. et al. The obesity gene, TMEM18, is of ancient origin, found in majority of neuronal cells in all major brain regions and associated with obesity in severely obese children. BMC Med. Genet. 11, 58 (2010). 43. Larder, R. et al. Obesity-associated gene TMEM18 has a role in the central
control of appetite and body weight regulation. Proc. Natl Acad. Sci. USA 114, 9421–9426 (2017).
44. Anderson, K. R. et al. The L6 domain tetraspanin Tm4sf4 regulates endocrine pancreas differentiation and directed cell migration. Development 138, 3213–3224 (2011).
45. Joshi, A. D. et al. Four susceptibility loci for gallstone disease identified in a meta-analysis of genome-wide association studies. Gastroenterology 151, 351–363 e28 (2016).
46. Satake, N. et al. Targeted therapy with MXD3 siRNA, anti-CD22 antibody and nanoparticles for precursor B-cell acute lymphoblastic leukaemia. Br. J. Haematol. 167, 487–499 (2014).
47. Barisone, G. A., Yun, J. S. & Diaz, E. From cerebellar proliferation to tumorigenesis: new insights into the role of Mad3. Cell Cycle 7, 423–427 (2008).
48. Baciu, C. et al. Systematic integrative analysis of gene expression identifies HNF4A as the central gene in pathogenesis of non-alcoholic steatohepatitis. PLoS ONE 12, e0189223 (2017).
49. Chandra, V. et al. Multidomain integration in the structure of the HNF-4alpha nuclear receptor complex. Nature 495, 394–398 (2013).
50. Yoon, J. C. et al. Control of hepatic gluconeogenesis through the transcriptional coactivator PGC-1. Nature 413, 131–138 (2001).
51. Lee, J. H., Budanov, A. V. & Karin, M. Sestrins orchestrate cellular metabolism to attenuate aging. Cell Metab. 18, 792–801 (2013).
52. Pasha, M., Eid, A. H., Eid, A. A., Gorin, Y. & Munusamy, S. Sestrin2 as a novel biomarker and therapeutic target for various diseases. Oxid. Med. Cell Longev. 2017, 3296294 (2017).
53. Conigliaro, P. et al. Polymorphisms in STAT4, PTPN2, PSORS1C1 and TRAF3IP2 genes are associated with the response to TNF inhibitors in patients with rheumatoid arthritis. PLoS ONE 12, e0169956 (2017). 54. Ciccacci, C. et al. Polymorphisms in STAT-4, IL-10, PSORS1C1, PTPN2 and
MIR146A genes are associated differently with prognostic factors in Italian patients affected by rheumatoid arthritis. Clin. Exp. Immunol. 186, 157–163 (2016).
55. Kawaguchi, T. et al. Risk estimation model for nonalcoholic fatty liver disease in the Japanese using multiple genetic markers. PLoS ONE 13, e0185490 (2018).
56. Romeo, S. et al. Genetic variation in PNPLA3 confers susceptibility to nonalcoholic fatty liver disease. Nat. Genet. 40, 1461–1465 (2008). 57. Valenti, L., Dongiovanni, P., Ginanni Corradini, S., Burza, M. A. & Romeo, S.
PNPLA3 I148M variant and hepatocellular carcinoma: a common genetic variant for a rare disease. Dig. Liver Dis. 45, 619–624 (2013).
58. Li, C. et al. Genome-wide association analysis identifies three new risk loci for gout arthritis in Han Chinese. Nat. Commun. 6, 7041 (2015).
59. Enomoto, A. et al. Molecular identification of a renal urate anion exchanger that regulates blood urate levels. Nature 417, 447–452 (2002).
60. Matsuo, H. et al. Mutations in glucose transporter 9 gene SLC2A9 cause renal hypouricemia. Am. J. Hum. Genet. 83, 744–751 (2008).
61. Higashino, T. et al. Common variant of PDZ domain containing 1 (PDZK1) gene is associated with gout susceptibility: A replication study and meta-analysis in Japanese population. Drug Metab. Pharmacokinet. 31, 464–466 (2016).
62. Ichida, K. What lies behind serum urate concentration? Insights from genetic and genomic studies. Genome Med. 1, 118 (2009).
63. Ketharnathan, S. et al. A non-coding genetic variant maximally associated with serum urate levels is functionally linked to HNF4A-dependent PDZK1 expression. Hum Mol Genet, 27, 3964–3973 (2018).
64. Sato, M. et al. Renal secretion of uric acid by organic anion transporter 2 (OAT2/SLC22A7) in human. Biol. Pharm. Bull. 33, 498–503 (2010). 65. Ao, X., Zou, L. & Wu, Y. Regulation of autophagy by the Rab GTPase
network. Cell Death Differ. 21, 348–358 (2014).
66. Allaeys, I., Marceau, F. & Poubelle, P. E. NLRP3 promotes autophagy of urate crystals phagocytized by human osteoblasts. Arthritis Res. Ther. 15, R176 (2013).
67. Potting, C. et al. TRIAP1/PRELI complexes prevent apoptosis by mediating intramitochondrial transport of phosphatidic acid. Cell Metab. 18, 287–295 (2013).
68. Devlin, B. & Roeder, K. Genomic control for association studies. Biometrics 55, 997–1004 (1999).
69. Bulik-Sullivan, B. K. et al. LD Score regression distinguishes confounding from polygenicity in genome-wide association studies. Nat. Genet. 47, 291–295 (2015).
70. Willer, C. J., Li, Y. & Abecasis, G. R. METAL: fast and efficient meta-analysis of genomewide association scans. Bioinformatics 26, 2190–2191 (2010).
71. Wang, K., Li, M. & Hakonarson, H. ANNOVAR: functional annotation of genetic variants from high-throughput sequencing data. Nucleic Acids Res. 38, e164 (2010).
72. Brown, B. C., Ye, C. J., Price, A. L. & Zaitlen, N. Transethnic genetic-correlation estimates from summary statistics. Am. J. Hum. Genet. 99, 76–88 (2016).
73. Morris, A. P. Transethnic meta-analysis of genomewide association studies. Genet. Epidemiol. 35, 809–822 (2011).
74. Wang, X. et al. Comparing methods for performing trans-ethnic meta-analysis of genome-wide association studies. Hum. Mol. Genet. 22, 2303–2311 (2013).
Acknowledgements
We thank all subjects for their involvement in the study; staff of the institutions parti-cipating in the J-MICC Study, BBJ Project, and KING Study for their assistance in collection of samples and clinical information; Y. Mitsuda and K. Shibata (Department of Preventive Medicine, Nagoya University Graduate School of Medicine) for technical assistance; K. Gotanda, M. Miyazawa, and R. Sugiyama (National Defense Medical College) for discussion; and N. Hamajima (Nagoya University Graduate School of Medicine) for sample collection. We thank A.P. Morris for providing us with the MANTRA software. The present study was supported by grants from the Ministry of Education, Culture, Sports, Science, and Technology (MEXT) of Japan including KAKENHI grants (nos. 25293145 and 15K15227); the Ministry of Health, Labor, and Welfare of Japan; the Ministry of Defense of Japan; the Japan Society for the Promotion of Science (JSPS); the Kawano Masanori Memorial Foundation for Promotion of Pediatrics; and the Gout Research Foundation of Japan. The KING Study was supported in part by Grants-in-Aid from MEXT (nos. 24390169, 16H05250, 25293144, 15K19242, 16H06277, and 18K06942) as well as by a grant from the Funding Program for Next-Generation World-Leading Researchers (NEXT Program, no. LS056). The J-MICC Study was supported by Grants-in-Aid for Scientific Research from MEXT, including those for Priority Areas of Cancer (no. 17015018) and Innovative Areas (no. 221S0001), as well as by a JSPS KAKENHI grant (no. 16H06277). This study was supported in part by funding from the BioBank Japan Project from the Japan Agency for Medical Research and Development, and the Ministry of Education, Culture, Sports, Science and Technology.
Author contributions
M. Nakatochi, A.H., Y.O. and H. Matsuo conceived and designed the study. A.N., Y. Kawamura, M. Kubo, Y. Kamatani, and N.S. contributed to research design. M. Nakatochi, S.I., K.Y., N.K., T.M. and M.Y. collected and analyzed clinical data of the KING Study. M. Nakatochi, A.H., H.I., N.F., R.O., S.K., Y. Nishida, C.S., R.I., T. Takezaki,
E.O., D.M., T. Nishiyama, S. Suzuki, N.T., Y. Kita, K.E., K.K., H.U., K.A., I.O., K. Matsuo, Y. Nakamura, H. Mikami, T. Tamura, M. Naito, and K.W. collected and analyzed clinical data of the J-MICC Study. M. Kanai, M.A., M.H., K. Matsuda, Y.M., M. Kubo, Y. Kamatani, and Y.O. collected and analyzed clinical data of the BBJ Project. M. Nakatochi, M. Kanai, Y. Kamatani, and Y.O. performed statistical analysis. A.N., Y. Kawamura, S. Shimizu, K.Y., M. Kawaguchi, M. Nakajima, M.T., and H. Matsuo analyzed data. H. Matsuo organized this collaborative study. H.N., T. Nakamura, N.K., K. Matsuda, Y.M., T.M., N.S., M.Y. and K.W. provided intellectual input and assisted with preparation of the manuscript. M. Nakatochi, M. Kanai, A.N., A.H., Y. Kawamura, Y.O. and H. Matsuo wrote the manuscript.
Additional information
Supplementary informationaccompanies this paper at https://doi.org/10.1038/s42003-019-0339-0.
Competing interests:The authors declare no competing interests.
Reprints and permissioninformation is available online athttp://npg.nature.com/ reprintsandpermissions/
Publisher’s note: Springer Nature remains neutral with regard to jurisdictional claims in published maps and institutional affiliations.
Open Access This article is licensed under a Creative Commons Attribution 4.0 International License, which permits use, sharing, adaptation, distribution and reproduction in any medium or format, as long as you give appropriate credit to the original author(s) and the source, provide a link to the Creative Commons license, and indicate if changes were made. The images or other third party material in this article are included in the article’s Creative Commons license, unless indicated otherwise in a credit line to the material. If material is not included in the article’s Creative Commons license and your intended use is not permitted by statutory regulation or exceeds the permitted use, you will need to obtain permission directly from the copyright holder. To view a copy of this license, visithttp://creativecommons.org/ licenses/by/4.0/.
© The Author(s) 2019
Masahiro Nakatochi
1, Masahiro Kanai
2,3,4, Akiyoshi Nakayama
5,6, Asahi Hishida
7, Yusuke Kawamura
5,8,
Sahoko Ichihara
9, Masato Akiyama
2,10, Hiroaki Ikezaki
11, Norihiro Furusyo
11, Seiko Shimizu
5, Ken Yamamoto
12,
Makoto Hirata
13, Rieko Okada
7, Sayo Kawai
7, Makoto Kawaguchi
5,14, Yuichiro Nishida
15,
Chisato Shimanoe
15, Rie Ibusuki
16, Toshiro Takezaki
16, Mayuko Nakajima
5, Mikiya Takao
5,17, Etsuko Ozaki
18,
Daisuke Matsui
18, Takeshi Nishiyama
19, Sadao Suzuki
19, Naoyuki Takashima
20, Yoshikuni Kita
21,
Kaori Endoh
22, Kiyonori Kuriki
22, Hirokazu Uemura
23, Kokichi Arisawa
23, Isao Oze
24, Keitaro Matsuo
24,25,
Yohko Nakamura
26, Haruo Mikami
26, Takashi Tamura
7, Hiroshi Nakashima
27, Takahiro Nakamura
28,
Norihiro Kato
29, Koichi Matsuda
30, Yoshinori Murakami
31, Tatsuaki Matsubara
32, Mariko Naito
7,33,
Michiaki Kubo
34, Yoichiro Kamatani
2,35, Nariyoshi Shinomiya
5, Mitsuhiro Yokota
36, Kenji Wakai
7,
Yukinori Okada
2,3,37& Hirotaka Matsuo
51Data Science Division, Data Coordinating Center, Department of Advanced Medicine, Nagoya University Hospital, Nagoya 466-8560, Japan.
2Laboratory for Statistical Analysis, RIKEN Center for Integrative Medical Sciences, Yokohama 230-0045, Japan.3Department of Statistical
Genetics, Osaka University Graduate School of Medicine, Suita 565-0871, Japan.4Department of Biomedical Informatics, Harvard Medical School,
Boston, MA 02115, USA.5Department of Integrative Physiology and Bio-Nano Medicine, National Defense Medical College, Tokorozawa 359-8513,
Japan.6Medical Squadron, Air Base Group, Western Aircraft Control and Warning Wing, Japan Air Self-Defense Force, Kasuga 816-0804, Japan.
7Department of Preventive Medicine, Nagoya University Graduate School of Medicine, Nagoya 466-8550, Japan.8Department of General
Medicine, National Defense Medical College, Tokorozawa 359-8513, Japan.9Department of Environmental and Preventive Medicine, Jichi Medical
University School of Medicine, Shimotsuke 329-0498, Japan.10Department of Ophthalmology, Graduate School of Medical Sciences, Kyushu
University, Fukuoka 812-8582, Japan.11Department of General Internal Medicine, Kyushu University Hospital, Fukuoka 812-8582, Japan.
12Department of Medical Biochemistry, Kurume University School of Medicine, Kurume 830-0011, Japan.13Laboratory of Genome Technology,
Institute of Medical Science, The University of Tokyo, Tokyo 108-8639, Japan.14Department of Urology, National Defense Medical College,
Island and Community Medicine, Kagoshima University Graduate School of Medical and Dental Sciences, Kagoshima 890-8544, Japan.
17Department of Surgery, National Defense Medical College, Tokorozawa 359-8513, Japan.18Department of Epidemiology for Community Health
and Medicine, Kyoto Prefectural University of Medicine, Kyoto 602-8566, Japan.19Department of Public Health, Nagoya City University Graduate
School of Medical Sciences, Nagoya 467-8602, Japan.20Department of Health Science, Shiga University of Medical Science, Otsu 520-2192,
Japan.21Department of Nursing, Tsuruga City College of Nursing, Fukui 914-8501, Japan.22Laboratory of Public Health, Division of Nutritional
Sciences, School of Food and Nutritional Sciences, University of Shizuoka, Shizuoka 422-8526, Japan.23Department of Preventive Medicine,
Institute of Biomedical Sciences, Tokushima University Graduate School, Tokushima 770-8503, Japan.24Division of Cancer Epidemiology and
Prevention, Aichi Cancer Center Research Institute, Nagoya 464-8681, Japan.25Department of Epidemiology, Nagoya University Graduate School
of Medicine, Nagoya 466-8550, Japan.26Cancer Prevention Center, Chiba Cancer Center Research Institute, Chiba 260-8717, Japan.
27Department of Preventive Medicine and Public Health, National Defense Medical College, Tokorozawa 359-8513, Japan.28Laboratory for
Mathematics, National Defense Medical College, Tokorozawa 359-8513, Japan.29Department of Gene Diagnostics and Therapeutics, Research
Institute, National Center for Global Health and Medicine, Tokyo 162-8655, Japan.30Department of Computational Biology and Medical Sciences,
Graduate School of Frontier Sciences, The University of Tokyo, Tokyo 108-8639, Japan.31Division of Molecular Pathology, Institute of Medical
Science, The University of Tokyo, Tokyo 108-8639, Japan.32Department of Internal Medicine, School of Dentistry, Aichi Gakuin University, Nagoya
464-8651, Japan.33Department of Oral Epidemiology, Hiroshima University Graduate School of Biomedical & Health Sciences, Hiroshima
734-8553, Japan.34RIKEN Center for Integrative Medical Sciences, Yokohama 230-0045, Japan.35Center for Genomic Medicine, Kyoto University
Graduate School of Medicine, Kyoto 606-8507, Japan.36Department of Genome Science, School of Dentistry, Aichi Gakuin University, Nagoya
464-8651, Japan.37Laboratory of Statistical Immunology, Immunology Frontier Research Center (WPI-IFReC), Osaka University, Suita 565-0871,