Introduction
権利
Copyrights 日本貿易振興機構(ジェトロ)アジア
経済研究所 / Institute of Developing
Economies, Japan External Trade Organization
(IDE-JETRO) http://www.ide.go.jp
シリーズタイトル(英
)
Occasional Papers Series
シリーズ番号
41
journal or
publication title
Electoral Volatility in Turkey - Cleavages vs.
the Economy
page range
1-8
year
2007
Introduction
Among the developing countries, Turkey stands out for its half-century history of multiparty democracy despite two brief military interventions (1960–61 and 1980– 83). Thus, “since the first transition to democracy in 1950, Turkish politics have largely been party politics” (Özbudun 2000, p. 9). Its party system, however, has displayed growing electoral volatility, especially since the 1980s. This study seeks to answer the following puzzle: why is electoral volatility persistently high and even increasing, after five decades of multiparty politics?
Party-System Institutionalization and Electoral Volatility
Electoral volatility is a major conventional measurement1 of the tendency for voters to
change their party support from election to election. It is calculated as the sum of absolute differences in the party vote percentage between two consecutive elections divided by two (Pedersen 1979).2 It primarily measures the stability of the party
system. Longitudinal data on electoral volatility have been widely used to measure the level of party-system institutionalization.3
Bartolini and Mair (1990) showed that electoral volatility in Western democracies points to party-system stability in the long run. Electoral volatility in thirteen Western democracies during the 1885–1985 period4 was 8.6 percent on average.5 Although
electoral volatility in Western democracies is said to have increased in the 1990s, the mean volatility for eighteen countries during the 1990–94 period was still 12.9 per-cent (Table 1-1).
Newly democratized countries initially have high electoral volatility, but it tends to decline in the consolidation process. Although electoral volatility may rise later if an electoral realignment occurs,6 this kind of instability is a temporary phenomenon.
2 INTRODUCTION
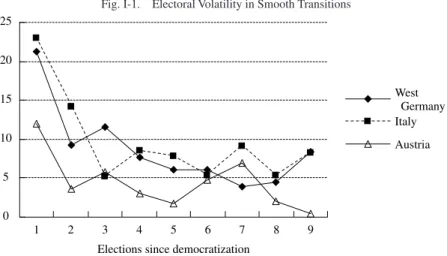
Both Figure I-1 and Figure I-2 include countries that were part of either the second wave or the third wave of democratization and held periodic competitive elections at least seven times since the transition election (Huntington 1991). Whether the demo-cratic transitions were smooth (Figure I-1) or bumpy (Figure I-2), electoral volatility was high in early elections and declined in subsequent ones, only sporadically surging during electoral realignments.
For the following reasons, Figure I-1 and Figure I-2 exclude the countries in Huntington’s list of countries in the second and third waves of democratization whose democracy did not break down afterward. First, during the Second World War, Bel-gium, Denmark, France, Luxemburg, the Netherlands, and Norway were either occu-pied by Nazi Germany or governed by a German proxy. It was natural for these countries not to experience high electoral volatility in the democratizing elections, since the prewar political parties remained intact. For a similar reason, India as part of the third wave is also excluded since the emergency regime 1975–77 that preceded its democratization was more of a suspension of democracy than an authoritarian politi-cal system.
Second, the Latin American countries have presidential systems. Electoral volatil-ity (both for the parliament and particularly for the presidency) tends to be higher in presidential than in parliamentary systems7 since winning the government does not
require a legislative majority (Lijphart 1992, Linz and Valenzuela 1994). Presidential candidates thus do not have a strong incentive to rely on well-organized political
TABLE I-1
ELECTORAL VOLATILITYINTHE WESTERN DEMOCRACIES, 1885–1997
Pre-1918 1918–44 1945–65 1966–85 1980–84 1985–89 1990–94 1995–97 Austria — 9.7 5.2 3.4 4.6 6.3 11.2 4.0 Belgium — 8.3 9.4 7.7 16.4 7.1 13.0 6.3 Denmark 6.9 5.5 8.7 13.5 11.7 8.0 11.6 — Finland 3.0 6.7 5.0 8.4 10.3 6.9 12.4 10.8 France 25.3 13.7 16.3 9.3 13.5 10.5 19.1 4.0 Germany 9.5 17.8 12.4 5.8 6.5 5.9 6.3 — Greece — — — — 27.2 5.7 8.1 8.9 Iceland — — — — 10.4 23.6 13.3 11.6 Ireland — 13.3 10.7 5.1 5.5 15.4 15.4 9.1 Italy 8.1 — 12.7 7.2 8.3 8.4 28.6 — Luxembourg — — — — 15.2 14.6 5.6 — Netherlands 10.4 8.4 5.2 11.0 9.1 7.8 21.5 — Norway 8.4 9.0 4.8 10.4 11.2 9.9 14.8 16.2 Portugal — — — — 7.3 22.3 9.6 20.2 Spain — — — — 39.0 7.3 10.5 5.7 Sweden 9.5 9.0 5.0 6.7 7.9 7.5 12.8 — Switzerland 7.9 8.6 3.3 6.3 6.1 8.0 7.4 7.4 U.K. 4.5 10.9 4.6 6.7 11.1 3.9 5.1 12.6 Mean 9.4 10.1 7.9 7.8 11.3 10.2 12.9 —
Source: Compiled by the author from Bartolini and Mair (1990, p. 111, Table 4.3) for the 1885–1985 period and Svante and Lane (1998, p. 31, Table 2.5) for the 1980–97 period.
parties. Particularly in democratizing countries, a strong presidency and a weak party system give rise to delegative democracy (O’Donnell 1994, pp. 55–59). Third, a few remaining countries could not be included due to a lack of data on volatility. In sum, the (re)-introduction of a parliamentary system after a certain period of undemocratic rule brought about high electoral volatility in initial elections, but repeated elections contributed to a long-term decline in electoral volatility.
Persistent Volatility in Turkey
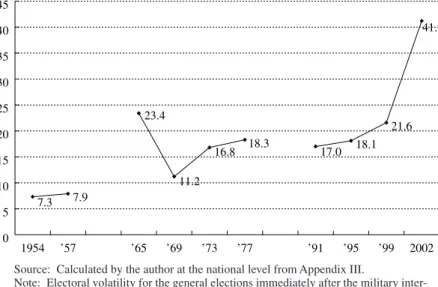
By contrast, electoral volatility in parliamentary Turkey has been consistently high, especially since 1961. During the 1961–2002 period, mean electoral volatility was 21.0 (Figure I-3).8 In 1960, the military overthrew the increasingly authoritarian
Democrat Party (Demokrat Parti, DP) government, disbanded the party and put its leaders on trial in a military court. At the same time, the military government quickly held a transition election in 1961 after introducing a liberal constitution and a propor-tional representation system intended to prevent a tyranny by the majority.
Relatively low electoral volatility in the 1950s may be primarily attributed to the majoritarian electoral system with (province-based) plural-member constituencies that effectively limited the number of political parties participating in general elec-tions. Since the first party in the constituency would win all the seats allocated for the
0 5 10 15 20 25
Elections since democratization
West Germany Italy Austria
1 2 3 4 5 6 7 8 9
Fig. I-1. Electoral Volatility in Smooth Transitions
Source: Compiled by the author from Bartolini and Mair (1990, Appendix 2).
Note: Election years are shown in the following table, which was compiled by the author from the above source.
Elections since democratization
0 1 2 3 4 5 6 7 8 9
Germany 1949 1953 1957 1961 1965 1969 1972 1976 1980 1983 Italy 1945 1948 1953 1958 1963 1968 1972 1976 1979 1983 Austria 1945 1949 1953 1956 1959 1962 1966 1970 1971 1975
4 INTRODUCTION
constituency, electoral competition usually involved two major parties, the Republi-can People’s Party (Cumhuriyet Halk Partisi, CHP) and the DP. As Pedersen showed for Western democracies, the smaller the number of political parties in elections, the lower the electoral volatility (Pedersen 1979).
Having said this, the persistent electoral volatility long after the democratic transi-tion is puzzling. Turkey introduced a multiparty system in 1946, following single-party rule by the CHP. The transition election in 1946 was not believed to be genu-inely competitive, however, due to government interference,9 and it seems more
appropriate to specify 1950, when the first change of government through election took place, as the democratizing election. There were two other democratizing elec-tions, in 1961 and 1983, after each military intervention.10 Thus, whether one takes
1946, 1950, 1961, or 1983 as the year of the democratic transition, Turkey’s electoral volatility is unique in that it has shown no clear sign of decline after any democratic transition. 0 10 20 30 40 50 60 1 2 3 4 5 6 7 8 9 Elections since democratization
Greece Portugal Spain Japan
Fig. I-2. Electoral Volatility in Bumpy Transitions
Source: Compiled by the author from Gunther and Montero (p. 90, Table 3.2) and from the unpub-lished document of the postwar general election results prepared by the Election Department, Local Administration Bureau, Ministry of Internal Affairs and Communications of Japan. The same data are also available from Statistical Research and Training Institute, Ministry of Internal Affairs and Communications, Japan Statistical Yearbook, various years.
Note: Election years are shown in the following table, which was compiled by the author from the above source.
Elections since democratization
0 1 2 3 4 5 6 7 8 9
Greece 1974 1977 1981 1985 1989 1989 1990 1993 1996 2000 Portugal 1975 1976 1979 1980 1983 1985 1987 1991 1995 1999 Spain 1977 1979 1982 1986 1989 1993 1996 2000
These differences between Turkey and Western democracies invite the following questions. Does the persistently high electoral volatility for Turkey point to a low level of party-system institutionalization? Or, is it an artifact of the measurement? Özbudun once warned that electoral volatility, as applied to Turkey, did not distin-guish between various types of transfer of votes among parties. According to him, electoral volatility may result from: (1) voter mobilization by local notables in the less developed provinces, (2) the rise and fall of ephemeral parties, or (3) voter realign-ments. The first two reflect a low level of institutionalization, whereas the third may well lead to institutionalization in the long run. He then argued that in the Turkish case, the combined votes for the two major parties were a better measurement of party-system institutionalization than electoral volatility (Özbudun 1981, p. 236).
More recently, however, the major assumptions in Özbudun’s argument have sub-stantially changed. First, post-1980 Turkish electoral data do not support the voter-mobilization hypothesis. Electoral participation in the general elections held between 1983 and 2002 was consistently lower in the less developed provinces than in the more developed provinces.11 Second, the 1983 parliamentary electoral law
discour-aged small parties from participating in elections because of a provision that sought to prevent party system fragmentation by requiring each party to collect 10 percent of the total vote nationwide. In effect, only parties above a certain level of organizational strength were allowed to participate in elections.
7.3 7.9 23.4 11.2 16.8 18.3 17.0 18.1 21.6 41.2 0 5 10 15 20 25 30 35 40 45 1954 ’57 ’65 ’69 ’73 ’77 ’91 ’95 ’99 2002
Source: Calculated by the author at the national level from Appendix III.
Note: Electoral volatility for the general elections immediately after the military inter-ventions (in 1960 and 1980) was not calculated. This is because military interinter-ventions either partly or totally disrupted party-system continuity. The 1960 military interven-tion led to the banning of the largest party in the parliament, the DP. The military gov-ernment after the 1980 intervention closed down all political parties. In addition, elec-toral volatility for 1987 is not shown since the transitional 1983 general election was not fully competitive. In the 1983 election, only three parties were allowed to participate.
6 INTRODUCTION
Does this then justify the use of electoral volatility as a measure of party-system institutionalization in Turkey? This study contends that electoral volatility reflects the level of party-system institutionalization only when it is divided into categories of vote swings. Özbudun’s criticism that electoral volatility does not distinguish be-tween various types of vote swings is still valid even though the political background has changed in Turkey. In this study, electoral volatility is divided into: (1) cleavage-type volatilities based on social cleavages and (2) retrospective-cleavage-type volatilities based on voter assessments of the incumbent. These two types of volatilities are then analyzed in two separate frameworks.
Outline
The present research investigates the institutionalization of the Turkish party system in terms of electoral volatility. It is organized as follows. The first two chapters present a review of empirical theories and findings of electoral change in general (Chapter 1) as well as in Turkey (Chapter 2), and lay out a theoretical argument concerning the major sources of electoral volatility. Then Chapter 3 elaborates the theoretical as-sumptions and methods employed in this analysis. The following two chapters dis-cuss electoral democracy (Chapter 4) and participation (Chapter 5) in Turkey to provide grounds for arguing that Turkey can serve as a case study for analyzing democracy in developing countries. The main part of the study (Chapter 6 through Chapter 9) applies to the Turkish context the empirical theories of electoral change developed in the first two chapters. Cleavage-based voting is analyzed quantitatively in Chapter 6 and qualitatively in Chapter 7 whereas retrospective voting models are tested with micro data in Chapter 8 and with macro data in Chapter 9. The Conclusion consists of summaries of the major findings and tentative conclusions.
Notes
1 Electoral volatility does not measure the gross but only the net shift of votes among parties. Measuring the gross shift requires waves of panel surveys.
2 Change in the party vote percentage due to party mergers or splits were not counted. Nominal electoral volatility was thus excluded. For instance, if Party B splints from Party A between two consecutive elections, the change in the party vote percentage stemming from Party A and Party B is calculated as (Combined vote percentage for Party A and Party B, Electiont)− (Vote percentage for Party A, Electiont-1). The above represents Bartolini and Mair’s counting rule of electoral volatility. See Bartolini and Mair (1990, Appendix 1). 3 Institutionalization is defined in general as “the process by which organizations and
proce-dures acquire value and stability” (Huntington 1968, p. 12). For empirical studies that use long-term electoral volatility as a measurement of party-system institutionalization, see Mainwaring (1999), Toole (2000, pp. 441–61), Gunther and Montero (2001); and Kuzenzi and Lambright (2001, pp. 437–68). See also the literature reviewed in Chapter 2. 4 Electoral volatility cannot be calculated for the first year of a given period. Thus, electoral
volatility can be calculated for (n− 1) time-points out of a total of n time-points during a given period.
5 Mean electoral volatility was obtained by averaging out electoral volatility for all the elections of all the countries (Bartolini and Mair [1990], p. 68).
6 For electoral realignment, see Campbell et al. (1966, pp. 74–77).
7 Compare Table I-1 with electoral volatility data for Latin America shown in Mainwaring (1999, Table 2-1).
8 Even if the most volatile election of 2002 was excluded, mean electoral volatility for the 1961–99 period was still 18.1. Mean electoral volatility for the entire 1950–2002 period was 18.3.
9 For indications of electoral fraud in favor of the governing party, see Karpat (1959, pp. 160– 65).
10 In the 1960 intervention, the military overthrew the DP government, which had abused its parliamentary majority and become increasingly authoritarian. The interim military gov-ernment introduced a progressive constitution and returned power to a civilian govgov-ernment in 1961. In the 1980 intervention, the military aimed to restore law and order by banning political activities and limiting basic rights. The military rule lasted for three years during which the more authoritarian 1982 constitution was adopted.