Research Article
The Early Decline of α-Fetoprotein
and Des-γ-Carboxy Prothrombin
Predicts the Response of Hepatic
Arterial Infusion Chemotherapy in
Hepatocellular Carcinoma Patients
Shumpei Yamamoto Hideki Onishi Akinobu Takaki Atsushi Oyama Takuya Adachi Nozomu Wada Masahiro Sakata Tetsuya Yasunaka Hidenori Shiraha Hiroyuki OkadaDepartment of Gastroenterology and Hepatology, Okayama University Graduate School of Medicine, Dentistry, and Pharmaceutical Sciences, Okayama, Japan
Keywords
Hepatocellular carcinoma · Hepatic arterial infusion chemotherapy · Low-dose cisplatin plus 5-fluorouracil · α-Fetoprotein · Des-γ-carboxy prothrombin
Abstract
Introduction: Molecular targeting drugs are recommended as second-line treatment for
in-trahepatic advanced hepatocellular carcinoma (HCC). However, in Asia, hepatic arterial infu-sion chemotherapy (HAIC) is also considered as a second-line treatment because it improves the survival of responders. The aim of this study was to predict responders and non-respond-ers to HAIC with low-dose cisplatin plus 5-fluorouracil (LFP) using tumor marknon-respond-ers. Objective
and Methods: The data of 47 patients who received LFP for the first time in our hospital were
analyzed retrospectively. We evaluated the association between treatment response by Re-sponse Evaluation Criteria in Solid Tumors and the changing ratio of the serum concentration of α-fetoprotein (AFP), Lens culinaris agglutinin-reactive fraction of AFP (AFP-L3), and des-γ-carboxy prothrombin (DCP) 2 weeks after LFP initiation. Results: The number of patients showing a complete response (CR), a partial response (PR), stable disease (SD), and progres-sive disease (PD) was 0 (0%), 20 (43%), 18 (38%), and 9 (19%), respectively. The AFP ratio showed significant positive correlations for PR vs. SD (p = 0.004) and PR vs. PD (p = 0.003). The DCP ratio correlated significantly for PR vs. SD (p = 0.02). The optimal cutoff values for responders were 0.79 for the AFP ratio and 0.53 for the DCP ratio. Prediction using both or
Shumpei Yamamoto
Department of Gastroenterology and Hepatology
Okayama University Graduate School of Medicine, Dentistry, and Pharmaceutical Sciences, Okayama 700-8558 (Japan)
either cutoff value showed 93% sensitivity, 53% specificity, a 94% negative predictive value, and a 57% positive predictive value. Conclusion: Optimal cutoff values for AFP and DCP ratios enable prediction of nonresponders to HAIC with LFP. This simple and early assessment meth-od allows the use of HAIC and molecular targeting drugs for HCC treatment.
© 2020 The Author(s)
Published by S. Karger AG, Basel
Introduction
Hepatocellular carcinoma (HCC) is the fifth most common cancer in the world [1]. Although progress and stabilization of treatment for intermediate and advanced HCC improve the prognosis of patients, the frequent recurrence of HCC is an unsolvable problem. It has often been discussed that repetition of therapies for multiple recurrences results in deterio-ration of the residual liver function.
In Japanese clinical practice guidelines for HCC [2], hepatic arterial infusion chemo-therapy (HAIC) and molecular targeting drugs are recommended as second-line treatments following transcatheter arterial chemoembolization (TACE) for intrahepatic advanced HCC. Although there are no standard criteria that suggest the first choice of treatment for HCC, several studies have suggested performing HAIC before the administration of molecular targeting drugs because HAIC responders have significantly longer survival rates than HAIC nonresponders [3–6]. Therefore, evaluation of the early response in HAIC is important to prevent the residual liver function from deteriorating, because molecular targeting drugs are indicated for patients with preserved hepatic function (Child-Pugh class A) [7].
The standard methods to assess the efficacy of HAIC are imaging studies such as contrast-enhanced computed tomography (CECT) and contrast-contrast-enhanced magnetic resonance imaging (CEMRI) according to Response Evaluation Criteria in Solid Tumors (RECIST) [8], which are performed during 1 month after the end of every serial treatment. This means that the assessment of treatment response cannot not be confirmed until completion of 1 course, which could result in deterioration of the residual liver function. Therefore, some investi-gators have claimed new ways of early assessment for treatment efficacy using tumor markers, such as changing the value of the serum concentration of α-fetoprotein (AFP) and des-gamma-carboxy prothrombin (DCP) 2 weeks after the initiation of HAIC [4–6]. Although many inves-tigators have defined the positive response of the AFP and DCP ratio as a reduction of >20% from baseline, little study has been done to actually explore the optimal cutoff value of the change ratio of tumor markers in HAIC responders using a statistical method. The aim of the present retrospective study is to clarify the optimal cutoff value of the change ratio of tumor markers 2 weeks after the initiation of HAIC as predictors of low-dose cisplatin plus 5-fluo-rouracil (LFP) responders.
Materials and Methods
Patients
Between January 2007 and December 2017, one hundred thirty patients with unresectable HCC received HAIC treatment at the Department of Gastroenterology and Hepatology, Okayama University Graduate School of Medicine, Dentistry and Pharmaceutical Sciences. Of these patients, 53 who received low-dose cisplatin (Nihonkayaku, Japan, or Yakult, Japan) plus 5-fluorouracil (5-FU) (Kyowa Hakko, Japan, or Towa, Japan) (LFP) for the first time, and were evaluated for AFP, Lens culinaris agglutinin-reactive fraction of AFP (AFP-L3), and the DCP level 2 weeks after initiation, were enrolled into this study. We excluded 6 patients from this study for the following reasons: (1) presence of extrahepatic metastasis, (2) patients taking warfarin, and (3) patients receiving TACE during LFP.
Chemotherapeutic Regimen
An intra-arterial catheter was inserted through the femoral artery, and an injection port was implanted subcutaneously. All of the patients received LFP via the injection port as follows: continuous hepatic arterial infusion of 5-FU (250 mg/day, days 1–5) and hepatic arterial infusion of cisplatin (10 mg for 30 min, days 1–5) daily for every 4 weeks.
Evaluation of the Response to LFP
RECIST guidelines (version 1.1) [8] were used to evaluate the response to LFP through diagnostic imaging, such as CECT or CEMRI, which was performed before the initiation of LFP and during 1 month after the end of 1 course. We measured the serum concentration of AFP, AFP-L3, and DCP before and 2 weeks after the initiation of LFP. Deviation within 2 days before and after the scheduled examination was permitted. The AFP ratio was defined as the serum AFP concentration after 2 weeks divided by that observed before the initiation of LFP. The AFP-L3 ratio and the DCP ratio were also defined in the same way. We analyzed the association of each tumor marker ratio and the diagnostic imaging response of LFP. In each analysis, we excluded patients whose tumor marker level was within the normal range before the initiation of LFP.
Statistical Analysis
The JMP version14.0 software package (SAS Institute, Cary, NC, USA) was used for all statistical analyses. Continuous variables were expressed as medians (range). Statistical significance was assessed by a nonpara-metric test. Pearson’s χ2 test or Fisher’s exact test was performed to compare categorical variables. Receiver operating characteristic (ROC) curve analysis was used to detect the most appropriate cutoff values for the AFP/AFP-L3/DCP ratio to predict the response of LFP. For evaluation of the efficacy of these ratios, sensi-tivity, specificity, positive predictive value (PPV), and negative predictive value (NPV) were calculated.
Results
Patient Characteristics
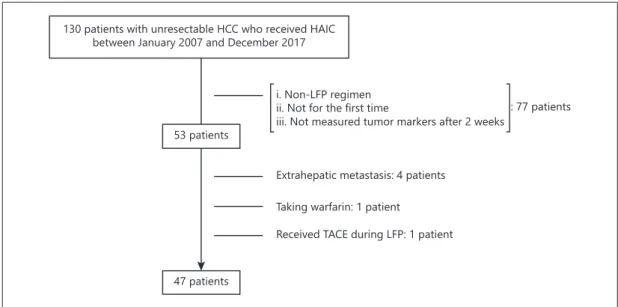
We enrolled 47 patients who received LFP for the first time to clarify factors that predicted responders and nonresponders (Fig. 1). The clinical characteristics of the patients enrolled into this study are summarized in Table 1. There were 41 (87%) men, and the median age was 65 years. The number of patients with Child-Pugh class A and B was 27 (55%) and 20 (45%), respectively. The median serum concentration of AFP, AFP-L3, and DCP was 1,538 ng/
130 patients with unresectable HCC who received HAIC between January 2007 and December 2017
53 patients
47 patients
Received TACE during LFP: 1 patient Taking warfarin: 1 patient
Extrahepatic metastasis: 4 patients
: 77 patients ii. Not for the first time
iii. Not measured tumor markers after 2 weeks i. Non-LFP regimen
mL (range 2–554,030), 24.5% (range 0.5–90.9), and 2,469 mAU/mL (range 22–295,980), respectively. Moreover, 44 patients (94 %) showed multiple tumors, and the median size of the maximum tumor was 45 mm in diameter (range 10–136). Approximately half of the patients had locally advanced HCC with vascular invasion at the main trunk or at the first branch of the portal vein.
Tumors were larger (p = 0.04) and multiple (p = 0.04) and the serum concentration of DCP was significant higher (p = 0.02) in males. There were no significant differences between males and females with respect to etiology, Child-Pugh class, portal vein tumor thrombosis, or the serum concentration of Hb, PLT, AFP, and AFP-L3.
Association of the AFP/AFP-L3/DCP Ratio with Treatment Response
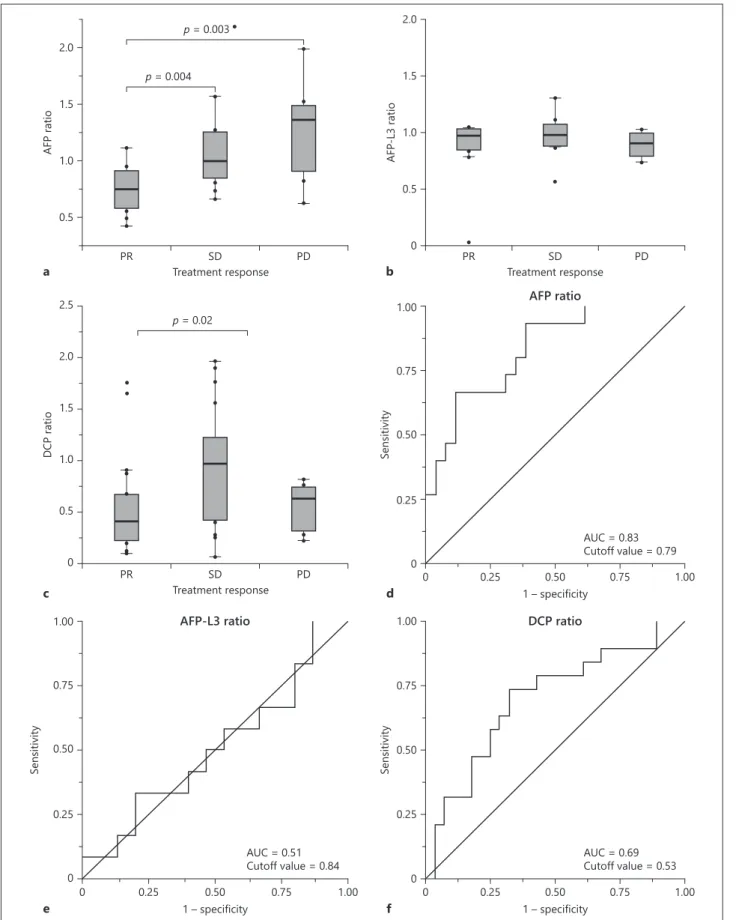
The number of patients who indicated a complete response (CR), a partial response (PR), stable disease (SD), and progressive disease (PD) was 0 (0%), 20 (43%), 18 (38%), and 9 (19%), respectively. The response rate (RR) was 43%, and the disease control rate was 81%. Figure 2 shows the result of the association of the AFP/AFP-L3/DCP ratio with treatment response. In the AFP ratio analysis, 6 patients who did not indicate a serum elevation of AFP concentration before treatment were excluded. AFP ratio had significantly positive correla-tions for PR versus SD (p = 0.004) and PR versus PD (p = 0.003). The optimal cutoff value for responders (CR+PR) for the AFP ratio was 0.79 and the area under the ROC curve was 0.83.
In the AFP-L3 ratio analysis, 21 patients (43%) who did not show serum elevation of the AFP-L3 concentration before the treatment were excluded. AFP-L3 ratio did not show any correlation with treatment response.
In the DCP ratio analysis, 2 patients were excluded in the same way. DCP ratio correlated significantly for PR versus SD (p = 0.02), while there was no difference for PR versus PD. The optimal cutoff value for responder for DCP ratio was 0.53 and the area under the ROC curve was 0.69.
Figure 3 shows the result for the association of the pretreatment serum concentration of AFP/AFP-L3/DCP with treatment response. None of the serum concentrations did not show any correlation with treatment response.
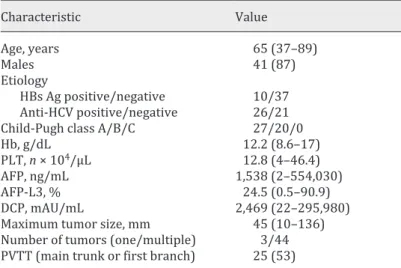
Characteristic Value Age, years 65 (37–89) Males 41 (87) Etiology HBs Ag positive/negative 10/37 Anti-HCV positive/negative 26/21
Child-Pugh class A/B/C 27/20/0
Hb, g/dL 12.2 (8.6–17)
PLT, n × 104/μL 12.8 (4–46.4)
AFP, ng/mL 1,538 (2–554,030)
AFP-L3, % 24.5 (0.5–90.9)
DCP, mAU/mL 2,469 (22–295,980)
Maximum tumor size, mm 45 (10–136)
Number of tumors (one/multiple) 3/44 PVTT (main trunk or first branch) 25 (53)
Data are expressed as medians (range) or numbers (%) unless otherwise noted. HBsAg, hepatitis B surface antigen; anti-HCV, antibody against the hepatitis C virus; Hb, hemoglobin; PLT, platelet; PVTT, portal vein tumor thrombosis.
Table 1. Clinical characteristics of 47 patients who received LFP for the first time
AFP-L3 ratio 0.5 0 1.0 1.5 2.0 PR SD Treatment response PD p = 0.004 p = 0.003 AFP ratio Treatment response PR a SD PD b 0.5 1.0 1.5 2.0 e f Sensitivity 1.00 0.75 0.50 0.25 0 1 – specificity 1.00 0.75 0.50 0.25 0 DCP ratio AFP-L3 ratio AUC = 0.51
Cutoff value = 0.84 AUC = 0.69Cutoff value = 0.53
Sensitivity 1 – specificity 1.00 0.75 0.50 0.25 0 1.00 0.75 0.50 0.25 0 c d AFP ratio Sensitivity 1.00 0.75 0.50 0.25 AUC = 0.83 Cutoff value = 0.79 0 1 – specificity 1.00 0.75 0.50 0.25 0 p = 0.02 Treatment response PR SD PD DCP ratio 0.5 0 1.0 1.5 2.5 2.0
Fig. 2. a–c Boxplots representing the changing ratio of AFP, AFP-L3, and DCP, respectively, for patients with a PR, SD, and a PD. p values were calculated using a nonparametric test. d–f ROC curve of changing ratios of AFP/AFP-L3/DCP for responders (CR+PR).
Accuracy of the AFP/DCP Ratio in Predicting Responders to LFP
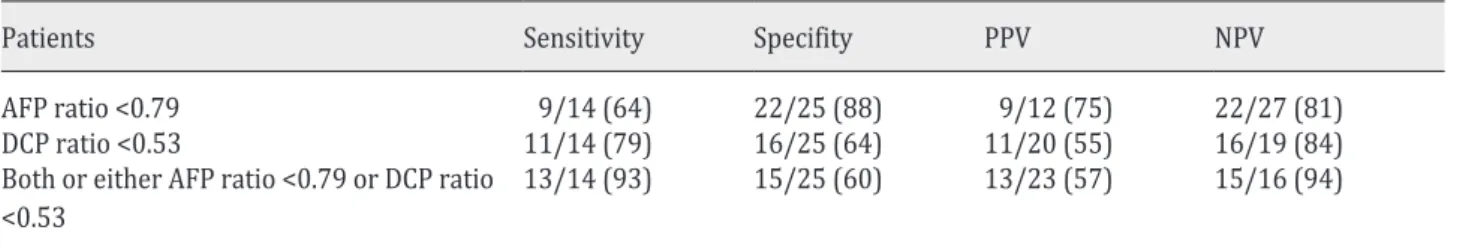
Thirty-nine patients, showing an elevation of both serum AFP and DCP concentrations before the treatment, were analyzed to predict responders versus nonresponders using the cutoff values of the AFP and DCP ratios (Table 2). Prediction using the AFP ratio was found to be 64% sensitive and 88% specific, with an NPV of 81% and a PPV of 75%. With the DCP ratio it was found to be 79% sensitive and 64% specific, with an NPV of 84% and a PPV of 55%. The prediction using both or either AFP ratios <0.79 and DCP ratios <0.53 was 93% sensitive and 60% specific, with an NPV of 94% and a PPV of 57%.
100 80 60 40 20 0 AFPL-3 concentration , % PR SD PD Treatment response DCP concentration, mA U/ mL 300,000 250,000 100,000 80,000 60,000 40,000 20,000 PR SD PD Treatment response AFP concentration , ng/mL Treatment response PR a c b SD PD 600,000 60,000 45,000 30,000 15,000 0
Fig. 3. a–c Boxplots representing the concentration of AFP, AFP-L3, and DCP, respectively, for patients with a PR, SD, and a PD. p values were calculated using a nonparametric test.
Table 2. Accuracy of the AFP/DCP ratio for prediction of the treatment response
Patients Sensitivity Specifity PPV NPV
AFP ratio <0.79 9/14 (64) 22/25 (88) 9/12 (75) 22/27 (81)
DCP ratio <0.53 11/14 (79) 16/25 (64) 11/20 (55) 16/19 (84)
Both or either AFP ratio <0.79 or DCP ratio
<0.53 13/14 (93) 15/25 (60) 13/23 (57) 15/16 (94)
Discussion/Conclusion
Our study indicated that the changing ratio of serum AFP and DCP concentrations 2 weeks after the initiation of LFP enabled us to predict the response to treatment. Furthermore, it can be presumed that, in most patients with intermediate or advanced HCC, if the elevation of both serum AFP and DCP concentrations did not satisfy these 2 cutoff values, then these patients would be considered nonresponders to HAIC with LFP. For these patients, we should switch the HAIC treatment with LFP to molecular targeting drugs at an early stage.
HAIC has been performed for intrahepatic intermediate or advanced HCC as an effective treatment in Asia, especially in Japan. Several studies have been conducted for high RR and prolongation of the survival of HCC patients. In several studies, the objective RR of HAIC with LFP has been reported to be about 35–71% [9–14, 4–6]. However, it is not recommended as standard therapy in the guidelines of American Association for the Study of Liver Disease (AASLD) [15] and the European Association for the Study of the Liver (EASL) [16], because there are no major randomized clinical trials. However, in a nationwide survey in Japan, a propensity score-matched analysis showed that the median survival time was longer for patients who received LFP than for patients who did not receive active therapy, and responders to LFP showed prolongation of survival [14]. Moreover, Kudo et al. reported the efficacy of LFP using a combination of sorafenib and LFP in the SILUS study [17]. Although sorafenib plus LFP did not improve the overall survival rate compared to sorafenib mono-therapy, it showed a tendency to improve the median survival time (MST) in patients with main portal invasion (11.4 vs. 6.5 months, p = 0.05). In addition, they pointed out that the combination therapy improved the overall RR compared to sorafenib monotherapy, and these responders in both treatment groups survived significantly longer than the nonre-sponders. In this situation, controversy still exists in Japan regarding which treatment should be the first choice. Molecular targeting drugs are applied in patients with good liver function (i.e., Child-Pugh class A); repeated treatment with HAIC sometimes causes deterioration of the liver function [3], and therefore it is important to assess the efficacy of LFP as soon as possible.
As some studies have claimed, our study also proved that early evaluation of LFP by the changing ratio of tumor markers was effective in predicting the response to treatment. Miyaki et al. [4] reported that the combination of early tumor marker response and early imaging evaluation at 2 weeks after the initiation of LFP was useful in the assessment of treatment response and prognosis. In their study, AFP ratios <1 and/or DCP ratios <1 were associated with the best imaging response in patients with an SD early imaging response. Moreover, Saeki et al. [5, 6] reported that the ACTH system, which consists of the Child Pugh score, the AFP response, and the DCP response, is useful for assessment of the treatment response and prediction of the survival rate. They defined a positive response as a >20% reduction of AFP and DCP from baseline 2 weeks after the initiation of LFP. However, little attention has been paid to the changing ratio of AFP and DCP. It was evident from our findings that the optimal cutoff value of AFP and DCP ratios established by ROC analysis could more accurately predict responders versus nonresponders for LFP. In fact, DCP tends to decrease drastically within 2 weeks after the initiation of LFP compared to AFP in our study. It may be associated with the shorter half-life of DCP compared to that of AFP [18, 5]. This result implied that the definition about changing ratio of AFP and DCP should be established sepa-rately. In our study, evaluating the combination of each cutoff value for AFP and DCP ratios was quite effective. Only the AFP ratio showed a high sensitivity and NPV to predict the treatment response; however, combination of both DCP and AFP ratios achieved a much better result.
The AFP-L3 ratio was not useful in the prediction of treatment response in our study. AFP-L3 is a fucosylated variant of AFP, and it changes independently of AFP. AFP-L3 is reported to be sensitive and specific for localization of HCC and useful for the early detection of HCC [19, 20]. Yamashita et al. [21] reported that AFP-L3-positive patients had a poor prog-nosis. In their study, the patients tested positive for AFP-L3 earlier than they tested positive for AFP during posttreatment observation after percutaneous ethanol injection, TACE, and hepatic resection. Okuda et al. [22] showed the efficacy of AFP-L3 to evaluate curability after hepatic resection. However, this claim did not concur with our findings. As one of the causes, AFP-L3 may not be related to tumor size, although it relates to the presence and malignant potential of HCC. For this reason, AFP-L3 may not be suitable for early evaluation of chemo-therapy, because we cannot expect patients to achieve a CR 2 weeks after the initiation of HAIC.
In addition, we analyzed the association of the pretreatment serum concentration of AFP/AFP-L3/DCP with treatment response, because the changing ratio of tumor marker was likely to be affected by the initial value. As a result, initial serum concentrations were not associated with treatment response. This result also suggests that the changing ratio of tumor marker is reasonable as a prognostic marker.
It should be mentioned that previous studies included several regimens of HAIC, such as LFP with isovorin and 5-FU with subcutaneous interferon [11, 4–6]. The term of 1 course depends on the type of regimen, and the reduction rate of tumor markers also depends on each regimen. Therefore, we should establish each cutoff value according to the type of regimen in the future.
There are 3 limitations to be considered when understanding the results of our study. Firstly, this was a retrospective cohort study and data obtained for this study were from a single institution. Further prospective multicenter studies with a large sample size are needed. Secondly, we excluded the patients who took warfarin and vitamin K, and hence we could not test the usefulness of the cutoff values in these patients. Thirdly, we did not analyze prognosis, because posttreatments after LFP strongly influence the prognosis.
In conclusion, the combination of optimal cutoff values for the AFP ratio (i.e., 0.79) and the DCP ratio (i.e., 0.53) 2 weeks after the initiation of therapy enabled us to predict nonre-sponders versus renonre-sponders to HAIC with LFP. Our findings might improve the prognosis as they suggest switching to molecular targeting drugs earlier than recommended in previous reports.
Acknowledgment
We would like to thank Editage (www.editage.com) for English language editing.
Statement of Ethics
This study was approved by the institutional review board of our institution. All protocols were carried out in accordance with the Helsinki Declaration of 1975 (revised in 1983). Written informed consent was obtained from all of the patients prior to treatment.
Disclosure Statement
Funding Sources
This research received no specific grant from any funding agency in the public, commercial, or not-for-profit sector.
Author Contributions
Hideki Onishi and Akinobu Takaki conceived and designed the analysis and contributed to the writing of this paper. Hideki Onishi, Akinobu Takaki, Atsushi Oyama, Takuya Adachi, Nozomu Wada, Masahiro Sakata, Tetsuya Yasunaka, and Hidenori Shiraha contributed to the administration of HAIC treatment and the acqui-sition of data. Hiroyuki Okada supervised this study. All of the authors discussed the results and contributed to the final version of this paper.
References
1 Bray F, Ferlay J, Soerjomataram I, Siegel RL, Torre LA, Jemal A. Global cancer statistics 2018: GLOBOCAN esti-mates of incidence and mortality worldwide for 36 cancers in 185 countries. CA Cancer J Clin. 2018 Nov;68(6): 394–424.
2 Kokudo N, Hasegawa K, Akahane M, Igaki H, Izumi N, Ichida T, et al. Evidence-based Clinical Practice Guide-lines for Hepatocellular Carcinoma: The Japan Society of Hepatology 2013 update (3rd JSH-HCC GuideGuide-lines).
Hepatol Res. 2015 Jan;45(2):n/a.
3 Kudo M. Treatment of advanced hepatocellular carcinoma with emphasis on hepatic arterial infusion chemo-therapy and molecular targeted chemo-therapy. Liver Cancer. 2012 Sep;1(2):62–70.
4 Miyaki D, Kawaoka T, Aikata H, Kan H, Fujino H, Fukuhara T, et al. Evaluation of early response to hepatic arterial infusion chemotherapy in patients with advanced hepatocellular carcinoma using the combination of response evaluation criteria in solid tumors and tumor markers. J Gastroenterol Hepatol. 2015 Apr;30(4):726–32. 5 Saeki I, Yamasaki T, Tanabe N, Iwamoto T, Matsumoto T, Urata Y, et al. A new therapeutic assessment score
for advanced hepatocellular carcinoma patients receiving hepatic arterial infusion chemotherapy. PLoS One. 2015 May;10(5):e0126649.
6 Saeki I, Yamasaki T, Maeda M, Hisanaga T, Iwamoto T, Matsumoto T, et al. Evaluation of the “assessment for continuous treatment with hepatic arterial infusion chemotherapy” scoring system in patients with advanced hepatocellular carcinoma. Hepatol Res. 2018 Feb;48(3):E87–97.
7 Cheng AL, Kang YK, Chen Z, Tsao CJ, Qin S, Kim JS, et al. Efficacy and safety of sorafenib in patients in the Asia-Pacific region with advanced hepatocellular carcinoma: a phase III randomised, double-blind, placebo-controlled trial. Lancet Oncol. 2009 Jan;10(1):25–34.
8 Eisenhauer EA, Therasse P, Bogaerts J, Schwartz LH, Sargent D, Ford R, et al. New response evaluation criteria in solid tumours: revised RECIST guideline (version 1.1). Eur J Cancer. 2009 Jan;45(2):228–47.
9 Okuda K, Tanaka M, Shibata J, Ando E, Ogata T, Kinoshita H, et al. Hepatic arterial infusion chemotherapy with continuous low dose administration of cisplatin and 5-fluorouracil for multiple recurrence of hepatocellular carcinoma after surgical treatment. Oncol Rep. 1999 May-Jun;6(3):587–91.
10 Ando E, Tanaka M, Yamashita F, Kuromatsu R, Yutani S, Fukumori K, et al. Hepatic arterial infusion chemo-therapy for advanced hepatocellular carcinoma with portal vein tumor thrombosis: analysis of 48 cases.
Cancer. 2002 Aug;95(3):588–95.
11 Kanayama M, Nagai H, Sumino Y. Influence of the etiology of liver cirrhosis on the response to combined intra-arterial chemotherapy in patients with advanced hepatocellular carcinoma. Cancer Chemother Pharmacol. 2009 Jun;64(1):109–14.
12 Ueshima K, Kudo M, Takita M, Nagai T, Tatsumi C, Ueda T, et al. Hepatic arterial infusion chemotherapy using low-dose 5-fluorouracil and cisplatin for advanced hepatocellular carcinoma. Oncology. 2010 Jul;78 Suppl 1: 148–53.
13 Niizeki T, Sumie S, Torimura T, Kurogi J, Kuromatsu R, Iwamoto H, et al. Serum vascular endothelial growth factor as a predictor of response and survival in patients with advanced hepatocellular carcinoma undergoing hepatic arterial infusion chemotherapy. J Gastroenterol. 2012 Jun;47(6):686–95.
14 Nouso K, Miyahara K, Uchida D, Kuwaki K, Izumi N, Omata M, et al.; Liver Cancer Study Group of Japan. Effect of hepatic arterial infusion chemotherapy of 5-fluorouracil and cisplatin for advanced hepatocellular carcinoma in the Nationwide Survey of Primary Liver Cancer in Japan. Br J Cancer. 2013 Oct;109(7):1904–7. 15 Heimbach JK, Kulik LM, Finn RS, Sirlin CB, Abecassis MM, Roberts LR, et al. AASLD guidelines for the treatment
of hepatocellular carcinoma. Hepatology. 2018 Jan;67(1):358–80.
16 Galle PR, Forner A, Llovet JM, Mazzaferro V, Piscaglia F, Raoul JL, et al.; European Association for the Study of the Liver. EASL Clinical Practice Guidelines: management of hepatocellular carcinoma. J Hepatol. 2018 Jul; 69(1):182–236.
17 Kudo M, Ueshima K, Yokosuka O, Ogasawara S, Obi S, Izumi N, et al.; SILIUS study group. Sorafenib plus low-dose cisplatin and fluorouracil hepatic arterial infusion chemotherapy versus sorafenib alone in patients with advanced hepatocellular carcinoma (SILIUS): a randomised, open label, phase 3 trial. Lancet
Gastroen-terol Hepatol. 2018 Jun;3(6):424–32.
18 Kishi K, Sonomura T, Mitsuzane K, Nishida N, Kimura M, Satoh M, et al. Time courses of PIVKA-II and AFP levels after hepatic artery embolization and hepatic artery infusion against hepatocellular carcinoma: relation between the time course and tumor necrosis. Radiat Med. 1992 Sep-Oct;10(5):189–95.
19 Taketa K, Sekiya C, Namiki M, Akamatsu K, Ohta Y, Endo Y, et al. Lectin-reactive profiles of alpha-fetoprotein characterizing hepatocellular carcinoma and related conditions. Gastroenterology. 1990 Aug;99(2):508–18. 20 Sato Y, Nakata K, Kato Y, Shima M, Ishii N, Koji T, et al. Early recognition of hepatocellular carcinoma based on
altered profiles of alpha-fetoprotein. N Engl J Med. 1993 Jun;328(25):1802–6.
21 Yamashita F, Tanaka M, Satomura S, Tanikawa K. Prognostic significance of Lens culinaris agglutinin A-reactive alpha-fetoprotein in small hepatocellular carcinomas. Gastroenterology. 1996 Oct;111(4):996–1001. 22 Okuda K, Tanaka M, Kanazawa N, Nagashima J, Satomura S, Kinoshita H, et al. Evaluation of curability and
prediction of prognosis after surgical treatment for hepatocellular carcinoma by lens culinaris agglutinin-reactive alpha-fetoprotein. Int J Oncol. 1999 Feb;14(2):265–71.