Bull. Fish. Lab. Kinki Univ., No.14, 77 - 149 (2014)
Studies on the enhancement of early larval survival of groupers
Epinephelussp.
Ching Fui Fui
ContentsChapterl General Introductio • · · • • · • • • • • • • • • • • • • • · · 79 Chapter2 Successful Initiation of Larval Groupers First Feeding · · · · · · 83
2.1 Introduction · · · · 83
2.2 Materials and Methods · · • · • · 84
2.2.1 Egg Collection • · · · · · · · 84 2.2.2 Indication of First Feeding Time · · • · · · · · · 84 2.2.3 Larval Rearing and Experimental Design • · • · · · · · 85
2.2.4 Laval Nutritional Condition 86
2.2.5 Statistic Analysis · · · 87
2.3 Results · · · • · · · • • · · · · · · 87 2.3.1 York Sac and Oil Globule Volume and Absorption
Period · · · · · 2.3.2 Larval Survival and Growth · · · · · · 2.3.3 Point of No Return · · · ·
2.3.4 Feeding Intake · · · · · · 2.3.5 Nutritional Condition · · · · 2.3.5.1 Gut Epithelium Development 2.3.5.2 Morphometric Development 2.4 Discussion · · · · · · · • · · 87 89 90
91
93 9395
96
Chapter3 Detections of Sinking Syndrome in Larval Groupers · · · · · · · · · 993.1 Introduction · · · · · · · · · · · · · · · · · · · · · · • • · • 99 3.2 Materials and Methods · · · · · · · · · · · · · · · · · · 100
Part I: Larval Sinking Distribution and Velocity · · • • · · 100 3.2.1 Egg Collection · · · • · · · · · · · 100 3.2.2 Larval Rearing and Experimental Design · · · · · • · · · 101 3.2.3 Laval Distribution · · · · · · · · · · · 101 3.2.4 Larval Sinking Velocity · · · • 102 Part II: Larval Buoyancy: Body Density and Swim · · · · • • · 103
Bladder Inflation Rate
3.2.5 Egg Collection · · · · · • · · · 103
3.2.6 Larval Rearing and Experimental Design 104
3.2. 7 Larval Body Density and Swim Bladder · · · · · 104 Inflation Rate
3.3.1 Laval Distribution · • • • · · · · · • · · 105 3.3.2 Larval Sinking Velocity • • • • · · · · • • · · · · · • 106 a. The Kelp Grouper • • · · • · · · · · · · • 106 b. The Tiger Grouper · · · · · • • · • · · · · • • • 107 c. Comparison on Larval Sinking Velocity · · · · • 108
between the kelp grouper and Tiger Grouper
3.3.3 Larval Body Density · • • • • • • • • • · · · · • · · 110 a. The Kelp Grouper · · · · · · · · · · · • • · 110 b. The Tiger Grouper · · · · · · · · · · · · • 111 c. Comparison on Larval Body Density between · · · 112
the kelp grouper and Tiger Grouper
3.3.4 Larval Swim Bladder Inflation Rate · · · · • • • • 113 3.4 Discussion • · · · · • • · · 114 Chapter4 Flow Field Control in Larviculture Tank of Groupers For · · · · • • • 11 7
Reducing Sinking Syndrome Related Death (SSRD)
4.1 Introduction • • • • · · · 11 7 4.2 Materials and Methods • · · · 118 4.2.1 Egg Collection · · · • · · · • • • · · · 118 4.2.2 Larval Rearing and Experimental Design • • · · · · · 118 4.2.3 Surface Tension Related Death (STRD) · · · • • • • · 118 4.2.4 Survival and Growth Performances · · · · • • 118 4.2.5 Feeding Intake · · · • • • • 118 4.2.6 Stress Level · · · • • • · • 119 4.2. 7 Flow Velocity Distribution · · · · · · · · ·
4.2.8 Statistic Analysis · · · · • • • • • · · · ·
4.3 Results · · · • • • • · • · · · ·
119 119 119 4.3.1 Survival and Growth Performances • · · · · · 119 4.3.2 Feeding Intake • · · · · • • • • • • 120 a. The Kelp Grouper • • • • · · • · · · · · · · · 120 b. The Tiger Grouper · · · · · · · · • · · · · · · 121
4.3.3 Surface Tension Related Death (STRD) 122
a. The Kelp Grouper b. The Tiger Grouper 4.3.4 Stress Level · · · ·
a. The Kelp Grouper b. The Tiger Grouper 4.3.5 Flow Velocity Distribution
4.4 Discussion 122 122 124 124 126 127 128 Chapter5 General Recommendation and Conclusion · · • • • • • • · · · · · · 131 Summary · · · · · · · · · · · · • • • · · · · · • · · · • • • · 133 Acknowledgment · · · · · · · · · · • • • • · · · · 137 References · · • • • • • • · • · · · · · · • • • • · • · · 139
CHAPTERl
GENERAL INTRODUCTION
The kelp grouper (Epinephelus bruneus) and tiger grouper (Epinephelus fascoguttatus) are belonging to the subfamily of Epinephelinae, the family of Serranidae, the order of Perciformes (Sugama et al. 2008). Both groupers are widely distributed in temperate and tropical water, respectively, throughout the Asian region. The kelp grouper is largely found in the Northwest Asian region, notably in Japan, Korea, Taiwan and Mainland China (Y oshii et al. 201 O; An et al. 2011 ), while the tiger grouper is abundantly found in Southeast Asian region, including Malaysia, Indonesia, Thailand and the Philippines (Afero et al. 2010).
Owing to the widespread distribution, both groupers are also known in several other common names including longtooth grouper or mud grouper for the kelp grouper (Song et al. 2007) and brown marbled grouper, blotch grouper or flower cod for the tiger grouper (Mokhtar et al. 2011). These two groupers are among the main targeted species for both seafood and aquaculture industries (Koeshendrajana and Tri Hartono 2006; Yoshii et al. 2010), and highly desirable for stock enhancement programs (Kato et al. 2006).
In seafood industry, the kelp grouper and tiger grouper are categorized as highly valued fish, priced for their excellent meat quality and first-rate taste making them comparable to other groups of top-graded fish species (Miyaki et al. 2005; Tupper and Sheriff 2008). Accordingly, the demand of both groupers has been tremendously increased across the Asian region. However the sustainability of grouper seafood industry is often constrained by unreliable supply of wild-caught fish due to heavy exploitation of the natural resources (Heemstra and Randall, 1993). Thus, hatchery produced groupers is significantly important to meet the growing demand while reducing the pressure of overburdened on wild stock (Rimmer 2004; Pierre et al. 2007). In addition, large number of grouper fingerlings produced in hatchery could be reintroduced into the wild for stock enhancement purposes (Pierre et al. 2007).
The kelp grouper aquaculture started around I980's in Japan and Korea (Takeshita and Soyano 2009), while the tiger grouper was started approximately in 1970's in most of countries throughout the Southeast Asian region (Chen et al. 1977; Peirre et al. 2007). Plentiful of successful stories on Asian grouper aquaculture had been documented by Peirre et al. (2007);
nevertheless, reliable of large-scale production of both groupers is greatly hindered by complications associated with high mortality at early larval stage (Chi et al. 1999; Teruya and Yoseda 2006; Afero et al. 2010). It was reported that larval survival for the kelp grouper and tiger grouper was oniy 0.3-37.0% (Teruya and Yoseda 2006) and 0.02-4.0% (Yoshimitsu et ai. 1986; Muchari et al. 1991), respectively.
The present study emphasizes on the enhancement of early larval survival of the kelp grouper and tiger grouper via the introduction of two independent approaches. The first approach emphasizes larval successful initiation of first feeding through the understanding of larval optimum first feeding time; while the second approach highlights the improvement on larval rearing environment through the introduction of flow field control particularly to reduce sinking syndrome related death (SSRD).
In chapter 2, successful initiation of first feeding through the understanding of larval optimum first feeding time was studied. Successful initiation of first feeding is feasible when suitability of feed type (Su et al. 2005), density (Wang and Eckman 1994), sizes (Faruque et al. 2010), frequency (EroldogD an et al. 2008), time (Y oseda et al. 2006) and characteristic (Hardy and Barrows 2002) are taking into account precisely. In spite of the various attempts, there is no study related to first feeding time has been reported in any tropical groupers.
Generally, the initiation of first feeding is coincided with larval mouth opening stage (Cunha et al. 2003; Yoseda et al. 2006). At this time, the remaining yolk sac continues to nourish larvae before they are completely reliant on external feeds. Thus, to initiate first feeding precisely at mouth opening stage is often been neglected, presuming larvae are still able to obtain nutrient or energy sources derived from yolk sac. However, until now, the influence of delayed first feeding time on larval survival and its limitation of any tropical groupers including the tiger grouper are remains unspecified.
Hence, effects of delayed first feeding at every 6 hours (h) interval from mouth opening stage to completion of yolk sac absorption on larval survival and growth of the tiger grouper was investigated. While, larval maximum tolerance to starvation was indicated by the point of no return (PNR). Additionally, yolk sac volume and its absorption period were compared to clarify the differences of remaining volume and time of energy supply to the larvae fed at different onset of first feeding time. Larval nutritional condition was also examined
morphologically and physiologically, seeing that both parameters ultimately influence on larval survival and growth performances at and after first feeding stage.
While in chapter 3, SSRD, one of the recent and highly speculative phenomenons related to grouper larval survival at early stage was discussed. In fact, SSRD had been documented previously in the red sea bream Pagrus major (Kitajima et al. 1993), greater amberjack Serio/a dumerili (Shiozawa et al. 2003) and bluefin tuna Thunnus orientalis (Miyashita 2006) and larval sinking syndrome was proven to responsible for its occurrence.
Sinking syndrome causes larvae to possess higher sinking tendency particularly at night owing to cessation of swimming activity, as larvae gradually became inactive due to lesser feeding activity and lower body metabolism (Sabates 2004; Hare et al. 2006). In addition, larval buoyancy (either sink or float) is greatly associated with their body density (Woolley and Qin, 2010). Fish larvae with denser body attain negative buoyancy and likely to sink to the bottom, or vise-versa. It can be lethal to larval survival as glue-alike mucous on groupers upper body epidermis could be easily contacted with various pathogenic bacteria that abundantly loaded on the tank bottom (Miyashita 2006). However, the existence of both sinking syndrome and SSRD are remained unknown in groupers.
Therefore in the chapter 3, the existence of sinking syndrome in the kelp grouper and tiger grouper was initially clarified through direct observation on larval distribution in the rearing tank at daytime and nighttime. This information was used to estimate larval distributive tendency area in daily basis. For further justification on the existence of sinking syndrome, larval sinking velocity was measured at nighttime and its tendency was examined. Meanwhile, to further understand the mechanism controlling larval buoyancy, larval body density at daytime and nighttime and swim bladder inflation and deflation rhythm were examined.
In chapter 4, the second approach, flow field control, was used to prevent SSRD in the kelp grouper and tiger grouper. Owing to the cessation of swimming activity at night, larval distribution is commonly accorded by water current generated from aeration (Sundby 1983), termed as flow field (Nakagawa et al. 2011). This indicates the possibility to use aeration to produce flow field that enable to control larval distribution by transporting them away from the tank bottom to prevent SSRD.
However, it is important to note that flow field is differs in aeration rate (Shiotani et al. 2005) and this marks the need to clarify ideal aeration rate at night until favorable flow field is produced. Thus, effects of different aeration rates adjusted at night on larval survival, growth and stress ievei in reiation to reduce SSRD were investigated. Additionally, flow field produced by different aeration rate was quantified in order to describe typical larval distribution based on flow and larval velocities in larviculture tank. Through the introduction of these two independent approaches, this study aims to enhance early larval survival of the kelp grouper and tiger grouper.
SUCCESSFUι INITIATIONOFLARVA王 GROUPERSFIRST FEEDING C血gFuiFui:ハタ類ΞPiπephe1加SP.仔魚の生残率改善
2.1 1ntroduction
Ihe tiger grouper is arnong the widely distdbuted tropical groupers in soutbeast Asia region notably in Malaysia, hldonesia, philippines a11d Thailand (Liao et al.2001; sugalna et al.2008; Toled0 200& YaS11ir0 2008). owing t0 壮le wide distdbution, dley are also hlown as brown marbled grouper (Mokh稔r et al.20ID, blotch grouper (Mat Ni et al.2006) atld aowew cod (pears et al.2007).
C1玉、PTER2
111e tiger grouper is one the most importa11t 仇rgeted species in b0血 Seafood a11d aquaculture industdes, a11d for stock enhancement progtaln.1n seafood industry, they are Mghly Phced by 仕leir exce11ent meat qualiw a11d 壮le 仇Ste (Afero et al.2010).1hus,the demand ofthe tiger grouper has tremendously grown actoss soU壮least Asia11 region. However,小e Sustainability of the tiger grouper sea血od industry is 0丘en h血dered by the insU缶Cie址 Supply Of Mld caught due to overexploi仇tion of natural resources (sadovy 200の. Thus, hatchery Produced tiger grouper is significa11tly imporm11t
Ihe tiger grouper are 壮le most popular cultured grouper owing to theit rematkably fast growth a11d 11igher market pdce (Afero et al.2010). However, mass mortality at early larval S仇ge remains a nlajor constra血tt0 壮1巳 development of血e industr}1(Kolm01998; MatAliet al 2006). several Sωdies have attempted to en11a11Ce larval survival of 杜le tiger grouper, such as morph010gical development (Koh110 et al.1993),1awal cult11re teclmiques (Lim 1993) a11d live feed suitability (Eusebio et al.2010). Nevemleless,1aNal suNival remains poor due to first feed註lg・related complications.
Genera11y, grouperS 血itiated 負rst feeding at moU仕10pening S仇ge (Naga110 et al.2000; Yoseda et al.2006b). At t11is time,1awae have sma11 yolk sac and its absorption pedod is short (Kohn01998), resulting 血 a short nU訂'itiona1 廿a11Sition pedod (NTP), descdbed by Fhyn U989), between the onset of exogenous feedi11g atld the end of yolk sac absorption. presunling larvae
are able to rely on yolk saC 命r providing food or energy sourcest11roughout 壮le N'rp,t0 血itiate
丘rst feeding at mouth opening S仇ge is 0丑enbeen neglected. However,血e limi稔tion a11d e丑'ects
Of delayed first feeding W此hin the NTp on larval suNival atld growth are remains poorlyThus, the present study was undertaken to clarify the limitation and effects of delayed first feeding time within the NTP on the tiger grouper larval survival, growth, feeding performance and nutritional condition.
2.2 Materials and Methods 2.2.1 Egg Collection
Fertilized eggs of the tiger grouper were obtained from captive broodstock that spontaneously spawned at the marine hatchery of the Centre of Collaborative Research in Aquaculture (Universiti Malaysia Sabah-Kinki University) in Sabah, Malaysia, between 26 and 31 July 2009. Eggs were collected from a single spawning (second day spawn) from a flow-through screen installed inside the broodstock tank on 27 July 2009 and incubated in a 900 L fiberglass reinforced plastic tank. Eggs were stocked at approximately 30 eggs L-1 and gently aerated at
250 mL min-1. Water temperature, pH and dissolved oxygen in the incubation tank were in the
ranges of 28.0 to 29.0°C, 6.3-7.2 and 6.5-6.9 mg L-1 respectively. Hatching time was defined as
the time when at least 50% larvae were hatched out. Hatching rate was recorded at 86. 7% as observed at 14:00 h.
2.2.2 Indication of First Feeding Time
Larval morphometric measurement and observation were carried out to infer the tiger grouper readiness for first feeding commonly used in grouper species (Hussain and Higguchi 1980; Y oseda et al. 2006a), whereby larvae have pigmented eyes, opened mouth with functional lower jaw, peristaltic movement on their intestine and opened anus.
Initially, newly hatched larvae
(n
= 10) (0 hour after hatching, h AH) were randomlysampled from the hatching tank at 6 h intervals for morphometric measurements. Larvae were placed on a slide glass under a profile projector (PJ3000, Mitutoyo, Kawasaki, Japan) for measurements of total length (TL), yolk sac length (YSL), yolk sac height (YSH), oil globule length and oil globule height. The yolk sac volume (YV) was measured using the formula for a prolate spheroid YV = rc/6 x YSL x YSL2where
l
is the YSL andhis
the YSH. The oil globulevolume (OGV) was measured using the formula OGV =2/3 x 7t x (d/2)3, where dis the diameter
Ching Fui Fui : /'> 37 ffi Epinephelus sp.1-f� O)'.'.£!\U$��
While the morphometric measurement was performed, larval first feeding time was indicated based on the morphological characteristics mentioned previously. Larvae were digitally photographed (IXUS 95919, Canon, Tokyo, Japan) under a light microscope (Eclipse E600, Nikon, Tokyo, Japan), with particular attention the timing of initial feeding related organs, such as eyes, mouth, intestine and anus. In the present study, all these organs were nearly ready at 53 h AH and larvae were gently transferred via a 0.5 L beaker from the hatching tank to the experimental tank. The larvae were stocked at 30 individual L-1 in each tank.
2.2.3 Larval Rearing and Experimental Design
In this study, a first feeding of larvae was performed at 54 h AH (28.5±0.5 °C). This rearing temperature was chosen based on the findings from preliminary experiment (unpublished data), in which larvae had performed significantly higher survival and growth, initiated first feeding earlier and null deformation. By considering marine fish larval feeding activity is relatively low at night (Gilbert et al. 1992, Vollset et al. in press), we manipulated larval hatching and first feeding time by scheduled artificial egg collection time to allow first feeding time only occurred at daytime. In this study, first feeding was initiated at 54 h AH at 09:00 h and defined as Oh after mouth opening (0 h AMO). First feeding time was delayed by 6 h intervals, ranging 0, 6, 12, 18 and 24 h AMO.
The experimental design comprised 15 of 7 L plastic aquaria with 6.5 L of water volume and divided into five groups to resemble five different first feeding times. Each treatment was carried out in triplicate. A single air stone placed on the bottom center of each tank gently aerated all tanks. A 24-h light regime was provided by 12L: l2D by means of 12 h of natural light during daytime (06:00-18:00 hours) and 12 h by fluorescent light (18:00-06:00 hours) at night. At first feeding, rotifer, Brachionus plicatilis sp. complex and cultured Nannochloropsis oculata were supplied at a density of 30 individual L-1 and 0.5 xl06 cells mL-1
respectively. Rotifer enrichment was prepared earlier before feeding was introduced to the larvae by using oil emulsion consisted of egg lecithin and fish oil, according to Watanabe et al. 1982.
From Oh AMO, larvae were taken and slightly anaesthetized with 25 ppmTransmore (Nika, Nika Trading, Puchong, Malaysia) from each triplicate group to compare TL, YV and OGV at different first feeding times. Larval TL was measured at 6 h intervals up to 78 h AH and continued at 5 day intervals. Larval YV and OGV were measured until the yolk sac and oil
beaker filled with anesthesia-free water according to Ross (2011). During the recovery process, larval swimming activity was gradually resumed from motionless lying on the bottom to active swimming throughout the entire water column. The recovery process took approximately 1-2 minutes and larvae were returned immediately to the experimental tank.
Daily larval feeding intake was determined by calculating the average number of ingested rotifer in the gut (ANR) at 09:00 and 15:00. The ANR was determined using the following ANR= "'iLi/N, where i represents the number of rotifers in the digestive organ of the ith larval individual (i=l,.n), and N is the number of larvae. Survival was determined daily and the limitation of delayed first feeding time was indicated by the point of no return (PNR), when 50% of unfed larvae would be unable to take up feed (even if food made available) and eventually die (Bagarinao 1986).
Daily routine regimes were included · bottom cleaning and water renewal for rearing maintenance purposes. Rearing seawater of 10-20% in tank was refilled with filtered seawater. In addition, the densities of both rotifers and N oculata were uniformly maintained at throughout the experimental period, respectively. Water quality, dissolved oxygen (HANNA HI 9146, HANNA, Atlanta, USA), temperature and pH (HANNA HI 9125, HANNA, Atlanta, USA) were monitored twice daily at 09:00 and 16:00. The experiment was conducted over 15 days.
2.2.4 Larval Nutritional Condition
For assay larval nutritional condition, additional 5 of 7 L plastic aquaria with 6.5 L of water volume were prepared for sampling purposes. Larval stocking density and rearing protocol were similar to those in rearing experiment described in chapter 2.2.3. Larval nutritional condition was assayed 1) physiologically through the observation of gut epithelium development, owing to its high sensitivity index to detect the presence of any remarkable ontogenetic changes in fish larvae (Govoni et al. 1986) and to determine larval ingestion ability (Yufera et al. 1993); 2) morphometric measurement of each body proportion including body length (BL), body height (BH), pectoral angle height (PH), eye height (EH), gut height (GH) and head height (HH).
For physiological assessment, larvae were sampled (n=5) from O h AMO at 6 h
intervals up to the end of yolk sac absorption time and histological section was used to observe and compare larval gut epithelium development in each treatment. Sampled larvae were initially
ml of l % glacial acetic acid), dehydrated in graded alcohols and embedded in paraffin and cut in serial sagittal sections (6 µm) and slides were stained by the Haematoxylin and Eosin (H&E).
The section were examined and measured under a light microscope (Eclipse 80i, Nikon, Tokyo, Japan) and photographed using image analysis (ImageJl.44P, ImageJ, Wayne Rasband, USA). For larval morphometrical analysis, sampling number and period were similarly described in physiological analysis. The observation and measurement on each proportion of larval body were carried out under light microscope.
2.2.5 Statistic Analysis
Statistical analysis was performed using SPSS 15.0 software (SPSS Incorporation, Chicago, IL, USA) and a significance level of P<0.05 was applied. One-way-ANOVA was performed to compare larval survival, growth, average number of ingested rotifer, gut epithelium height, body height, pectoral angle height, eye height, gut height, and head height. When a significant difference was found, a post hoc test using Tukey's HSD was performed to ascertain any significant differences between treatment means.
2.3 Results
2.3.1 Yolk Sac and Oil Globule Volume and Absorption Period
Table 2.1 summarizes the YV and OGV, its absorption times and the NTP of larvae fed at different first feeding times. The YV and OGV were rapidly absorbed with an increase in delayed first feeding times. At hatching, larval YV and OGV were 1782.3±560.0 xl04 and
62.9±12.8 xl04 mm3, respectively, and progressively decreased as larvae aged. The onset of
mouth opening was observed at 54 h AH (09:00 h) at 28.5±0.5 °C and, from this time on, both YV and OGV were consumed more rapidly, with significant differences (P<0.05) among treatments (Table 2.1). The YV was first completely absorbed at 66 h AH, as shown by the larvae initially fed at 18 and 24 h AMO, and shortly afterwards at 68, 69 and 74 h AH by the larvae initially fed at 12, 6 and O h AMO respectively. The differences in larval yolk sac absorption time resulted in a dissimilarity with the NTP. The longest NTP was recorded at 20 h, shown by the larvae initially fed at Oh AMO. In contrast, the larvae first fed at 6, 12, 18 and 24 h AMO had a comparatively shorter NTP with 15, 14 and 12 h (Table 2.1).
grouper, Epinephelus fuscoguttatus larvae fed at different first feding time. Larvae were first fed at 54 h AH, defined as O hafter mouth opening (h AMO)
First feeding time,
Mean volumes±SD of yolk sac and oil glouble ( xl0·
4mm) at hours after hatching (h AH)
Yolk sac
Nutrional
/::iihours after mouth
54
60
66
72
78
absorption at transition
opening (h AMO)
YV
OGV
YV
OGV
YV
OGV
YV
OGV
YV
OGV
(hAH)
period (h)
0
28.0±0.3" 12.9±0.3" 25.0±0.2" 10.9±0.1" 8.2±0.1
a7.0±0.4" 0 0.002±0.001
a0
0
74
20
6
28.0±0.2" 13.0±0.2" 13.6±0. l
b8.7±0.i 5.4±0.i 5.7±0.i 0 0.0002±0.0001
b0
0
69
15
>--' 00 0012
28.3±0.2" 13.1±0.2" 13.7±0.l
b8.1±0.5
b3.4±0.2
°2.7±0.2" 0
0
0
0
68
14
.:iju18
28.2±0.3
313.0±0.1
314.0±0.1
°8.6±0i
0
2.8±0.0
°ND
ND
ND ND
66
12
24
28.o±o.o• 12.7±0.6
314.0±0.4
°8.7±0.i
0
2.8±0.1
°ND
ND
ND ND
66
12
0 >--'* Mean values in the same column with different superscript are significantly different (P<0.05)
� .i,.ChingFuiFui: /,7'ffi Epinephelus sp.1-f�0)1:_�$�� 2.3.2 Larval Survival and Growth
Delayed first feeding had strongly affected larval survival (Fig. 2. lA). At the end of the experimental period (360 h AH), the highest mean survival was attained by the larvae initially fed at Oh AMO (21.3±2.5%).
-&j 1,-,ca
...
;:j 120 100 80 60 40 20 0 10.0 8.0 6.0 4.0 2.0 0.0 0 50 100 150 200 250 300Hours after mouth opening (h AMO)
5 10
I
I
A
B -0-0-6-6
-C:-12
-¢-18
-=-24
350 400 15I
Days after hatching (d AH) Fig. 2.1. (A) Mean survival rate±SD (%) and (B) growth (total length±SD, mm) of tiger grouper, Epinephelus Juscoguttatus, fed at different first feeding times and reared at 28.5±0.5 °C. First feed intake was observed at 54 h after hatching (h AH) and defined as Oh after mouth opening (h AMO). Each line with different symbol represents different first feeding times.
At the onset of mouth opening (0 h AMO, 54 h AH), the mean survival was not significantly different (.P>0.05) among treatments, but progressively decreased in all treatments after the onset of mouth opening. At 5 days after hatching ( d AH), the mean survival of the larvae initially fed at O h AMO (63.6±0.8%) was significantly higher (P<0.05) than those initially fed at 6 and 12 h AMO (44.0±0.8 and 19.6±0.6%) respectively. At 10 d AH, only the larvae initially fed at O and 6 h AMO were survived. However, mean survival of larvae first fed at O h AMO (30.3±8.2%) was significantly higher (P<0.05) than that in the 6 h AMO (8.0±2.0%).
The TL of larvae under various first feeding times is shown in Fig. 2. lB. At the onset of mouth opening, there was no significant difference (P>0.05) in larval TL between the treatments; however, three growth patterns were evident (Fig. 2. lB). The first pattern was a rapid growth in the larvae initially fed at Oh AMO, attaining the highest growth (8.2±0.2 mm) at 15 d AH. The second was a moderate growth pattern in the larvae initially fed at 6 h AMO, which grew steadily to 4.9±0.4 mm, but were slower than the larvae initially fed at Oh AMO. The third was a negative growth pattern, as observed in the larvae initially fed at 12 h AMO, with a shrinkage body and a decrease in TL from 2.8±0.0 mm (54 h AH) to 2.6±0.1 mm (5 d AH).
2.3.3 Point of No Return
Larval mortality was initially observed at 68 h AH in the larvae initially fed at 18 and 24 h AMO (Fig. 2.2), followed by those initially fed at 12 h AMO at 192 h AH and 6 h AMO at 240 h AH (Fig. 2.1). The survival rate of unfed larvae (18 and 24 h AMO) started to decline to 50% in which PNR was observed at 13 h AMO (Fig. 2.2). At this time, larvae showed weak activities and became defenseless against starvation. When larvae were subjected to the PNR, larvae were unable to resume feeding even when feed was available, and finally died. In addition, instant mortality was observed when first feeding was initiated beyond the PNR.
120 100 C1血gFuiF山:ハタ類ΞP加ephe1紹SP.仔魚の生残率改善 80 ・ーニー0 60 40 ^6 20 ・ーー12 0 PNR=BhAMO 6 12 18 24 0
Hours a丑ermouthopening (hAMO)
Fig.2.2 Poi址 of no re加m (P卜JR) of tiger grouper,五P加ephe11ιS jiιScog1ιttams aS 血dicated by pointed arrow, when 50% of stawed larvae Were utlable to suNive a11d re6.1Sed to cotrmlence feeding even when food Was made available. Each cuNe with di丑'erent symbolreptesents different 丘rst feeding times
^18 ー)・・,24
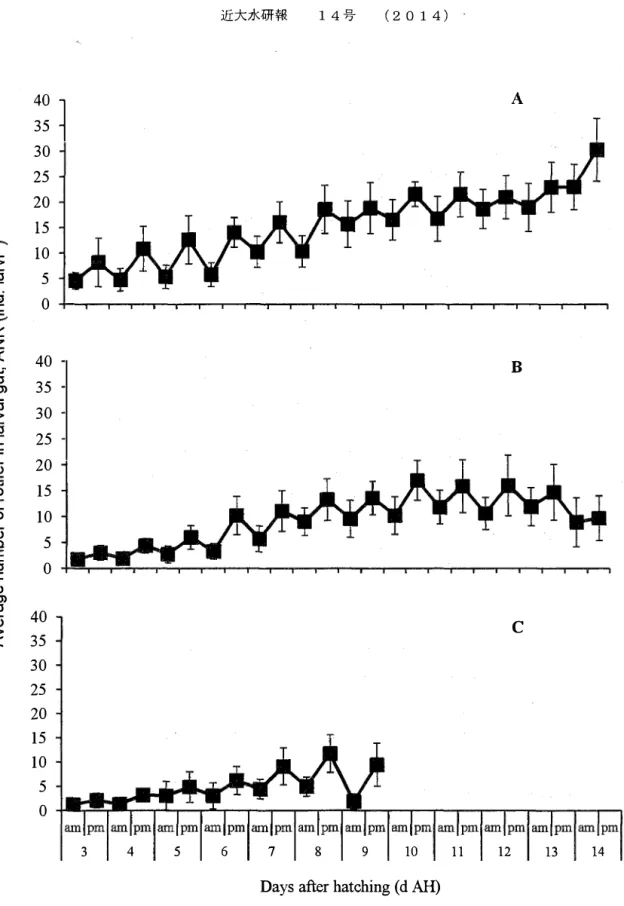
2.3.4 Feed lntake
LawalANR wasrelatively higher hlthose laNae in辻ia11y fed 飢 o h AM060.3士6.2 血dividU飢
IaM、') as compared Mth 壮le lawae fed at 6 h AMo a7.1士3.8 血dividua11arvi、') a11d 12 h AMO
(11.8士3.9 血dividua11aM、')(Fig 23). The ANR of 血Ose lawae il'tia11y fed 飢 0,6 a11d 12 h
A入10 were graduaⅡy increased t11roughout the expedment pedod. However, no clear feedmg Pa杜em was observed in a11the laNae 丘rst fed at othert血es. hlcontrasL no feeding activi切 Was ObseNed in those larvae initia11y fed at 18 and 24 h AMo as laNae were subjected to pNR (Fig.22))2:
co
"C C a:::: <( _.-0)ro
� '-0 0 CJ) C CJ) 0)co
'-<(4
0
1
35A
T
30 25 20 15 10 5 0 40 35 30 25 20 15 10 5 0 40 35 30 25 20 15 10 5 0B
C
3 4 5 6 7 8 9 10 11 12 13 14Days after hatching ( d AH)
Fig. 2.3. Variation in the average number of rotifers in the gut (ANR, ind. larva·1) of tiger grouper Epinephelus fuscoguttatus, fed at different first feeding times and reared at 28.5±0.5 °C. (A) ANR of larvae initially fed at O h AMO; (B) larvae initially fed at 6 h AMO and (C) larvae initially fed at 12 h AMO.
2.3.5 Nutritional condition
2.3.5.1 Gut Epithelium Development
Delayed 丘rst feeding time had strongly a任ected laNal gut epithelium development (Fig.2.5)
At o and 6 h AM064 a11d 60 h AH), a111aNae had a slightly developed gut coupled W丘hPedstaltic movement, a11d the average gut epithe1川m heights were 7.53士0.41 釦d 9.43士0.71 μm
respectively, without significa11t dia'erences in a11treatments (四>0.05)(Fig.2.4). However, at
12 h AMO (72 h Afl), a remarkable i11Creased (Pく0.05) of gut epithelium height was observed
in the lalvae i11itiaⅡy fed at o h AMO (12.96士0.65 μm), WMle a rapid reduction was obseNed in
those laNae i11itia11y fed at 6,12,18 and 24 h AMO (6.66士0.87,2.59士0.19,1.92士0,06 a11d
1.85士0.02 μm) respectively (Fig.2.4). As laNae aged at 18 h AMO (84 h AH), gut epithelium
height oflaNae inma11y fed at o h AMo had signiaca11tly 血Creased t0 14.81士0.24 μm (Pく0.05)
X入lhile, a conti11Uous reduction ofgut epithelium height was observed in laNae initia11y fed 飢 6h AMO (4.07士0.15 μm) a11d 12 h AMo a.85士026 μm), respectively and severe damage on
Connective tissue surrounding larvalgut was obselYed (Fig.2.5C)C血gF11iF山:ハタ類ΞPi"ephe1那SP.仔魚の生残率改善
・ーコー0 『生一,6 ・イト12
12
6
0
Hours a丑er mouth opening (h AMO)
Fig.2.4. Gut epithelium height Uιm) of tiger grouper 五Pi11ephelus
jiιScog1ιttams fed at di任erent i11itial feeding times a11d reared at
28.5士0.5゜C. Each cuNe with different symbol represents di任erent 負rst
feeding times -X-18 ーひ・・24 18 (Ξ3三如雪旦毛侶区Uぢ口6420
16 N n 1。 8Fig. 2.5. Gut epithelium of tiger grouper Epinephelus fuscoguttatus fed at different first feeding times and reared at 28.5±0.5°C (A) Gut was undifferentiated and straight at the
onset of first feeding time; (B) rapid development of gut epithelium shown by larvae initially fed at Oh
AMO
at 18 h AMO (72 h AH) and (C) severe damage on connective tissues surrounding gut of larvae initially fed at 12 hAMO
at 18 h2.3.5.2 Morphometric Developments
All the morphometric measurements on each body proportion of larvae initially fed at O h AMO had increased gradually as they developed (Fig. 2.6). While larvae initially fed at 6, 12, 18 and
2.8 2.7 2.6 2.5 2.4 2.3 2.2 2.1 Body length (mm) 0.7 0.6 0.5 0.4 0.3 0.2 0.1 Pectoral height (mm) -24 2.0 -i---r---.---.---,---, 0 -+--�--...---....---, 0.8 0.7 0.6 0.5 0.4 0.3 0.2 0.1 Body height (mm) 0.30 0.25 0.20 0.15 0.10 0.05 Gut height (mm) 0.0 -t---r----..---,.--,---, 0.00 +--���--.----.---.-���� 0.20 0.19 0.18 0.17 0.16 0.15 Eye height (mm) 0.75 0.65 0.55 0.45 0.35 Head height (mm) 0.14 +----.----.--... ---.----, 0.25 +---,----,---,,----,----, 0 6 12 18 24 0 6 12 18 24
Hours after mouth opening (h AMO)
Fig. 2.6. The morphometric measurements of six different body proportions of of tiger grouper
Epinephelus Juscoguttatus,
fed at different first feeding times and reared at 28.5.0±0.5 °C. Body length (BL), pectoral height (PH), body height (BH), gut height (GH), eye height (EH) and head height (HH).24 h AMO experienced slow development and degradation of entire body proportions (Fig. 2.6). At the end of yolk sac absorption, the larvae first fed at O h AMO attained the highest growths in BL (2.70±0.11 mm), BH (0.70±0.04 mm), GH (0.26±0.06 mm) and HH (0.65±0.07 mm) and remained significantly higher (P<0.05) than those of larvae observed in 6 h AMO (BL: 2.31±0.09 mm; BH: 0.39±0.06 mm; GH: 0.23±0.08 mm; HH: 0.57±0.06 mm) and 12 h AMO (BL: 2.29±0.04 mm; BH: 0.22±0.02 mm; GH: 0.12±0.04 mm; HH: 0.42±0.01 mm).
Growths in PH and EH were insignificant (.P>0.05) between larvae initially fed at Oh AMO (0.61±0.02 mm and 0.19±0.00 mm) and 6 h AMO (0.53±0.08 mm and 0.18±0.00 mm) but remained significantly larger (P<0.05) compared to the larvae initially fed at 12 h AMO (0.12±0.00 mm and 0.15±0.00 mm) respectively. Meanwhile, final morphometric measurements of each body proportions were significantly smaller in the larvae first fed at 18 and 24 h AMO just before their instant mortality was observed (Fig. 2.6).
2.4 Discussion
The present study shows the maximum tolerance and affects of delayed initial feeding time within the NTP on larval overall performance are highly associated with yolk sac volume and absorption period. The YV of the tiger grouper larvae (1782 xl04 mm3
) is comparatively
smaller than many other marine fish larvae at the time of hatching, e.g. Malabar grouper
E.
malabaricus (1910 xl04 mm3) (Yoseda et al. 2006a), European seabass Dicentrachus labrax
(2190 xl04 mm3), sea bream Archosargus rhomboidalis (3400 xl04 mm3) (Houde 1974) and
milkfsh Chanos chanos (4744 xl04 mm3) (Bagarinao 1986). This feature makes the tiger
grouper larvae are particularly difficult to rear, presuming larvae had only a short period of energy or food sources derived from the remaining small yolk sac to undergo various important developmental stages at early stage (Gisbert et al. 2002; Marte 2003). Within a short period of yolk sac supply, catastrophic mortality could happen particularly if larvae failed to develop their feeding ability (Fhyn 1989; Busch 1996; Yoseda 2008).
Grouper yolk sac absorption rate varies with species (Lein et al. 1997; Jordaan and Kling 2003), salinity (Hart and Purser 1995; Swanson 2005), temperature (Fukuhara 1990; Berlinsky et al. 2004) and first feeding time (Y oseda et al. 2006a), as described previously in Malabar grouper (Y oseda et al. 2006a), leopard grouper Mycteroperca rosacea (Gracia-Lopez et al. 2004), white spotted green grouper E. amblycephalus (Tseng and Chan 2009) and brown spotted grouper E. tauvina (Akatsu et al. 2009). Temperature is also one of the decisive factors influencing larval initial feeding time. The rearing temperature in this study was fixed to
28.5±0.5°C, which is suitable to temperature for culturing tropical groupers (Senoo et al. 2002;
Looi and Senoo 2008). In the present study, larval yolk sac volume and absorption rate were rapidly reduced with an increase in delay of initial feeding time, resulting in differences between treatments. This indicates the onset of feeding time can profoundly affect both volume and time span of food or energy supply to the larvae. This result is in agreement with previous reports in Malabar grouper (Y oseda et al. 2006a) and Asian seabass, Lates calarifer (Kailasam et al. 2007).
When first feeding was introduced at Oh AMO, the tiger grouper larvae consumed the supplied feed, even though the yolk sac was still visible, resulting in a longer NTP (for 20 h). This is advantageous of larvae, as they would have a longer preparatory time to gain feeding experience and improve feeding ability before becoming entirely reliant on external feed sources. A well-developed feeding ability of the tiger grouper larvae first fed at Oh AMO was proven in the present study as larvae attained the highest feed intake and growth.
The higher feed intake of the larvae is closely associated to their ingestion ability with a well-developed gut epithelium. The findings from this study had clarified that feeding time immediately at O h AMO prolongs larval preparatory time to develop ingestion capability before entirely depends on external food. A rapid development on gut epithelium shown by the larvae initially fed at O h AMO had allowed successful assimilation of ingested nutrients for larval growth. A similar report had been documented in orange spotted grouper, E. coioides (Toledo et al. 2002) and gilthead seabram, Spratus aurata L. (Yufera et al. 1993). Moreover, as in other grouper species, the onset of initial feeding time is coincided with time to get functional mouth, eyes and intestine; thus the rapid and normal morphometric organ developments in the tiger grouper larvae had firstly led to the successful feeding ability.
Unlike fed larvae, starved larvae (6,12,18 and 24 h AMO) experienced a shorter NTP (15,14,12 andl 2 h). The yolk sac, which served as the sole energy resource for starved larvae, was rapidly absorbed to compensate the energy used to undergo various morphological and physiological processes in early stages. Furthermore, the absence of an external food source around the completion of yolk sac absorption had led to fast yolk sac absorption. Therefore, it increased larval susceptibility to starvation, which in tum induced poor feeding performance and impaired growth in early larvae (Blaxter and Hempel 1963; Pena and Dumas 2009). There are some similar reported in brown spotted grouper (Hussain and Higguchil980; Yoseda et al. 2006a; Yoseda et al. 2006b) and Japanese flounder Paralichthys olivaceus (Dou et al. 2002).
The instant mortality observed in the tiger grouper larvae first fed at 18 and 24 h AMO at 72 h AH, approximately 5 h after the PNR has clearly indicates that delayed first feeding within the NTP, even yolk sac visibie, is not recommended. At this time, the PNR had induced further deterioration in larval feeding ability due to histological and morphological deformities on their feeding organs (Yin and Blaxter 1987; Shan et al. 2009). Histologically, gut epithelium of unfed larvae was significantly narrow and thin, and severe damage on a thin layer of connective tissue was observed. Accordingly, the ingestion ability of unfed larvae was critically affected, and assimilation of nutrient for growth developments was unable to be carried out (Gisbert et al. 2002).
In addition, degradation of larval entire body proportions and negative allometric growth shown by unfed larvae had further deteriorated their feeding ability. Accordingly, unfed larvae were eventually subjected to greater starvation affects and feed intake varied considerably, as did growth performance, similarly reported in several groupers species, such as orange-spotted rockcod, E. suillus (Duray et al. 1996), orange spotted grouper (Toledo et al. 2002), Malabar grouper (Y oseda et al. 2006a) and dusky grouper, E. marginatus (Russco et al. 2009).
The present study reveals initial feeding time plays a critical role for larvae to develop their physiological and morphological functions. This study recommends that initial feeding immediately at mouth opening stage, even yolk sac still visible, to maximize larval survival and growth of tiger grouper. This chapter reveals that the delay of initial feeding can trigger severe and negative effects on larval survival and growth.
Ching Fui Fui : /, :1 ffi Epinephelus sp.
ff�
(J) 1:.�i$��CHAPTER3
DETECTIONS OF SINKING SYNDROME IN LARVAL GROUPERS
3.1 Introduction
Similar to tropical groupers, poor and irregular larval survivals of any temperate groupers are reported as a common scenario (Fukuda et al. 1996; Chi et al. 1999; Liao et al. 2001). According to Sugama et al. (2004), various biotic and abiotic factors are responsible for groupers mass mortality at early stage. Among all these factors, grouper larval mortality is frequently classified into two patterns; 1) larvae died on water surface, termed as surface tension related death
(STRD)
(Yamaoka et al. 2000; Kaji et al. 2003; Ruttanapomvareesakul et al. 2007) and 2) larvae died on the tank bottom (Shiotani et al. 2005; Sakakura et al. 2006), termed as sinking syndrome related death (SSRD) in this dissertationIn this decade, various attempts have been carried out to develop practical larviculture methods to overcome both STRD and SSRD in order to maximize survival of early grouper larvae (Kohno et al. 1998; Nagano et al 2000). For instance, STRD can be prevented by various devices such as oil films (Kaji et al. 2003), light intensity (Yamaoka et al. 2000), water current (Shiotani et al. 2005), floating skimmer (Trotter et al. 2005) and protein additives (Tagawa et al. 2004). However, prevention of
SSRD
poorly understood particularly in grouper larviculture.SSRD
is highly associated with larval sinking tendency particularly at night (Nakagawa et al. 2011; Kurata et al. 2011 ). It is attributed by negative buoyancy of fish larvae at night, owing to lesser feeding activity, metabolism and swimming activity at night (Kitajima et al. 1993; Yoseda et al. 2008). Under these circumstances, larvae eventually become passive and gradually sink to the tank bottom (Hoss et al. 1989), termed as sinking syndrome (Miyashita 2006). When a large number of fish larvae sink on the tank bottom, mass mortality occurs from either suffocation by the sheer volume of larvae (Mangino and Watanabe 2006) or encounter with various infectious diseases derived from low immune responses (Kayim et al. 2010). This phenomenon had been previously documented in the red sea bream (Kitajima et al. 1993), barfin flounderVerasper moseri
(Kayaba et al. 2003), greater amberjack (Shiozawa et al. 2003), bluefin tuna (Miyashita 2006), summer flounderParalichthys dentatus
and Atlantic menhadenBreevortia tyrannus
(Hare et al. 2006). Nevertheless, its existence in groupers is poorly understood but remains highly speculative.Therefore, the objective of this chapter was to clarify existence of SSRD in the kelp grouper and tiger grouper. Initially, an in-situ study on larval distribution was conducted in daily and diurnal basis. This method is useful for early detection of SSRD in hatchery basis. To further detect the existence of sinking syndrome in both groupers, larval sinking velocity and patterns at night was measured. This parameter is considerably useful for providing direct and reliable technique on larval survival (Hare et al. 2006). A similar method was used previously in bluefin tuna (Nakagawa et al. 2011), southern flounder Paralichthys lethostigma and Atlantic croaker Micropogonias undulates (Hare et al. 2006).
In addition, it is also important to note that larval distribution and sinking velocity are closely related to the mechanisms controlling larval buoyancy (sinking and floating) in the rearing tank (Aadlandsvik et al. 2001). Larval buoyancy is greatly correlated to their body density (Sclafani et al. 1997; Takashi et al. 2006), whereby larvae with the denser body will perform the higher sinking tendency and vice-versa. Addition to larval body density, a strong correlation is observed between larval buoyancy with swim bladder inflation and deflation rates (Lindsey & Qin 2010). Through swim bladder inflation at nighttime, it increases larval buoyancy and enables larvae become less buoyant (Trotter et al 2005).
Owing to the recognition of importance to prevent SSRD, larval distribution in a rearing tank, sinking velocity, body density and swim bladder inflation and deflation were clarified for the kelp grouper and tiger grouper.
3.2 Materials and Methods
Part I: Larval Sinking Distribution and Velocity 3.2.1 Egg Collection
Fertilized eggs of the kelp grouper were obtained by an artificial insemination, followed by human chorionic gonadotropin (HCG) hormone injection into female brood stock at the Ohshima Laboratory Station, the Fisheries Laboratories of Kinki University (FLKU) on 11 May 2010. The eggs were transported to Shirahama Fish Nursery Center of Kinki University on 12 May 2010 and gently transferred into experimental tank at the density of 1500 eggs kL"1. Hatching with 93.0% occurred on day 2 after spawning at 21.8±0.2°C.
Meanwhile, fertilized eggs of the tiger grouper were obtained from broodstock kept in a floating sea cage that spontaneously spawned at the Kingfisher Fish Farm Sdn. Bhd. Sabah, Malaysia between 28 and 31 September 2010. Eggs were collected on 29 September 2010 from
ChingFuiFui: /,7'� Epinephelus sp.tfm0)1::.J�$Qil:�
an egg collector net installed within the floating sea cage adjacent to the broodstock cage. Eggs were gently packed, oxygenated and transported to the Centre of Collaborative Research in Aquaculture (Universiti Malaysia Sabah-Kinki University). Eggs were gently transferred into experimental tank at a density of 1500 eggs kL-1
. Hatching with 95.0% occurred on day 1 after
collecting at 28.0±0.5°C.
3.2.2 Larval Rearing and Experimental Design
Rearing experiment consisted of one 0.5 kL-1 cylindrical polycarbonate tank for larval sampling
and observation purposes. Aeration rate was uniformly fixed at 300 ml min·1 at daytime
(07:00-19:00 h) and adjusted to 300 and 900 ml min·1 at nighttime ((07:00-19:00-07:00 h) for 15 days. Fluorescent light and photoperiod were fixed to approximately 500-lx luminance from open water surface and at 12L:12D (07:00-19:00 h and 19:00-07:00 h) respectively. The water exchange was introduced from 4 d AH and refilled with volumes calculated d AH multiplied by 10% of tank volume in the kelp grouper. While, no water exchange was introduced due to the difficulty to install water circulation system in the tiger grouper. Yet, rearing parameters were strictly monitored as the kelp grouper larviculture.
Initial feeding occurred at 3 d AH, S and L types B. plicatilis sp. complex were introduced into to the tanks of kelp grouper and tiger grouper at 25 individuals mL-1
.
Commercialized Super Chlorella Vl2 (Chiarella Industry, Fukuoka, Japan) were added into each rearing tank at 0.75 x 10⁶ cells mL-1 respectively. Feed oil (NMT Himaku Oil, Nissin
Marinetech, Yokohama, Japan) of 0.1 mL was introduced daily into tanks to prevent STRD at 07:00 after switching on and adjusting aeration. The oil film on water surface was daily removed at 08:30, 13:00 and 16:00 to encourage larval swim bladder inflation.
Water temperature, dissolved oxygen (DO) and pH were recorded twice daily at 08:00 and 16:00 h using multiple water quality sensors (556 MPS, YSI Incorporation, Ohio, USA) in the kelp grouper larviculture tank. While, the separate water quality sensor was used in the tiger grouper larviculture tank to measure DO (HANNA HI 9146, HANNA, Atlanta, USA), temperature and pH (HANNA HI 9125, HANNA, Atlanta, USA).
3.2.3 Larval Distribution
Larval distribution in the rearing tank was qualitatively observed according to Irisson and Lecchini (2008). Initially, larval observatory tank (approx. 60 cm height) was divided into three proportions, 1) surface (approx. from l to 20 cm under water surface); 2) middle (approx. from
20 to 40 cm under from water surface) and 3) bottom (approx. from 1 to 20 cm above the tank bottom).
Larvai swimming activity was ciassified into active and passive according to Irisson and Lecchini (2008). Active larvae were defined to possess conspicuous body undulation with fin movement, while passive larvae were either drifting in the water current, usually positioned head down, coupled with little or no fin movement and lying on the tank bottom.
Observation was carried out three times daily approximately at 09:00, 14:00 and 19:00 from 4 to 12 d AH for every 2-day interval. These times were chosen by considering 1) 09:00; larvae started to response to the presence of feed at this time (Duray and Kohno 1988; Puvanendran and Brown 2002), 2) 14:00; larvae attain higher feeding and swimming activity at this time (Skiftesvik 1992; Gisbert et al. 2002) and 3) 19:00, larvae change in swimming behaviour soon after light was turned off. Aeration was initially taken out 5 minutes before larval observation was performed and each observation period was made approximately 10-20 minutes. Portable torchlight was used to observe larval distribution at 19:00.
3.2.4 Larval Sinking Velocity
The measurement of larval sinking velocity Vj (cm s·1) was performed at night (20:00-22:00) from Oto 12 d AH for every 2-day interval. To measure Vi, random sampling was conducted to collect larvae (n=20) from each sampling tank of the kelp grouper and tiger grouper respectively
by using a 5 L beaker. Larval total length (TL) was measured individually under a stereomicroscope (SMZ1500, Nikon, Nikon Corporation, Japan) for the kelp grouper and light microscope (Nikon, Eclipse E600, Japan) for the tiger grouper. Both larvae were photographed by using image analysis (lmageJl.44P, ImageJ, Wayne Rasband, USA) and digital camera attached to the light microscope (Canon, IXUS 95919, Japan), respectively.
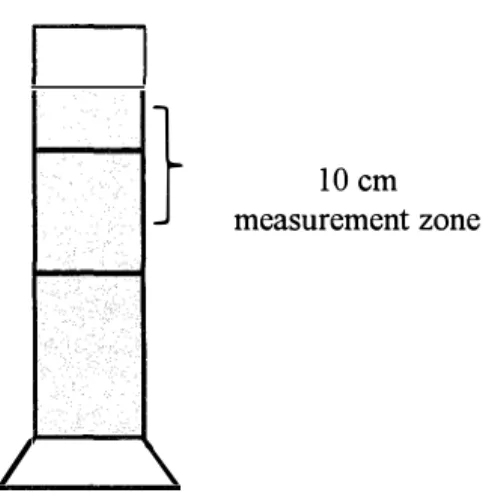
Larvae were mildly anesthetized using 200-ppm eugenol (FA-100, Mitsubishi Tanabe Pharma Co., Ltd., Osaka, Japan). Anesthetized larvae were gently transferred to the top of a I L cylindrical glass filled with filtered rearing water taken from the sampling tank (Fig. 3.1). A 10 cm measurement zone was marked on the cylindrical glass, and the time required by larvae to sink 10 cm was recorded using a stopwatch. Larval Vj was calculated using Vj = 10 cm/d.t, where
IO cm is the known distance and dt is the time required by larvae to sink l O cm. The larval Vj measurement of the kelp grouper and tiger grouper were conducted approximately at 24.0°C
Ching Fui Fui : /', -!J ffi Epinephelus sp.
ff�
0)1::_7�*-cj(i!f}
I
\.
10 cm measurement zone
Fig. 3 .1. Schematic diagram of the experimental system for measuring sinking velocity of the kelp grouper and tiger grouper larvae. The 1 L measuring cylinder has 40 cm height and 6.5 cm diameter respectively. The height of 10 cm measurement zone was marked and time taken by larvae to pass through this zone was recorded.
Part II: Larval Buoyancy: Body Density and Swim Bladder Inflation Rate 3.2.5 Egg Collection
Artificial fertilized eggs of the kelp grouper were obtained from a broodstock injected HCG hormone at the Uragami Experiment Station of FLKU on 12 June 2011. The eggs were transported to Shirahama Fish Nursery Center of Kinki University on 13 June 2011 and gently transferred into an experimental tank at the density of 1500 eggs kL-1
. Hatching with 94.5%
occurred on day 2 after egg collection at 21.6±0.3°C.
Meanwhile, fertilized tiger grouper eggs were obtained from broodstock kept inside a floating sea cage that spontaneously spawned at the Kingfisher Fish Farm Sdn. Bhd. Sabah, Malaysia. Eggs were collected on 28 September 2011 by collector net installed within the sea cage adjacent to the broodstock cage. Eggs were gently packed, oxygenated and transported to the Centre of Collaborative Research in Aquaculture (Universiti Malaysia Sabah-Kinki University). Eggs were gently transferred into an experimental tank at a density of 1500 eggs kL-1
3.2.6 Larval Rearing and Experimental Design
Similar larval rearing protocol was prepared as described previously in 3.2.2. 3.2. 7 Larval Body Density and Swim Bladder Inflation Rate
The measurements of larval body density (p.r) were performed at daytime (09:00-11 :00) and nighttime (20:00-22:00) from O toI2 d AH for every 2-day interval. Random larval sampling (n=20) was performed from a sampling tank using a 5 L beaker. Larval TL and swim bladder
inflation and deflation rate were measured under stereomicroscope and light microscope for the kelp grouper and tiger grouper respectively. Larval swim bladder inflation rate (SBI) was measured according to the equation, SBI (%) = 100 (LS/fL), where LS is the number oflarvae
with swim bladder and TL is the total number oflarvae (Naur et al. 2004)
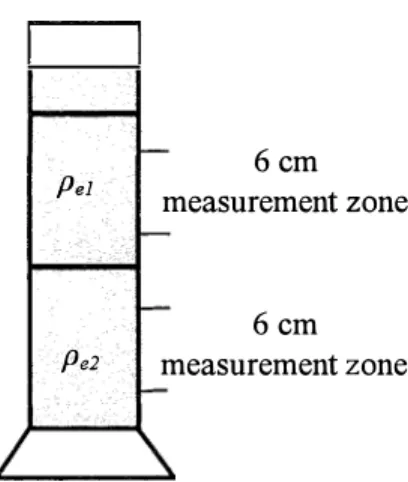
Pe1 Pe2 6cm measurement zone 6cm measurement zone
Fig. 3.2. Schematic diagram of the experimental system for measuring body density of the kelp grouper and tiger grouper larvae. The 1 L measuring cylinder has 40 cm height and 6.5 cm diameter respectively. The height of 6 cm measurement zone was made in each water sample of and times taken by larvae to pass through these zones were recorded.
Larval body density was measured according to Sakamoto et al (2005). A two-layered water column was prepared in a 1 L graduated measuring cylinder by using two seawater samples having different densities. High-density water (pe2) was prepared by mixing 50%
seawater and 50% freshwater and low-density water (pe1) was prepared by mixing 25% seawater
and 75% freshwater. The water temperature and salinity of both samples (pe1, Pe2) were
measured by methods described in 3.2.2. Meanwhile, water viscosity (1J1, 1Jz) was calculated
based on these data by using the methods of Fofonff and Millard (1983) and Miyake and Koizumi (1948).
Ihe preparation oft、刃0-1ayered water colulrm is deschbed as f0110W (Fig.3.2). Firstly,
50o mL of Mgh・density water u)'2) was poured gently into the cylinder. A丘er訊lard, a t1血1
Customized styrene foam board was gently inserted and le丘 aoated on the water sudace ofthe
high-density water u)e2). subsequently,50o mL of low・density water (9el) was poured gently
Over the Mgh-density water u)'2) 1ayer to prevent sudden intermption at the boundary be加eenthe two layers. As water levelincreased, styrene foam board was seen gradua11y aoated
Upwards a11d a clear pycnocline waS 丘)rmed between the two layers in the 工入『ater colulml
C血gF11iF山:ハタ類五Piπephe1那SP.仔魚の生残率改善
LaNae were mildly a11esthetized a11d tra11Sfened as silnilarly descnbed in 323. AttMS
time,1aNae sa11k sponta11eously to the bottom a11d graduaⅡy atta血ed terlmnal velocity wlthin ls
The time taken for both groupers to si11k (WI, W2) t11rough 6 Cm measurement zone in each p'1and p'2 Were recorded (Fig.3.2). Therefore,1arval density is obtained using the f0110W血g
equatlon3.2.8 Statistic Analysis
Statistical analysis was performed using spsS 15.O S0丘Ware (spss hlcorporation, CMcago,1L,
USA) a11d a si即lificance level ofl)<0.05 Was applied. one・way・ANOVA was performed to
Compare laNalsinking velocity a11d body density. when a signi丘Cant difference was found, a
Post hoc test using Tukey'S HSD was pedonned to ascerta血 a11y signiaca11t di任erences
betweentreatmentmeansP/=赳2刃2'2"-W1匁1ι4
W1 η1- W2 ηユ
3.3 Results
3.3.11'aNal Distribution
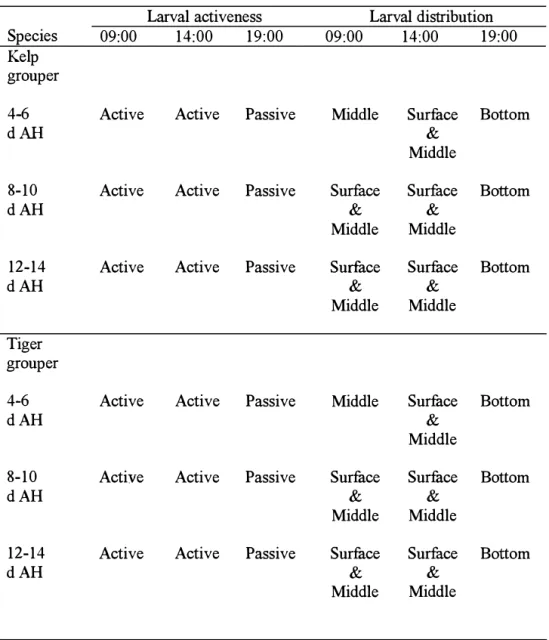
Similar laNal activeness a11d distribution were observed in both groupers (Table 3'D. From 4 to
6 d A11, both laNae were actively swam atthe middle colunm ofthe readng water at 09:oo a11d
in both surface a11d middle colU如Is of the rea血g tank at 14:oo h. At 19:oo h, both laNaePassively swam a11d touched on 壮le ta11k bottom. From 8 t0 12 d AH, both larvae actively swam
at both sudace 釦d middle colU如Is ofthe readng tank at 09:oo h and 14:oo h. Approach血g to
Table 3.1. Larval activeness and distribution of the kelp grouper and tiger grouper at 09:00, 14:00 and 19:00 from 4 to 12 days after hatching (d AH).
Larval activeness Species 09:00 Kelp grouper 4-6 Active dAH 8-10 Active dAH 12-14 Active dAH Tiger grouper 4-6 Active dAH 8-10 Active dAH 12-14 Active dAH
3.3.2 Larval Sinking Velocity a. The kelp grouper
14:00 19:00 Active Passive Active Passive Active Passive Active Passive Active Passive Active Passive Larval distribution 09:00 14:00 19:00
Middle Surface Bottom
&
Middle
Surface Surface Bottom
&
&
Middle Middle
Surface Surface Bottom
&
&
Middle Middle
Middle Surface Bottom &
Middle
Surface Surface Bottom
&
&Middle Middle
Surface Surface Bottom
&
&
Middle Middle
The larval Ji'iwas found gradually increased with their growth from 4 to 12 d AH (Fig. 3.3). The larval Vi was 0.08±0.05 cm s-1 at 4 d AH (mean 2.94±0.05 mm TL), followed by slightly
increasing to 0.09±0.02 cm s-1 at 6 d AH (mean 3 .17±0.06 mm TL) and 8 d AH (mean
C血gF11iFui:ハタ類ΞP加ephe1加 SP.仔魚の生残率改善
Iawa1 酪丘om 4 t0 8 d AI(、 A remarkable increase (,<0.05) m laNal plwas obseNed 飢 10 d
AH, as larvae rapi由y sank 飢 0,19士0.12 Cm s"(mean 3'81士0.15 r血 TL). At 12 d Afl,1awa1 牙
increased to 026士0.24 Cm s、1 (mean 428士0.16 tmn TL) but the di任erence waS 血Significa11t
(四>0.05) as compared wi壮lt110se at 6 and lo d A11, owing to large vadation foU11d at 12 d Afl
6.0 5.0 4.0 T0仇IL肌gth 一戸Smki11gvelocity 3.0 2.0 1.0 0.0 ND 1 0 ND a
Fig.3.3. L町al S血Mng velociw (cm s、、 atld tota11ength (n血) of the
kelp grouper 丑'om o t0 12 days a丑er hatC11itlg (d AID at 11ighttime
S血king velociぢ, values with di任erent superscdpts are signi負Cantly
di任erent(アく 0.05) 2 aC 8 6 4 Daysa丘erhatcMng (d AID 0.6 bC
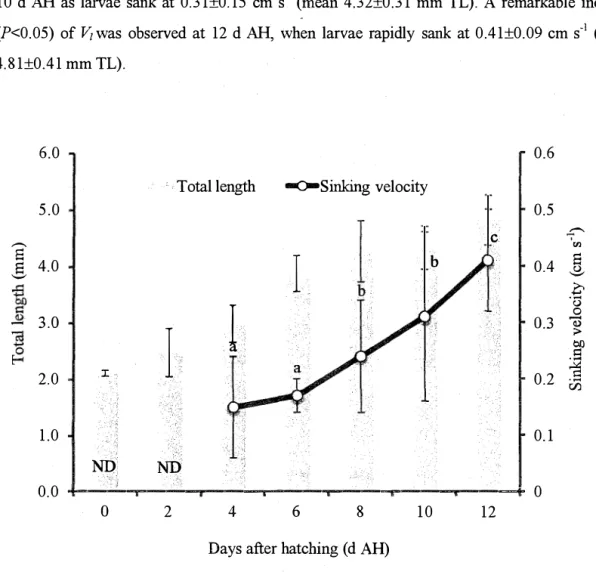
b. The tiger grouper
Like the kelp grouper,1aNal yiof壮le tiger grouper had graduaⅡy increased W辻h their growth
丘om 4 t0 12 d AH (Fig.3.4). LaNa1 乃 Was o.15士0.09 Cm s、'at 4 d AH (mean 298士0.05 mm
TL)釦d slightly 血Creased to o.17士0.03 Cm s、1at 6 d AH (mean 3.87士0.17 如n TL) but Mthout
Significant di任erence (円>0,05). At 8 d AH,1arva1 1'1had increased significa11tly (1)<0.05) to
024士0.10 cm s'1(mean 426士024 rr11n TL) compared to larva1 ンiin previous days. However,
IaNa1 11at 8 d AH remained no signi6.ca11t difference (P>0.05) compared to those observed at
a 05 C 04 0.3 0.2 10 0.1 12 0 (一,のΞごゐで0一り>如三着一め (ΞΞ)占如忌一為ぢ一
10 d AH as larvae sank at 0.31±0.15 cm s-1 (mean 4.32±0.31 mm TL). A remarkable increase
(P<0.05) of Vjwas observed at 12 d AH, when larvae rapidly sank at 0.41±0.09 cm s-1 (mean 4.81±0.41 mm TL). 6.0 Total length 5.0
s
§ 4.0� 3.0
2.0 II
I
1.0ND
ND
llllll()laSink:ing velocity bI
C 0.6 0.5 - t/l 0.4§
c
·130 0.3 0 ;:.. � � 0.2 uS 0.1 0.0 ----.--- 0 0 2 4 6 8 10 12Days after hatching ( d AH)
Fig. 3.4. Larval sinking velocity (cm s-1) and total length (mm) of the tiger grouper from O to 12 days after hatching (d AH) at nighttime. Sinking velocity values with different superscripts are significantly different (P < 0.05).
c. Comparison on larval sinking velocity between the kelp grouper and tiger grouper The larval Vi of both the kelp grouper and tiger grouper were found to be similar increasing from 4 to 12 d AH. Although the average larval Vi of the tiger grouper was approximately 2 times higher than the kelp grouper throughout the experimental period, significant differences between the larvae were detected (P>0.05) at 6 and 8 d AH (Fig. 3.5 upper). The dissimilarity of larval sinking velocity between the kelp grouper and tiger grouper was found greatly associated with larval size (Fig. 3.5 below). From 4 to 12 d AH, larval TL of the tiger grouper (2.98±0.05, 3.87±0.17, 4.26±0.24, 4.32±0.31 and 4.81±0.41 mm) was remained significantly
C血gF山F山:ハタ類ΞP加ephe1加SP.仔魚の生残率改善
h喰her (四く0.05) compared to those obser"ed in the kelp grouper (2.94土0.05,3.17士0.06, 3.45士0.B,3.81士0.15 and 4.28士0.161r11n) except on 4 釦d lo d AH 0.6 0.5 0.4 0.3 'C"'Tigergrouper 0.2 a 0.1 a 0 a 'ぐー"Kelp grouper 5.0 b a 4.5 4.0 a b 3,5 a 3.0 a a 2.5 a a a 4 6 8 10 12
Days a丑er hatC11ing (d AID
Fig.3.5. compadson on lawalS血king velocity (upper graph) a11d total Iength (below graph) between the kelp grouper andtigergrouper 丘om 4 t0 12 days a丘er hatC11ing (d AH). Larval S血king velocity a11d total Iength valueS 血 each ve此ical colU如I with di丘'erent superscdptS 釘e Signi丘Cantly different(,< 0.05) b a b a a a b (一,のE口)ゐ一口0一豊如三着一如 (ΞΞ)占如忘一尋0↑
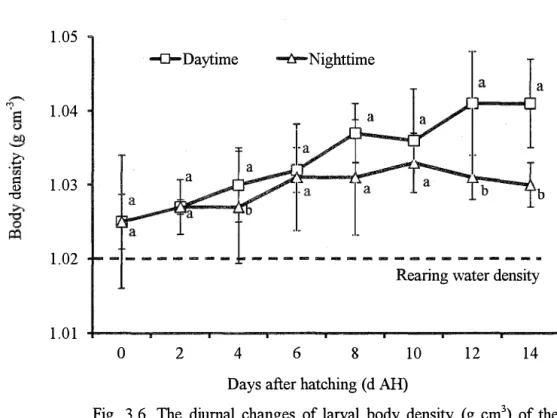
3.3.3 Larval Body Density a. The kelp grouper
The rlinrn::il ch::ingP.S nfhrv::il hnrly rlen�ity mere nh�Pr<rPrl in the lt-elp gmnper (Pig. '.l_h). L<>nr,:,J density at O d AH remained no significant difference (P>0.05) between daytime (1.025±0.004 g cm-3
) and nighttime (1.025±0.002 g cm-3). At 2 d AH, larval body density was gradually
increased but was insignificant (P>0.05) between daytime (1.027±0.003 g cm-3
) and nighttime
(1.027±0.002 g cm-3). However, at 4 d AH, larvae attained significantly denser body (P<0.05) at daytime (1.030±0.005 g cm-3
) compared to nighttime (1.027±0.009 g cm-3). From 6 to 10 d AH,
larval body density increased both at daytime (1.032±0.004, 1.037±0.003 and 1.036±0.007 g cm-3
) and nighttime (1.031±0.007, 1.031±0.003 and 1.033±0.004 cm-3) respectively but no significant different was detected (P>0.05).
1.05 1.04
.£
::: 1.03 <l) "t:I 1.02 1.01 -0-Daytime -i::f-Nighttime a a bRearing water density
0 2 4 6 8 10 12 14
Days after hatching ( d AH)
Fig. 3.6. The diurnal changes of larval body density (g cm3
) of the
kelp grouper from Oto 14 days after hatching (d AH). Open square and open trigona markers represent larval body density at daytime and nighttime respectively. Straight line represents average rearing water density. The larval body density values in each vertical column with different superscripts are significantly different (P < 0.05).
A remarkable increased of larval body density was observed at 12 d AH, as larvae attained significantly denser body (P<0.05) (1.041±0.007 cm-3
1.041±0.006 cm-3at daytime but continued to decline significantly (P<0.05) at nighttime to 1.030±0.008 cm-3
. The average density ofrearing water throughout the experimental period was
1.020±0.004 cm-3 •
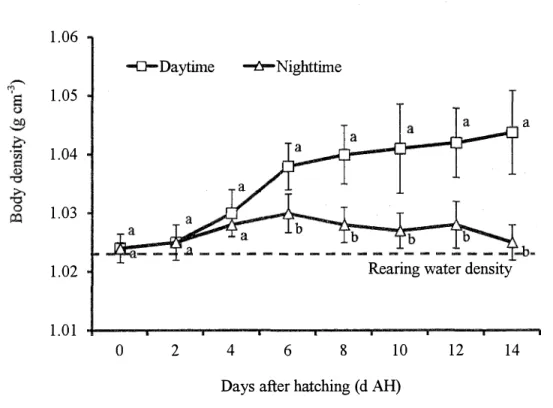
b. The tiger grouper
The diurnal changes oflarval body density were also observed in the tiger grouper (Fig. 3.7). Larval body density at O d AH remained no significant different (.P>0.05) at daytime (1.024±0.002 cm-3
) and nighttime (1.024±0.001 cm-3). At 2 d AH, larval body density was
gradually increased, but remained no significant different (.P>0.05) between daytime (1.025±0.004 cm-3 ) and nighttime (1.025±0.003 cm-3). 1.06 1.05 1.04 1.03 1.02 1.01
-a-Daytime ----{pa Nighttime
a
Rearing water density
0 2 4 6 8 10 12 14
Days after hatching ( d AH)
Fig. 3.7. The diurnal changes of larval body density (g cm3
) of the
tiger grouper from Oto 14 days after hatching (d AH). Open square and open trigona markers represent larval body density at daytime and nighttime respectively. Straight line represents average rearing water density. The larval body density values in each vertical column with different superscripts are significantly different (P < 0.05).
At 4 d AH, larval body density continued to increase both at daytime (1.030±0.004 cm-3) and nighttime (1.028±0.002 cm-cm-3) yet no significant different (.P>0.05) was detected. From 6 to 14 d AH, larval body density was significantly higher (P<0.05) (1.038±0.004, 1.040±0.005,
1.041±0.008, 1.042±0.006 and 1.044±0.007 cm-3) compared at nighttime (1.030±0.003, 1.028±0.003, 1.027±0.003, 1.028±0.004 and 1.025±0.003 cm-3
) respectively. The average
density of rearing water throughout the experimental period was 1. 020±0. 006 cm-3 •
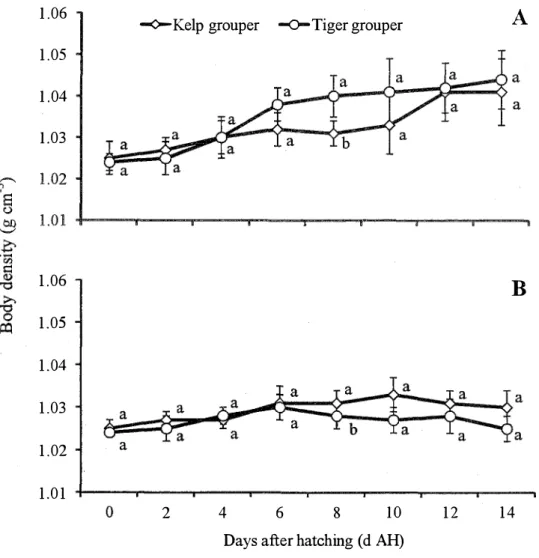
c. Comparison on larval body density between the kelp grouper and tiger grouper
The diurnal change of body density between the tiger grouper and kelp grouper during daytime (Fig. 3.8A) and nighttime (Fig. 3.8B) was insignificant from O to 12 d AH except those observed at 8 d AH. However, larval body density during daytime was remained higher in the tiger grouper compared to the kelp grouper, and remained vice versa during nighttime.
1.06 1.05 1.04 1.03 1.06 1.05 1.04 1.03 1.02 1.01
....,O.-Kelp grouper -0-Tiger grouper
A
B
a
2 4 6 8 10 12 14
Days after hatching ( d AH)
Fig. 3.8. Comparison on larval diurnal change of body density (g cm3
) between the tiger grouper and kelp grouper from O to 14 days after hatching (d AH) during daytime (A) and nighttime (B). Open square and open trigona markers represent larval body density at daytime and nighttime respectively. The larval body density values in each vertical column with diff�ent superscripts are significantly different (P < 0.05).