Title
Spatial genetic structuring and demographic history of the little
spinefoot Siganus spinus in the Western Pacific
Author(s)
Iwamoto, Kensuke; Chang, Chin-Wei; Imai, Hideyuki
Citation
Biogeography : international journal of biogeography,
phylogeny, taxonomy, ecology, biodiversity, evolution, and
conservation biology, 22: 26-34
Issue Date
2020-09-20
URL
http://hdl.handle.net/20.500.12000/46909
Spatial genetic structuring and demographic history of the little spinefoot
Siganus spinus in the Western Pacific
Kensuke Iwamoto1, *, Chih-Wei Chang 2 and Hideyuki Imai 3, †1 Graduate School of Engineering and Science, University of the Ryukyus, Nishihara, Okinawa 903-0213, Japan 2 Marine Ecology and Conservation Research Centre, National Academy of Marine Research, Kaohsiung 80661,
Taiwan, ROC, Department of Oceanography, National Sun Yat-sen University, Kaohsiung 80424, Taiwan, ROC and National Museum of Marine Biology and Aquarium, Pingtung 94450, Taiwan, ROC
3 Faculty of Science, University of the Ryukyus, Nishihara, Okinawa 903-0213, Japan
* Present address: Re:Blue Inc., Shishikuiura, Kaiyo-cho, Tokushima 775-0512, Japan
Abstract: Studies have suggested that fishes with broad distribution ranges, long pelagic duration, and great mobility in
their early life histories may have an advantage in their ability to return to their natal reef habitats. Siganus spinus is a siganid fish with a broad dispersal strategy, which may also exploit its great mobility to enhance self-recruitment. Variations in mitochondrial DNA sequences were analysed to estimate the genetic structure and demographic history of Siganus spinus in the West Pacific. In total, 446 nucleotide sequences, including the tRNAThr gene, the tRNAPro gene, and the first half of the control region, were analysed from 240 individuals sampled at five sites spanning the West Pacific Ocean; 37 haplotypes were identified. Our results showed significant geographic genetic structure as well as isolation by distance. Both neutrality tests and mismatch distribution indicated that the population expansion of S. spinus through the study area may have occurred in the late Quaternary. A dispersal strategy characterised by large juveniles and open-sea distribution may have contributed to a sudden population expansion after the last glacial period, along with an expansion of distribution.
Key words: demographic history, genetic structure, mitochondrial DNA, nucleotide sequence, Siganus spinus, Suku
INTRODUCTION
Pelagic larval duration (PLD) is the primary driver of dis-persal among distant patches of habitat for many species of marine fish. The dispersal of individuals among populations is of great importance for population dynamics, population persistence, and species expansion (Treml et al. 2008). For effective management and conservation of marine resources, it is necessary to identify and quantify population structures and patterns of connectivity. Population genetics (i.e., the molecular approach) is the most powerful tool for estimating connectivity and population structure (Jones et al. 2009), as it is impossible to directly observe dispersal.
The little spinefoot, Siganus spinus, is commonly found on coral reef flats throughout the Indo-Pacific region. It has the second broadest geographic distribution among siganids, after the forktail rabbitfish Siganus argenteus (Woodland 1990). Juveniles of several siganid species settle in shallow coast-al waters during certain times of the year (Tsuda and Bryan 1973; Popper and Gundermann 1976; Kami and Ikehara 1979; Kanashiro et al. 1999). In the Okinawa Islands region, large numbers of S. spinus and S. argenteus juveniles, collectively
called “Suku”, recruit to a back-reef moat during a specific lunar phase in early summer. Large schools are caught at this time via purse seining. Most “Suku” are S. spinus, which demonstrates a strict seasonal and lunar-synchronised pattern of spawning behaviour (Tawada, 1988). Although the yield of “Suku” varies greatly among years and locations, a large harvest may be valued at 10 million Japanese yen (approx. US$100,000; Tawada 1988). A typical commercial “Suku” fishery can round up a school of juveniles by purse seining, catching hundreds of thousands of individuals in a single haul. These fisheries may be causing the population declines responsible for reduced yields in recent years. A decrease in spawner biomass due to overharvesting may have consid-erable effects on subsequent recruitment and the long-term sustainability of the fishery (Man et al. 1995). Iwamoto et al. (2009) showed no gene flow and not differentiation between Okinawa-jima and Ishigaki-jima localities by mitochondrial DNA control region sequence analysis. Priest et al. (2012) reported the Southern Mariana Islands population had self-re-cruitment. However, few studies have investigated the genetic structure of coastal fishes throughout the West Pacific region. To elucidate the genetic variability, population structure, and gene flow of wild siganid populations for the development of effective resource management measures. This study
investi-26–34. Sep. 20, 2020
−−−−−−−−−−−−−−−−−−−−−−−−−−−−−−−−−−−−−−−−−−−−−−−−−−−−−−−−
Kensuke Iwamoto, Chih-Wei Chang and Hideyuki Imai
gated the genetic variability, population structure, and recent evolutionary history of S. spinus in the West Pacific using mi-tochondrial DNA (mtDNA) control region sequence analysis. In this study, we discuss the influence of oceanic currents and PLD to population structure.
MATERIALS AND METHODS
Samples collection and DNA extraction
In total, 240 Siganus spinus individuals were collected between 2006 and 2010 at five sites spanning from the South Pacific to the Northwest Pacific, mainly along the Kuroshio Current and the North Equatorial Current (NEC) (Table 1; Fig. 1). Fish samples were chilled on ice, frozen, or preserved in 70–99% ethanol, and subsamples of approximately 50 mg minced muscle or fin were placed into individual 1.5 mL plas-tic test tubes containing 0.5 mL TNES-8M urea buffer (Asahida et al. 1996). Genomic DNA was extracted from the tissues using proteinase K digestion with phenol–chloroform and di-ethyl ether extraction (Imai et al. 2004).
Amplification and sequencing
The mtDNA control region was amplified via Polymerase Chain Reaction (PCR) using the primers L15926 (Kocher et al. 1989), L15923 (Shields and Kocher 1991), or
L-Si-ganus-Thr (Iwamoto et al. 2015) and H16498 (Meyer et al. 1990) with BIOTAQ™ DNA Polymerase (Bioline Ltd.), Ex Taq™ DNA polymerase (TaKaRa Bio Inc.) or KAPATaq™ EXtra DNA Polymerase (Kapa Biosystems). The following reagents were added to each PCR microtube: for BIOTAQTM, 1 µL template DNA, 12.5 pmol of each primer, 5 µL 10× NH4 reaction buffer, 5 µL 10 mM deoxyribonucleotide triphosphate (dNTP) mixture, 4 µL 50 mM MgCl2 solution, and 2.5 units of Taq polymerase; for Ex Taq™, 1 µL template DNA, 12.5 pmol of each primer, 5 µL 10× Ex Taq™ buffer, 5 µL 2.5 mM dNTP mixture, and 2.5 units of Taq polymerase; for KAPA-TaqTM, 1 µL template DNA, 12.5 pmol of each primer, 10 µL 5× KAPATaq EXtra buffer, 1.5 µL 10 mM dNTP mixture, 3.5 µL 25 mM MgCl2 solution, and 2.5 units of Taq polymerase. Each sample was brought to 50 µL with sterile distilled H2O. PCR conditions consisted of initial plate heating (94°C, 2 min) followed by 30 cycles of denaturation (94°C, 30 s), annealing (48–56°C, 30 s), and extension (72°C, 1 min), then a final extension step (72°C, 7 min) in a thermal cycler (GeneAmp 9700; Applied Biosystems). PCR products were purified using ExoSAP-IT (USB Co.) or a PCR Product Pre-Sequencing Kit (USB Co.). Amplified DNA was sequenced on an ABI 3700 genetic analyser (Applied Biosystems) using BigDye Termi-nator Cycle Sequencing Kit ver. 3.1 (Applied Biosystems). All haplotype sequences were deposited in the DNA Data Bank of Japan (DDBJ).
Data analysis
Sequence data were aligned using ClustalW (Thompson et al. 1997) with the default parameters, and alignments were optimised manually. All types of substitutions were weighted equally in analyses. Population statistics were estimated us-ing the program ARLEQUIN ver. 3.5 (Excoffier and Lischer 2010). The level of polymorphism for each population was estimated based on the number of substitutions, h (Nei 1987), π (Tajima 1983), and the mean number of nucleotide pair-wise differences (k; Tajima 1983). To assess the relationship between haplotype and number of individuals, a network tree was created using Popart (Leigh et al. 2015) and drawn by hand.
Fig. 1. Sampling sites, major haplotype frequencies (Ss1, 2, 3, 5, 22, 35 and 45) of represented pie-graph for Siganus spinus and sea currents. Numerals of two different circles were number of individuals.
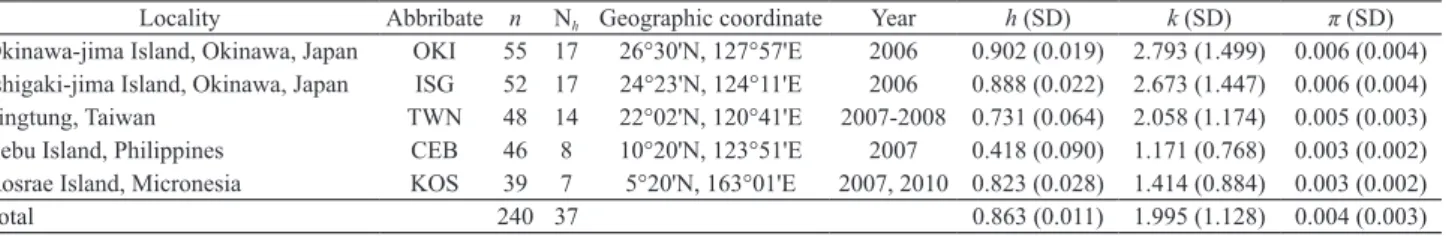
Locality Abbribate n Nh Geographic coordinate Year h (SD) k (SD) π (SD) Okinawa-jima Island, Okinawa, Japan OKI 55 17 26°30'N, 127°57'E 2006 0.902 (0.019) 2.793 (1.499) 0.006 (0.004) Ishigaki-jima Island, Okinawa, Japan ISG 52 17 24°23'N, 124°11'E 2006 0.888 (0.022) 2.673 (1.447) 0.006 (0.004) Pingtung, Taiwan TWN 48 14 22°02'N, 120°41'E 2007-2008 0.731 (0.064) 2.058 (1.174) 0.005 (0.003) Cebu Island, Philippines CEB 46 8 10°20'N, 123°51'E 2007 0.418 (0.090) 1.171 (0.768) 0.003 (0.002) Kosrae Island, Micronesia KOS 39 7 5°20'N, 163°01'E 2007, 2010 0.823 (0.028) 1.414 (0.884) 0.003 (0.002)
Total 240 37 0.863 (0.011) 1.995 (1.128) 0.004 (0.003)
Table 1. Summary of sampling localities, sample size (n), collection year and genetic diversity in five localities of Siganus spinus.
n, sample size; Nh, number of haplotypes; h, haplotype diversity; k, mean pairwise; SD, Standard deviation are in parentheses differences; π,
Two approaches were used to infer demographic history. First, the null hypothesis of neutrality may be rejected when a population has experienced population expansion (Tajima 1989). Thus, two neutrality tests were applied to the mtDNA control region sequence data, Tajima’s D test (Tajima 1989) and Fu’s Fs test (Fu 1997). These tests and their significance levels were estimated using ARLEQUIN, based on 10,000 simulated resampling replicates. Alternatively, a population that has experienced a rapid expansion in the recent past exhibits a smooth, wavelike mismatch distribution with a star-like phylogeny (Slatkin and Hudson 1991; Rogers and Harpending 1992). We also used mismatch distribution anal-yses under the assumption of selective neutrality to evaluate possible growth and decline events in the historical population (Rogers and Harpending 1992; Rogers 1995). Past demo-graphic parameters, including τ (time since expansion) and θ0 and θ1 (population size before and after expansion, respec-tively) (Rogers and Harpending 1992; Rogers 1995), were calculated using ARLEQUIN. In addition, Harpending’s (1994) raggedness index was computed for each distribution, and its significance was tested using a parametric bootstrap approach with 10,000 replicates.
For distributions that did not differ significantly (P > 0.05) from the sudden expansion model, the demographic expansion parameter τ was a transformed estimate of actual time since population expansion, calculated using two formulae, T = τ/2u
and u = 2µk, where µ is the mutation rate for the entire DNA region of interest, k is the length of the sequence (Rogers and Harpending 1992; Harpending 1994), and T is the time meas-ured in years since expansion (Gaggiotti and Excoffier 2000). In the present study, mutation rates of 4–10% MY–1, known as the molecular clock, were employed for the mtDNA control region of S. spinus (Iwamoto et al. 2012).
The population structure was examined by analysis of mo-lecular variance (AMOVA; Excoffier et al. 1992) using AR-LEQUIN with a model of a single population group. Iwamoto et al. (2009) reported that high gene flow (pairwise FST 0.0036) detected between Okinawa-jima and Ishigakijima Islands (= southern Ryukyu). AMOVA and pairwise FST calculations combined these two localities in this study. AMOVA was also used to partition genetic variance within and between groups of samples. We estimated the proportions of variation among groups (FCT), among populations within groups (FSC), and within populations (FST). This hierarchical test can be used to reveal the degree of population subdivision (Schneider et al. 2000). Pairwise FST values based on uncorrected sequence dif-ferences (Wright 1951; Excoffier et al. 1992) were calculated to estimate the genetic divergence between paired populations, and the significance of F statistics for population comparisons was assessed with ARELEQUIN using 10,000 permutations. Significant levels were corrected by Holm method as the Bonferroni correction (Holm 1979). Gene flow among pop-ulations was estimated to be Nm, the number of migrants per
generation between pairs of populations. Nm was calculated
using the formula Nm = (1–FST)/2FST (Hudson et al. 1992). Pairwise values were transformed using Rousset’s genetic distance equation FST/(1–FST) (Rousset 1997) and then plotted against the geographical distance between sampling sites to test isolation by distance (Wright 1943; Slatkin 1993). Under the stepping-stone hypothesis, genetic differentiation can build up between distant populations even while adjacent pop-ulations remain indistinguishable due to high pairwise gene flow. In such cases, a positive relationship may exist between geographic and genetic distance (Palumbi 2003). The slope,
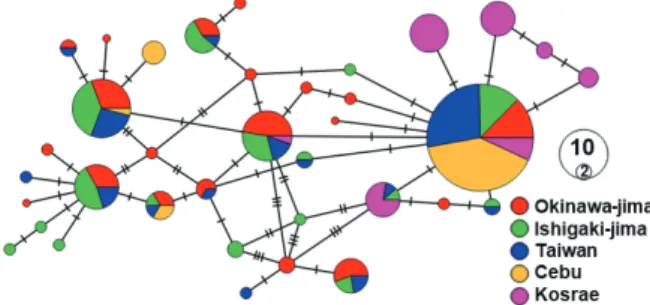
Fig. 2. Haplotype network presenting the median joining network with PopART among 37 haplotypes of Siganus spinus.
Table 2. Haplotype composition of five localities of Siganus spinus.
Haplotype Locality Ss1 Ss2 Ss3 Ss4 Ss5 Ss6 Ss7 Ss8 Ss9 Ss10 Ss11 Ss12 Ss13 Ss14 Ss15 Ss16 Ss17 Ss18 Ss19 Okinawa-jima 11 9 8 5 5 3 2 2 2 1 1 1 1 1 1 1 1 Ishigaki-jima 10 6 10 2 7 5 1 2 1 Taiwan 24 3 7 2 3 1 1 1 1 1 Cebu 35 1 2 Kosrae 6 1 Haplotype Locality Ss20 Ss21 Ss22 Ss23 Ss24 Ss25 Ss26 Ss27 Ss28 Ss29 Ss30 Ss31 Ss32 Ss33 Ss34 Ss35 Ss45 Ss48 Total Okinawa-jima 55 Ishigaki-jima 1 1 1 1 1 1 1 1 52 Taiwan 1 1 1 1 48 Cebu 4 1 1 1 1 46 Kosrae 7 11 9 3 2 39
Kensuke Iwamoto, Chih-Wei Chang and Hideyuki Imai
intercept, and significance of this isolation relationship were assessed via reduced major axis regression and the Mantel test (10,000 permutations) using Isolation by Distance Web Service version 3.21 (www.bio.sdsu.edu/pub/andy/IBD.html; Jensen et al. 2005). Geographic distances were estimated to be the shortest distance in kilometres between the midpoints of two sampling sites using the path tool in Google Earth 5.2 (available at http://earth.google.com).
RESULTS
DNA variation and genetic variability
In total, 445–446 bp were sequenced from each of 240 Si-ganus spinus specimens collected at five sites. The obtained sequences included the tRNAThr gene (44 bp), the entire tR-NAPro gene (69 bp), and the first half of the control region (332–333 bp). A consensus length of 446 bp was determined based on deletion. In total, 37 haplotypes were identified (DDBJ Accession Numbers AB713440 to AB713495). One
haplotype (Ss1) was common to 86 individuals (35.83%) (Ta-ble 2; Fig. 1). The value of h ranged from 0.418 in the Cebu to 0.902 in the Okinawa-jima population. The level of π ranged from 0.002 in Cebu and Kosrae to 0.006 in the Okinawa-jima and Ishigaki-jima locations. Overall, the mean h and π among 240 individuals were estimated to be 0.863 and 0.004, respec-tively (Table 1). A haplotype network was constructed with the median joining network method, which indicated that these localities not fell in to the category of evolutionally significant unit (ESU) (Fig. 2).
Historical demography
Tajima’s D and Fu’s Fs were determined. Neutrality indi-ces calculated for each location and all samples are shown in Table 3. Significant negative values were observed in Okina-wa-jima (Fs = –6.267, P = 0.010), Ishigaki-jima (Fs = –5.782, P = 0.011) and Taiwan (Fs = –5.828, P = 0.009), as well as in the pooled sample (D = –1.622, P = 0.010 and Fs = –2.671, P = 0.000).
Table 3. Results of the mismatch analysis and neutrality tests for Siganus spinus localities.
τ, expansion parameter; obs. mean, mismatch observed mean; θ0, θ1, mutaion parameter before (θ0) and after (θ1) expansion; Ragged, raggedness index of Harpending (1994); Significant values (P < 0.05) are shown in bold. Corresponding P-values for each parameter are in parentheses
Locality Demographic parameters Test of goodness of fit Neutrality tests
τ obs. θ0 θ1 Ragged (P) Tajima's D (P) Fu's Fs (P)
Okinawa-jima 2.428 2.793 0.794 14.512 0.017 (0.780) -0.447 (0.371) -6.267 (0.010) Ishigaki-jima 3.033 2.673 0.004 16.035 0.025 (0.500) -0.413 (0.391) -5.782 (0.011) Taiwan 3.703 2.058 0.005 3.063 0.036 (0.830) -1.063 (0.155) -5.828 (0.009) Cebu 0 1.171 0.325 3414 0.347 (0.860) -1.217 (0.091) -2.501 (0.075) Kosrae 1.75 1.414 0 6864 0.247 (0.000) 0.501 (0.730) -1.151 (0.259) mean 1.844 1.995 0.226 2062.322 0.051 (0.030) -1.622 (0.010) -2.671 (0.000)
Fig. 3. Pairwise mismatch distributions for Siganus spinus. The observed frequencies (bar) and the expected mismatch distributions under a model of sudden expansion (solid line) are
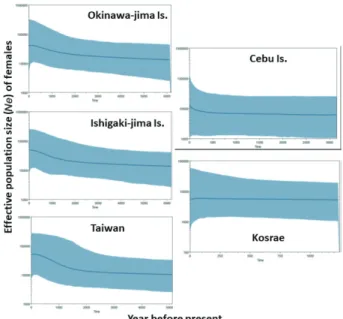
shown. Fig. 4. Bayesian skyline plots analysis with implemented in BEAST on five localities of Siganus spinus based on mitochondrial con-trol region sequences. The thick solid line depicts the median estimate and margins of the shape area represent the highest 95% posterior density intervals.
Mismatch distributions were graphed for the entire sample and for each locality to determine whether the distribution conformed to a model of sudden expansion (Slatkin and Hudson 1991; Rogers and Harpending 1992). The mismatch distributions for most localities were unimodal, except for the Taiwan and Cebu localities, which appeared ragged (Fig. 3). The shape of the distribution suggested that a recent sudden population expansion may have occurred, and the parameters of the mismatch distribution implied all localities, excluding the Kosrae (Table 3). The τ values ranged from 0 to 3.703 (Table 3), signifying a population expansion approximately 7,400–42,500 years ago. The estimated effective female pop-ulation size after expansion (θ1) was markedly higher than be-fore expansion (θ0) for S. spinus, supporting a sudden popula-tion expansion. The Effective populapopula-tion size (Ne) of females were estimated with Bayesian skyline plots program (Fig. 4). Cebu and Kosrae extremely differ Ne process from passed to present.
Population structure
Significant genetic differences among localities were found in all combinations (FST = 0.036 ~ 0.270, P < 0.009) (Table 4). The estimated gene flow (Nm) between the Southern Ryukyu
and Taiwan (Nm = 13.388) was higher than that among the all
populations (Nm = 1.353-11.695) (Table 4). The results of
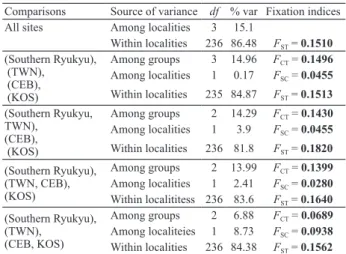
AM-OVA statistically supported this proposed locality grouping the Southern Ryukyu, Taiwan, Cebu and Kosrae (FCT = 0.1496) (Table 5). Pairwise geographic distances plotted against the corresponding genetic distances among the five localities ex-hibited a positive correlation, suggesting isolation by distance
(r = 0.622) (Fig. 5). The Mantel test confirmed the existence of a significant relationship between genetic distance FST/(1– FST) and geographic distance among these populations (P < 0.0001).
DISCUSSION
Our analyses of Siganus spinus populations showed that the overall h values ranged from 0.731 to 0.902, excluding samples from the Cebu population. The Cebu population was an outlier, with a value of 0.418, comparable to reef and amphidromous fishes, e.g., the goldlined spinefoot Siganus guttatus (h = 0.955; Iwamoto et al. 2012), the mottled spine-foot S. fuscescens (h = 0.864; Iwamoto et al. 2015), the neon damselfish Pomacentrus coelestis (h = 0.956; Liu et al. 2008), grey demoiselle Chrysiptera glauca (h = 0.7540; Fauvelot et al. 2003), speckled butterflyfish Chaetodon citrinellus (h = 0.949; Fauvelot et al. 2003), and Hypseleotris cyprinoides (h = 0.993; Tomita et al. 2016). The π value (0.004) was similar to C. glauca (π = 0.0039; Fauvelot et al. 2003) but was an or-der of magnitude lower than S. guttatus (π = 0.020; Iwamoto et al. 2012), S. fuscescens (π = 0.013; Iwamoto et al. 2015), P. coelestis (π = 0.010; Liu et al. 2008), C. citrinellus (π = 0.0139; Fauvelot et al. 2003), and H. cyprinoides (π = 0.0136; Tomita et al. 2016). Imai and Numachi (2002) suggested h and π values as the genetic variability are related to population size. Grant and Bowen (1998) suggested population history scenarios based on h and π values. The high h and low π that characterise S. spinus attributed to recent population expan-sion after a period of low effective population size. Fauvelot
Fig. 5. Relationship between Rousset’s genetic distance and geographic distances for the five localities.
Table 4. Pairwise FST values (below the diagonal) and Nm values (above the diagonal) among four locations of Siganus spinus. Negative FST values were set to zero with Holm correction. Corresponding P-values for pairwise FST are in parentheses. Significance thresholds: *P < 0.05
Locality Southern Ryukyu Taiwan Cebu Kosrae
Southern Ryukyu 13.388 2.811 1.352
Taiwan 0.036 (0.000) 11.695 2.203
Cebu 0.151 (0.000) 0.041 (0.009) 2.739
Kosrae 0.270 (0.000) 0.185 (0.000) 0.155 (0.000)
Table 5. Summary of analysis of molecular variance (AMOVA) for mitochondrial DNA control region sequence of Siganus spinus. Abbreviations of localities are shown in Table 1. Significant values (P < 0.05) are shown in bold. df, dgrese of freedom; % var, percentage of variance. Groups defined according to the pairwise FST (Table 4). Comparisons Source of variance df % var Fixation indices
All sites Among localities 3 15.1
Within localities 236 86.48 FST = 0.1510 (Southern Ryukyu), (TWN), (CEB), (KOS) Among groups 3 14.96 FCT = 0.1496 Among localities 1 0.17 FSC = 0.0455 Within localities 235 84.87 FST = 0.1513 (Southern Ryukyu, TWN), (CEB), (KOS) Among groups 2 14.29 FCT = 0.1430 Among localities 1 3.9 FSC = 0.0455 Within localities 236 81.8 FST = 0.1820 (Southern Ryukyu), (TWN, CEB), (KOS) Among groups 2 13.99 FCT = 0.1399 Among localities 1 2.41 FSC = 0.0280 Within localititess 236 83.6 FST = 0.1640 (Southern Ryukyu), (TWN), (CEB, KOS) Among groups 2 6.88 FCT = 0.0689 Among localiteies 1 8.73 FSC = 0.0938 Within localities 236 84.38 FST = 0.1562
Kensuke Iwamoto, Chih-Wei Chang and Hideyuki Imai
et al. (2003) concluded that C. glauca has recently undergone rapid population growth after a strong bottleneck related to Holocene sea-level regression. The common haplotypes ob-served at most sampling sites suggest that a population bottle-neck occurred, followed by a rapid expansion of populations from a modest number of founders (Avise 2000; Koike 2003). Pairwise sequence differences between S. spinus individuals showed a unimodal distribution with a range of 0–8 nucleo-tides, and the mismatch distribution did not deviate from the population expansion model in most populations. The two neutrality tests conducted on each population and the pooled sample largely yielded negative values, which are often the result of population expansion (Tajima 1989; Fu 1996). The combination of h and π, the star-like MST, and the good fit of the observed mismatch distribution to the sudden expansion model support the neutrality of S. spinus, favouring the demo-graphic hypothesis and suggesting a recent population expan-sion. However, our results are unable to account for the low level of haplotypic diversity observed in the Cebu population (Table 1). This was probably due to a recent reduction in the size of this population (cf. Soliman et al. 2009), differences in demographic history caused by its geographic history, selec-tion pressure among populaselec-tions, or a combinaselec-tion of these factors. Genetic diversity may differ within and among species due to differences in their evolutionary histories (Fauvelot et al. 2003). In addition, although S. spinus may have experi-enced a sudden population expansion in the study area, our re-sults were insufficient to explain the significant deviation from the model of expansion in the Kosrae (Table 3).
A rough estimation indicated that the population experi-enced extensive expansion 7,400–42,500 years before pres-ent. Paleoclimatic variation greatly altered the temperatures and levels of the oceans during the Last Glacial Maximum (LGM). When sea levels fell (120–140 m below the present level; Hewitt 2000; Lambeck et al. 2002), a strong decline in coral reefs inevitably occurred, accompanied by a drastic de-cline in reef fish populations due to the loss of their habitats. Various improvements in environmental conditions, such as the stabilisation of the water temperature, and sea levels, may have occurred after the end of the LGM. Thus, the population expansion of S. spinus could have occurred in the late Qua-ternary (i.e., the past one million years). Similar conclusions have been reported for the spotted sea bass Lateolabrax macu-latus (Liu et al. 2006), neon damselfish P. coelestis (Liu et al. 2008), and Japanese Spanish mackerel Scomberomorus nipho-nius (Shui et al. 2009) in the West Pacific.
Marine organisms have long been thought to have no or low levels of genetic differentiation and structure over large geographic areas due to the PLD and the lack of obvious bar-riers in marine environments (Shaklee 1984; Palumbi 1992,
1994; Riginos and Victor 2001; Planes and Fauvelot 2002). As most adult marine fishes are relatively sedentary, dispersal between spatially fragmented habitats occurs primarily during the larval phase (Leis 1991; Bonhomme and Planes 2000). Si-ganid fishes exhibit low mobility and strict habitat preference (Tawada 1988); thus, dispersal must occur during their early life stages. Siganus spinus has biological traits that favour long-distance dispersal, such as a PLD of approximately one month (Tawada 1988; Soliman et al. 2010), large juveniles (Kanashiro et al. 1999), and an open-sea dispersal strategy (Iwamoto et al. 2009). The dispersal of pelagic larvae over large geographic areas is usually explained as transport via ocean currents and the long PLD (Tomita et al. 2016). Strong ocean currents exist in our study area, namely, the NEC and the Kuroshio. Our results showed a population genetic struc-ture in S. spinus distributed spatially across the West Pacific. The results of hierarchical AMOVA analysis indicated a high proportion of variance (20.61%) and highly significant population structuring. Johannes (1978) reported that most tropical marine fishes exhibit spawning behaviours, times and locations that favour the transport of their pelagic eggs and larvae offshore where predation is reduced, because intense predation puts heavy selective pressure on fishes in shallow coastal habitats. This ecological behaviour may have led to de-velopment of an oceanic dispersal strategy. This strategy, how-ever, requires that the larvae return to shallow coastal waters. Accordingly, spawning is often concentrated at times of the year when prevailing winds or currents are at their weakest, thereby reducing the transport of larvae over long distances (Johannes 1978); i.e., the reproductive strategies of reef fishes depend upon a non-dispersal strategy characterised by self-re-cruitment (Jones et al. 1999). Several previous studies have indicated that reef fishes with high dispersal capacities (e.g., long PLD, large juveniles) exhibit high genetic divergence among populations in the absence of obvious barriers to dis-persal (e.g., Bell et al. 1982; Planes et al. 1994; Shulman and Bermingham 1995; Riginos and Victor 2001; Fauvelot and Planes 2002; Planes and Fauvelot 2002). The biological traits of S. spinus favour long-distance dispersal as well as strong swimming ability to return to the natal reef. This strategy may not hinder larval dispersal even where strong ocean currents exist between spatially fragmented habitats.
The plot of genetic distance and geographic distance be-tween sampling sites indicated isolation by distance. This sug-gested that S. spinus is at genetic equilibrium between disper-sal and genetic drift (Slatkin 1993). Our results suggested that no gene flow among the Southern Ryukyu, Taiwan, Cebu and Kosrae. These observations demonstrated that a barrier exists preventing dispersal between the Southern Ryukyu and Tai-wan. The Kuroshio forms a barrier isolating the islands of the
Ryukyu Archipelago from the main islands of Japan, Taiwan, and the Philippines, as marine organisms have difficulty cross-ing the strong boundary current between these regions (Aoki et al. 2008a; Aoki et al. 2008b; Imai and Aoki, 2012; Iwamo-to et al. 2012, 2015; Imai et al. 2013; Kuriiwa et al. 2014; Tokuyama et al. 2020). This barrier may not prevent dispersal, as a reason for S. spinus juvenile size is bigger than reef fishes and form a school for dispersal phase and recruitment. In con-clusion, our observations suggest that the genetic structure and connectivity of S. spinus populations are influenced by ocean-ographic phenomena as well as PLD and early life history. In addition, the management unit (MU) for resource management and conservation should utilize our results.
ACKNOWLEDGEMENTS
The authors thank Mr. George SL. and staff of Department of Resource and Economic Affairs, Government of Kosrae State, FSM. I have especially greatly benefitted from Mr. Yoshino T (Okinawa Churashima Foundation) and Mr. Apu-rado J L (resident of Cebu Island) coordinated sampling in the Philippines, Mr. Higa T (Nago Fisheries Cooperation Associ-ation) and Kunigami Fisheries Cooperative Association. We express our gratitude to many others for their contributions to this work. This research was partially supported by the Okina-wa Research Core for Highly Innovative Discipline Science (ORCHIDS) program, University of the Ryukyus.
References
Aoki M, Naruse T, Cheng JH, Suzuki Y, Imai H. 2008a. Low genetic variability in an endangered population of fiddler crab Uca arcuata on Okinawajima Island: analysis of mito-chondrial DNA. Fish. Sci., 74: 330-340.
Aoki M, Imai H, Naruse T, Ikeda Y. 2008b. Low genetic diver-sity of oval squid, Sepioteuthis cf. lessoniana (Cephalopoda: Loliginidae), in Japanese Waters inferred from a mitochon-drial DNA non-cording region. Pac. Sci., 62: 403-411. Asahida T, Kobayashi T, Saitoh K, Nakayama T. 1996. Tissue
preservation and total DNA extraction from fish stored at ambient temperature using buffers containing high concen-tration of urea. Fish. Sci., 62: 727–730.
Avise JC. 2000. Phylogeography: The History and Formation of Species. Harvard University Press, Cambridge, MA, USA.
Bell JL, Moyer JT, Numachi K. 1982. Morphological and genetic variation in Japanese populations of anemonefish Amphriprion clarkii. Mar. Biol. 72: 99–108.
Bonhomme F, Planes S. 2000. Some evolutionary arguments about what maintains the pelagic interval in reef fishes.
En-viron. Biol. Fish., 59: 365-383.
Excoffier L, Lischer H. 2010. Arlequin suite ver 3.5: a new series of programs to perform population genetics analyses under Linux and Windows. Mol. Ecol. Resour., 10: 564– 567.
Excoffier L, Smouse PE, Quattro JM. 1992. Analysis of mo-lecular variance inferred from metric distances among DNA haplotypes: application to human mitochondrial DNA re-striction data. Genetics, 131: 479-491.
Fauvelot C, Bernardi G, Planes S. 2003. Reductions in the mitochondrial DNA diversity of coral reef fish provide ev-idence of population bottlenecks resulting from Holocene sea-level change. Evolution, 57: 1571–1583.
Fauvelot C, Planes S. 2002. Understanding origins of pres-ent-day genetic structure in marine fish: biologically or his-torically driven patterns? Mar. Biol., 141: 773–788. Fu YX. 1996. New statistical tests of neutrality for DNA
sam-ples from a population. Genetics, 143: 557-570.
Fu YX. 1997. Statistical tests of neutrality of mutations against population growth, hitchhiking and background selection. Genetics, 147: 915–925.
Gaggiotti OE, Excoffier L. 2000. A simple method of remov-ing the effect of a bottleneck and unequal population sizes on pairwise genetic distances. Proc. R. Soc. B, 267: 81–87. Grant WS, Bowen BW. 1998. Shallow population histories in
deep evolutionary lineages of marine fishes: Insights from sardines and anchovies and lessons for conservation. J. He-redity, 89: 415-426.
Harpending RC. 1994. Signature of ancient population growth in a low-resolution mitochondrial DNA mismatch distribu-tion. Hum. Biol., 66: 591-600.
Hewitt GM. 2000. The genetic legacy of the Quaternary ice ages. Nature 405: 907–913.
Holm S. 1979. A simple sequentially rejective multiple test procedure. Scandinavian J. Statistics, 6: 65-70.
Hudson RR, Slatkin M, Maddison WP. 1992. Estimation of levels of gene flow from DNA sequence data. Genetics,
132: 583–589.
Imai H, Numachi K. 2002. Intra- and interspecific genetic variability and relationships among mud crabs, Scylla spp. (Decapoda: Portunidae), demonstrated by RFLP analysis of mitochondrial DNA. J. Anim. Genet., 29: 3-11.
Imai H, Cheng JH, Hamasaki K, Numachi K. 2004. Identifi-cation of four mud crab species (genus Scylla) using ITS-1 and 16S rDNA markers. Aquat. Living Resour., 17: 31-34. Imai H, Aoki M. 2012. Genetic diversity and genetic
heteroge-neity of bigfin reef squid “Sepioteuthis lessoniana” species complex in northwestern Pacific Ocean. Pages.151-166 in: Caliskan M, ed., Analysis of Genetic Variation in Animals. InTech, Rijeka.
Kensuke Iwamoto, Chih-Wei Chang and Hideyuki Imai
Imai H, Hanamura Y, Cheng JH. 2013. Genetic and morpho-logical differentiation in the Sakura shrimp (Sergia lucens) between Japanese and Taiwanese populations. Contrib. Zool., 82: 123-130.
Iwamoto K, Chang CW, Takemura A, Imai H. 2012. Geneti-cally structured population and demographic history of the goldlined spinefoot Siganus guttatus in the northwestern Pacific. Fish. Sci., 78: 249–257.
Iwamoto K, Abdullah MF, Chang CW, Yoshino T, Imai H. 2015. Genetic isolation of the mottled spinefoot Siganus fuscescens Ryukyu Archipelago population. Biogeography,
17: 61–85.
Iwamoto K, Takemura A, Yoshino T, Imai H. 2009. Molecular ecological study of Siganus spinus and S. guttatus from Okinawan waters based on mitochondrial DNA control re-gion sequences. J. Oceanogr., 65: 103–112.
Jensen JL, Bohonak AJ, Kelley ST. 2005. Isolation by dis-tance, web service. BMC Genet., 6: 13.
Johannes RE. 1978. Reproductive strategies of coastal marine fishes in the tropics. Envir. Biol. Fish., 3: 65–84.
Jones GP, Almany GR, Russ GR, Sale PF, Steneck RS, van Oppen MJH, Willis BL. 2009. Larval retention and connec-tivity among populations of corals and reef fishes: history, advances and challenges. Coral Reefs, 28: 307–325. Jones GP, Milicich MJ, Emslie MJ, Lunow C. 1999.
Self-re-cruitment in a coral reef fish population. Nature, 402: 802– 804.
Kami HT, Ikehara I. I. 1979. Notes on the annual juvenile si-ganid harvest in Guam. Micronesica, 12: 323–325.
Kanashiro K, Motonaga F, Kimura M. 1999. Settlement of white-spotted spinefoot, Siganus canaliculatus (Pisces: Si-ganidae), in the coastal waters off Okinawa Island, Japan. Nippon Suisan Gakkaishi, 65: 19–25 (in Japanese with Eng-lish abstract).
Kocher TD, Thomas WK, Meyer AE, Edwards SV, Paabo S, Villablanca FX, Wilson AC. 1989. Dynamics of mitochon-drial DNA evolution in animals: Amplification and sequenc-ing with conserved primers. Proc. Natl. Acad. Sci. USA, 86: 6196–6200.
Koike H. 2003. Intraspecific genetic polymorphism and con-servation genetics. Pages 40–58 in Koike H, Matsui M, eds. Conservation Genetics. University of Tokyo Press, Tokyo (in Japanese).
Kuriiwa K, Chiba SN, Motomura H, Matsuura K. 2014. Phy-logeography of Blacktip Grouper, Epinephelus fasciatus (Perciformes: Serranidae), and influence of the Kuroshio Current on cryptic lineages and genetic population structure. Ichthyol. Res., 61: 361–374.
Lambeck K, Esat TM, Potter E. K. 2002. Links between cli-mate and sea levels for the past three million years. Nature,
419: 199–206.
Leigh JW, Bryant D. 2015. PopART: Full-feature software for haplotype network construction. Methods Ecol Evol.,
6:1110–1116.
Leis JM. 1991. The pelagic stage of reef fishes: the larval biology of coral reef fishes. Pages 183-230 in Sale PF, eds. The Ecology of Fishes on Coral Reefs. Academic Press, San Diego, California, USA.
Liu JX, Gao TX, Yokogawa K, Zhang YP. 2006. Differential population structuring and demographic history of two closely related fish species, Japanese sea bass (Lateolabrax japonicus) and spotted sea bass (Lateolabrax maculatus) in Northwestern Pacific. Mol. Phylogenet. Evol., 39: 799–811. Liu SYV, Kokita T, Dai CF. 2008. Population genetic structure
of neon damselfish (Pomacentrus coelestis) in the north-western Pacific Ocean. Mar. Biol., 154: 745–753.
Man A, Law R, Polunin NVC. 1995. Role of marine reserves in recruitment to reef fisheries: A metapopulation model. Biol. Conservation, 71: 197–204.
Meyer AE, Kocher TD, Basasibwaki P, Wilson AC. 1990. Monophyletic origin of Lake Victoria cichlid fishes suggest-ed by mitochondrial DNA sequences. Nature, 347: 550–553. Nei M. 1987. Molecular Evolutionary Genetics. Columbia
University Press, New York, USA.
Palumbi S. R. 1992. Marine speciation on a small planet. Trends. Ecol. Evol., 112: 319–326.
Palumbi S. R. 1994. Reproductive isolation, genetic diver-gence, and speciation in the Sea. Ann. Rev. Ecol. Syst., 25: 547–572.
Palumbi S. R. 2003. Population genetics, demographic con-nectivity, and the design of marine reserves. Ecol. Appl., 13: S146–S158.
Planes S, Borsa P, Galzin R, Bonhomme F. 1994. Geographic structure and gene flow in the manini (convict surgeonfish, Acanthurus triostegus) in the South Central Pacific. Pages 113–122 in Beaumont AR, eds. Genetics and evolution of aquatic organisms. Chapman & Hall, London.
Planes S, Fauvelot C. 2002. Isolation by distance and vicari-ance drive genetic structure of a coral reef fish in the Pacific Ocean. Evolution, 56: 378–399.
Popper D, Gundermann N. 1976. A successful spawning and hatching of Siganus vermiculatus under field conditions. Aquaculture, 7: 291–292.
Priest MA, Halford AR, Mcllwain JL. Evidence of stable ge-netic structure across a remote island archipelago through self-recruitment in a widely dispersed coral reef fish. Ecol. Evol., 2: 3195-3213.
Riginos C, Victor BC. 2001. Larval spatial distributions and other early life-history characteristics predict genetic differ-entiation in eastern Pacific blennioid fishes. Proc. R. Soc.
Lond. B. Biol. Sci., 268: 1931–1936.
Rogers AR. 1995. Genetic evidence for a Pleistocene popula-tion explosion. Evolupopula-tion, 49: 608–618.
Rogers AR, Harpending H. 1992. Population growth makes waves in the distribution of pairwise genetic differences. Mol. Biol. Evol., 9: 552-569.
Rousset F. 1997. Genetic differentiation and estimation of gene flow from F-statistics under isolation by distance. Ge-netics, 145: 1219–1228.
Schneider S, Roessli D, Excoffier L. 2000. Arlequin: a soft-ware for population genetics data analysis. User manual ver 2.000. Genetics and Biometry Lab, Dept. of Anthropology, University of Geneva, Geneva.
Shaklee JM. 1984. Genetic variation and population structure in the damselfish, Stegastes fasciolatus, throughout the Ha-waiian Archipelago. Copeia, 1984: 629–640.
Shields GS, Kocher TD. 1991. Phylogenetic relationship of North American ursids based on analysis of mitochondrial DNA. Evolution, 45: 218–221.
Shui BN, Han ZQ, Gao TX, Miao ZQ, Yanagimoto T. 2009. Mitochondrial DNA variation in the East China Sea and Yellow Sea populations of Japanese Spanish mackerel Scomberomorus niphonius. Fish. Sci., 75: 593–600.
Shulman MJ, Bermingham E. 1995. Early life histories, ocean currents, and population genetics of Caribbean reef fishes. Evolution, 49: 897–910.
Slatkin M. 1993. Isolation by distance in equilibrium and nonequilibrium populations. Evolution, 47: 264-279. Slatkin M, Hudson RR. 1991. Pairwise comparisons of
mito-chondrial-DNA sequences in stable and exponentially grow-ing populations. Genetics, 129: 555-562.
Soliman VS, Bobiles RU, Yamaoka K. 2009. Overfishing in three siganid species (Family: Siganidae) in Lagonoy Gulf, Philippines. Kuroshio Sci., 2: 145–150.
Soliman VS, Yamada H, Yamaoka K. 2010. Early life-his-tory of the spiny siganid Siganus spinus (Linnaeus 1758) inferred from otolith microstructure. J. Appl. Ichthyol., 26: 540–545.
Tajima F. 1983. Evolutionary relationship of DNA sequences in finite populations. Genetics, 105: 437–460.
Tajima F. 1989. Statistical method for testing the neutral muta-tion hypothesis by DNA polymorphism. Genetics, 123: 585-595.
Tawada S. 1988. Aigo. Pages 111–124 in Shokita S, eds. Aq-uaculture in tropical areas. Midori Shobo, Tokyo. (in Japa-nese)
Thompson JD, Gibson TJ, Plewniak F, Jeanmougin F, Hig-gins D. G. 1997. The Clustal_X windows interface: flexible strategies for multiple sequence alignment aided by quality analysis tools. Nucleic Acids Res., 25: 4876–4882.
Tokuyama T, Shy JY, Lin HC, Henmi Y, Mather P, Hughes J, Tsuchiya M, Imai H. 2020. Genetic population structure of the fiddler crab Austruca lactea (De Haan, 1835) based on mitochondrial DNA control region sequences. Crustacean Res., 49: 141–153.
Tomita S, Matsuzaki S, Oka S, Toda M, Imai H. 2016. High levels of genetic diversity and gene flow in the endangered goby Hypseleotris cyprinoides on Okinawajima Island, Ishi-gakijima Island and Luzon Island. Japan. J. Ichthyol., 63: 27-32 (in Japanese with English abstract).
Treml EA, Halpin PN, Urban DL, Pratson LF. 2008. Modeling population connectivity by ocean currents, a graph-theoretic approach for marine conservation. Landscape Ecol., 23: 19–36.
Tsuda RT, Bryan PG. 1973. Food preference of juvenile Siganus rostratus and S. spinus in Guam. Copeia, 1973: 604–606.
Woodland DJ. 1990. Revision of the fish family Siganidae with descriptions of two new species and comments on dis-tribution and biology. Indo-Pacific Fishes, 19:11–36. Wright S. 1943. Isolation by distance. Genetics, 28: 114–138. Wright S. 1951. The genetical structure of populations. Ann.
Eugen., 15: 323–354.