INVITED PAPER
Special Section on Electronic DisplaysGenerating Questions for Inquiry-Based Learning of History in Elementary Schools by Using Stereoscopic 3D Images
Takashi SHIBATA†a), Kazunori SATO††,†††,andRyohei IKEJIRI††††,Nonmembers
SUMMARY We conducted experimental classes in an elementary school to examine how the advantages of using stereoscopic 3D images could be applied in education. More specifically, we selected a unit of the Tumulus period in Japan for sixth-graders as the source of our 3D educa- tional materials. This unit represents part of the coursework for the topic of Japanese history. The educational materials used in our study included stereoscopic 3D images for examining the stone chambers andHaniwa (i.e., terracotta clay figures) of the Tumulus period. The results of our experimental class showed that 3D educational materials helped students focus on specific parts in images such as attached objects of theHaniwa and also understand 3D spaces and concavo–convex shapes. The exper- imental class revealed that 3D educational materials also helped students come up with novel questions regarding attached objects of theHaniwa, andHaniwa’s spatial balance and spatial alignment. The results suggest that the educational use of stereoscopic 3D images is worthwhile in that they lead to question and hypothesis generation and an inquiry-based learn- ing approach to history.
key words: stereoscopic images, education, school, 3D display, historical learning
1. Introduction
In recent years, there have been rapid developments in the technology involved in presenting images on displays. Be- sides being incorporated into everyday activities, display technologies promote the use of information and communi- cation technology (ICT) in education. For instance, tablets have become increasingly popular in elementary school classrooms as a means of improving educational quality. In Japan, the Ministry of Education, Culture, Sports, Science and Technology (MEXT) continues to actively promote the use of ICT in education through large-scale projects that in- vestigate the educational effectiveness of tablets and other educational equipment; such projects involve researchers conducting practice classes[1].
In this way, teachers and students in school have started to use new display technologies and related technologies, such as touchscreens and digital pens. Promoting ICT in ed- ucation may allow students to get familiar with digital con-
Manuscript received March 7, 2017.
Manuscript revised June 8, 2017.
†The author is with Tokyo University of Social Welfare, Isesaki-shi, 372–0831 Japan.
††The author is with Tokoha University, Shizuoka-shi, 420–
0911 Japan.
†††The author is with Tohoku University, Sendai-shi, 980–8579 Japan.
††††The author is with The University of Tokyo, Tokyo, 113–0033 Japan.
a) E-mail: [email protected] DOI: 10.1587/transele.E100.C.1012
tents, new displays, and new media such as stereoscopic 3D images, virtual reality (VR), and augmented reality (AR).
In addition to the investigation of the educational effects of ICT, research on the functionality of new image technology is needed in the field of education.
Recent display technologies enable the presentation of stereoscopic 3D images through more diverse media such as televisions, mobile devices, and cinema screens. There are increasing opportunities for people to view stereoscopic 3D content. In addition, there are more opportunities to make stereoscopic 3D content because of the availability of consumer 3D cameras in the market. It is therefore becom- ing increasingly possible to use stereoscopic 3D images in school education. Some school teachers have started using 3D expressions in educational materials through stereo-pair images and anaglyph 3D images. By using recent technolo- gies, the innate utility of 3D expressions can be utilized in school education more effectively.
In school education, the quality of learning is of pri- mary importance. Therefore, there is little use for new tech- nologies unless they promote students’ learning. In other words, it is important to consider how a new technology affects students’ learning in comparison with conventional educational methods and materials.
In this study, we conducted experimental classes at an elementary school and evaluated the educational effects of using stereoscopic 3D images on a 3D television. In par- ticular, we aimed to clarify the differences in the outcomes when using 3D educational content as opposed to using con- ventional 2D content. We also aimed to maximize the ad- vantages of 3D images to improve educational quality and students’ learning.
2. Stereoscopic 3D Images in Education
2.1 Effectiveness of Stereo Viewing in School
There are numerous studies related to the effectiveness of stereoscopic 3D images in mainly scientific visualiza- tion[2],[3]and medical applications[4],[5]. For example, Aitsiselmi and Holliman reported that stereo viewing on 3D displays was effective for completing a mental rotation task, a cognitive process that involves the mental rotation of ob- jects[6]. However, there has been little research conducted on school education apart from some case studies. Bamford, for example, explored the effectiveness of using 3D images in the classroom and its potential as a teaching and learning Copyright c2017 The Institute of Electronics, Information and Communication Engineers
tool[7]. Bamford showed that students respond positively to visual stimuli and suggested that 3D images could increase student motivation and engagement. Shibata reported that in formal education, students are interested in learning, and the use of stereo 3D movies and 3D educational materials could provide them with a strong sense of depth in their learn- ing[8]. In Shibata’s study, approximately 90% of the stu- dents who participated looked forward to attending another class employing 3D educational content. This suggests that 3D images could be an effective learning tool for induc- ing student interest. In addition, Shibata et al. reported that 3D educational materials could help students focus on spe- cific details and understand 3D spaces or concavo–convex shapes[9].
2.2 Inquiry-Based Learning of and Generated Questions Related to History
Inquiry-based learning is increasingly being emphasized as an effective method of educational practice. For example, the Japanese government’s teaching guidelines for elemen- tary school, junior high school, and high school require inquiry-based learning in social studies and history[10]–
[12].
Collaborative inquiry-based learning is mainly divided into eight processes: (1) orienting and asking questions, (2) hypothesis generation, (3) planning, (4) investigation, (5) analysis and interpretation, (6) model conclusions and eval- uations, (7) communication, and (8) prediction[13]. There- fore, it is important as a first step to promote the generation of additional and deeper questions by students themselves.
This is especially important as the subsequent learning ac- tivity depends on the generation of questions. In this study, we conducted the first two steps as an inquiry-based learning process in an experimental class at an elementary school.
Additionally, the generation of questions has received attention from scholars of historical education. Many re- searchers insist that simply memorizing historical facts is insufficient and that it is more important to foster histor- ical reasoning (also referred to as “historical thinking” or
“historical literacy”)[14]and to implement collaborative in- quiry into the study of history[15]. There are six compo- nents of historical reasoning: asking historical questions, using sources, implementing contextualization, engaging in argumentation, using substantive concepts, and employing meta-concepts. Asking historical questions may function as the engine for historical reasoning[14]. Therefore, question generation is one of the essential competencies for historical learning, together with inquiry-based learning.
In addition, using educational materials that provide rich information could also stimulate question generation.
For example, McCall reported that junior high school stu- dents generated an impressive range of deep questions when using a simulation game[16]. Therefore, stereoscopic 3D images might also have a positive effect on generating ques- tions in inquiry-based learning of history.
2.3 Human Factors Aspect
Since 2005, when 3D movies and theaters were introduced, public concern regarding potential adverse effects associ- ated with prolonged viewing of 3D images has increased.
Although there are many potential causes of visual discom- fort when viewing stereoscopic 3D images, the vergence- accommodation conflict remains a key problem with stereo 3D displays because it occurs in all conventional stereo 3D displays[17],[18]. Therefore, it is of critical importance to consider how 3D images can be presented as safely as pos- sible, especially in classrooms.
For their use in elementary school social studies classes, we considered the fact that stereoscopic 3D im- ages are generally viewed at a different size on 3D displays and with different viewing distances in a classroom[9] by children with smaller interpupillary distances than those of adults. People who have a small interpupillary distance per- force view more emphasized stereo images than those who have a larger interpupillary distance when viewing the same stereo images on a 3D display of the same size. In creat- ing 3D educational materials and setting up 3D displays in the classroom, we intended to make 3D viewing as comfort- able as possible[18]–[20]. More specifically, we set the un- crossed disparity (i.e., stereo images behind the screen) and crossed disparity (i.e., stereo images in front of the screen) in the images to be less than one degree within the classroom as an index of comfort. In order to avoid a large disparity, we especially considered that students in the classroom some- times viewed the screen with a short viewing distance. In addition, we excluded possible severe adverse factors such as misalignments of the right and left images and frame vi- olations.
3. Purpose
Stereoscopic 3D images can directly express depth, concav- ity, and convexity and therefore can provide rich informa- tion compared with that provided by conventional 2D educa- tional materials. In this study, we hypothesized that stereo- scopic 3D images could help students generate more ques- tions and come up with novel questions that could not be generated from viewing 2D images. As described above, the generation of questions by students themselves is the first step of inquiry-based learning and hence has an important role in school education.
The purpose of the experimental class in this study was to evaluate the advantages of using 3D images in the inquiry-based learning of history. We focused on the ques- tions generated by students with the help of the provided educational materials.
4. Methods
4.1 Participants
We conducted an experimental class for sixth graders at a public elementary school in Japan. Students from two classes (Class 1: 26 students; Class 2: 30 students) partici- pated in the study. All of the students who attended a class that featured the 3D viewing had normal stereoacuity ac- cording to a self-report of the stereo viewing test completed before the class took place. Those who normally wore op- tical correction continued to wear them during the experi- mental class.
4.2 Learning Content
In this study, we aimed to utilize and evaluate stereoscopic 3D images in an actual school classroom. Therefore, we needed to choose the appropriate educational unit and make the 3D educational materials accordingly before conducting an experimental class. Our basic concept for 3D educational materials was that the students should view content in 3D if it is appropriate for stereo viewing.
After a discussion about the appropriate educational unit for evaluating 3D effects, a unit of the Tumulus pe- riod in Japan, which represents part of the Japanese history coursework from the sixth-grade curriculum, was selected as the learning content. From the third to the seventh cen- turies, many tumuli, orKofunin Japanese, were built across Japan.Kofunwere the burial mounds of the ruling elite, with monumental structures indicating powerful political status (Fig. 1). The mounds contained large stone chambers with terracotta clay figures calledHaniwa, which were arranged on and around the mounds.
The elementary students’ key learning objectives in- cluded having an understanding of the features of the Tu- mulus period by studying the large burial mounds (Kofun), stone chambers (Fig. 2), and the exquisite terracotta clay fig- ures (Haniwa) as shown in Fig. 3. We selected this unit be- cause the stone chambers and theHaniwahave complicated forms and figures, and we hypothesized that it would be dif- ficult for the students to understand such complicated shapes from conventional textbooks or 2D images. In other words, we deemed this unit to be appropriate for assessing the func- tionalities of stereoscopic 3D images.
4.3 Procedure
The experimental class was conducted after the students had already attended regular classes on the Tumulus period. The two regular classes were conducted by the same teacher in order to teach the same learning content. Figure 4 shows a flow of the classes. In the experimental class, two movies on the subject of theKofun, including stone chambers and Haniwa, as shown in Figs. 1, 2, and 3, were used. The con- tent on theKofunconsisted of 14 scenes, and the duration
Fig. 1 Tumuli (i.e.,Kofun) were the burial mounds of the ruling elite, and built from the third to the seventh centuries across Japan.
Fig. 2 A passage from the entrance that leads to the stone chamber in a burial mound (Kofun) captured through educational materials.
Fig. 3 Exquisite terracotta clay figures (Haniwa) that were arranged on and around the mounds.
of the movie was 1 min 47 s. TheHaniwacontent consisted of 15 scenes, and the duration of the movie was 1 min 54 s.
The viewing time for each movie shown in the class was 5 min because each movie was repeated for 5 min. The exper- imental group that used the stereoscopic 3D movie was ran- domly assigned from two 6th-grade classes, and we called it Class 1. Therefore, the students in Class 1 viewed the movies in 3D, whereas those in Class 2 viewed them in 2D.
Before viewing the movies, the students were instructed to write out their questions about theKofun, theHaniwa, and any other related topic after the movie observation.
The display was a 49-inch 3D television with polarized
glasses (KD-49X8500B, Sony), placed in front of the class- room’s blackboard (Fig. 5). The actual size of the screen was 108 cm horizontally and 61 cm vertically. The viewing distance of the students in the front and last rows was in the range of 1.5 m to 6 m approximately. The 3D movies were prepared in a Multiview Video Coding format. The left view of the stereoscopic 3D movies was used to conduct for the 2D observation.
After the viewing of each of the two movies, the stu- dents completed a worksheet that encouraged them to write out their questions about theKofun, theHaniwa, and any- thing else that might have emerged from viewing the educa- tional materials. The students made a list of as many ques- tions as possible in 3 min. As a pre-test for the study, the students were also asked to complete an identical worksheet in 6 min at the end of their previous regular classes.
Fig. 4 Flow of the experimental classes in the study.
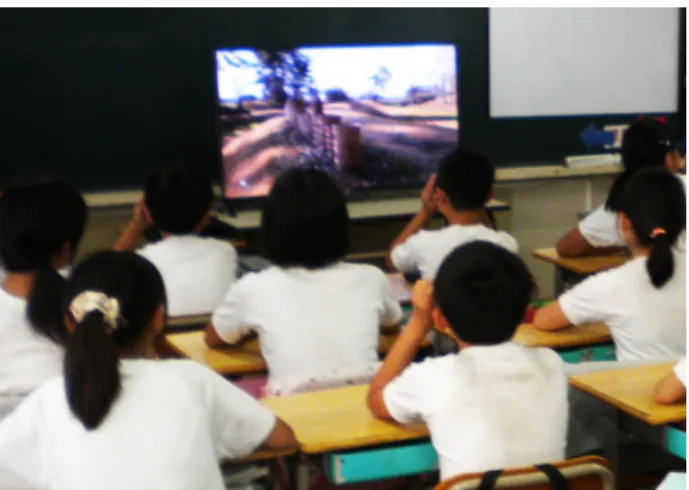
Fig. 5 A scene from the experimental 3D classroom in an elementary school.
In the experimental class, the students discussed their hypotheses about the questions in a small group after com- pleting the two worksheets, which is the second step of inquiry-based learning.
4.4 Analysis
For our analysis, we focused on two evaluation items: the number of questions and the differences in the categories of questions generated after 3D and 2D viewings. Regard- ing the number of questions, a greater number of questions can be interpreted as indicating that the educational mate- rials were more effective because the students could actu- ally generate questions, which is the first step of conducting inquiry-based learning. Regarding the differences in the cat- egories of questions, the category which was generated only from 3D viewing can be interpreted as a characteristic edu- cational effect of 3D educational materials.
5. Results
5.1 Number of Questions
We compared the results of the pre-test and the two post- tests, which were of the same duration (6 min) and used to generate questions. The average pre-test numbers were 5.13 in 2D and 4.77 in 3D, respectively, and the average post- test numbers were 7.63 in 2D and 9.54 in 3D, respectively.
Figure 6 illustrates the results for the number of questions the students generated for both the 2D and 3D observations before and after they had viewed the educational materials.
The scores were averaged on the basis of the number of stu- dents in each class. The error bars represent the standard errors of the scores.
A mixed-design analysis of variance (ANOVA) was performed to explore an interaction between educational materials (2D vs. 3D; between subjects) and measuring time (pre-test vs. post-test; within subjects). There was a statisti- cally significant main effect of measuring time (F(1,54)= 85.27, p < .001), and a significant interaction with edu- cational materials and measuring time (F(1,54) = 8.31,
p < .01). Focusing on the results of the 3D images, the
Fig. 6 Changes in the number of questions generated before and after viewing the given educational materials.
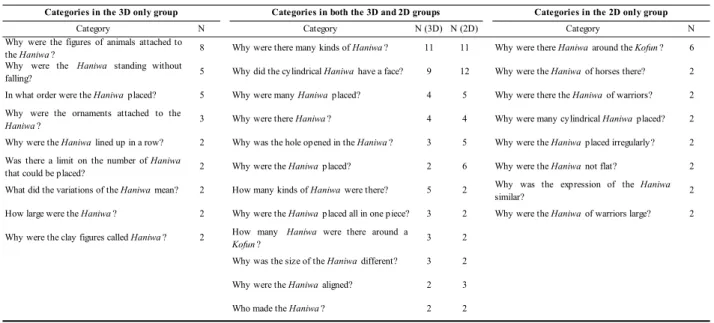
Table 1 Differences in the categories of questions about theKofuncontent (N means the number of students generating questions belonging to the category).
Table 2 Differences in the Categories of questions about theHaniwacontent (N means the number of students generating questions belonging to the category).
number of questions that were generated in the post-test was significantly higher than those in the pre-test. Furthermore, the increased extent was greater than in the case of 2D im- ages.
5.2 Differences in the Categories of Questions
Table 1 presents the categories of questions for theKofun content and Table 2 presents the categories of questions for theHaniwa content. The tables are divided into three columns: categories that were shown to the 3D only group, categories showed to both the 3D and 2D groups, and cate- gories showed to the 2D only group.
The process to generate categories was as follows:
First, a category was generated if more than two students from each group had generated similar questions. Second, the categories generated from the first step were checked with the category of the 3D only group, the 3D and 2D group, and the 2D only group. The analytical work was implemented by one of authors in the first instance. Then, to ensure the reliability of the categorization, another author checked whether the categorization was valid for all cate- gories and whether all of the questions had been derived from the students. After this checking process, the two au- thors discussed the points that were put forth by the second author. As a result, the categorization for 26 out of the 479 questions was discussed and the categorization for 21 ques-
tions was modified on the basis of this discussion.
First, we focused on the results of the 3D only group.
For theKofuncontent, the categories of questions generated for the 3D only group were seven (the left column of Ta- ble 1). These questions included “Why was there a groove around theKofun?”, “Why was the size of theHaniwadif- ferent?”, “Why were the Haniwa not placed in order?”,
“Why were the Haniwa black?”, “Where would the dead leave for?”, “Why did people enter the stone chamber?”, and “Where were the rocks brought from?” For example, the questions generated by the students in the first category of “Why was there a groove around theKofun?” were “Why was there a groove?” and “Why was the area around the Kofundented?”
For the Haniwa content, nine categories of questions were generated in 3D only group (left column of Table 2):
“Why were the figures of animals attached to theHaniwa?”,
“Why were theHaniwastanding without falling?”, “In what order were theHaniwaplaced?”, “Why were the ornaments attached to theHaniwa?”, “Why were theHaniwalined up in a row?”, “Was there a limit on the number ofHaniwathat could be placed?”, “What did the variations of theHaniwa mean?”, “How large were theHaniwa?”, and “Why were the clay figures called Haniwa?”. For example, the first category of “Why were the figures of animal attached to theHaniwa?” included the questions “Why were the fig- ures of the human and the animal attached to the cylindrical Haniwa?” and “Why were the figures of animals attached to theHaniwa?” Additionally, the second category of “Why were theHaniwa standing without falling?” included the questions “Why were theHaniwanot falling?” and “Why were theHaniwastanding without falling?”
Second, we focused on the results of the characteris- tic categories in both the 3D only and 2D only groups. We defined that a category with three or more questions was a characteristic response to that group in order to eliminate eventuality and improve reliability. This is because the num- ber 2 is the smallest value to make a category. In the 3D only group, the category with the largest number was “Why were the figures of animals attached to theHaniwa?” (N =8) from the Haniwa content. These questions were focused on the animal shaped objects attached to the side of the Haniwa. The second category was “Why were theHaniwa standing without falling?” (N=5) from theHaniwa con- tent. These questions were focused on the spatial balance that theHaniwadoes not collapse. The third category was
“In what order were theHaniwaplaced?” (N=5) from the Haniwacontent. These questions were focused on the order in which theHaniwaare lining up (i.e. spatial alignment).
The fourth category was “Why were the ornaments attached to theHaniwa?” (N=3) from theHaniwacontent. These questions, like the first category, were focused on the objects attached to the side of theHaniwa.
In the 2D only group, the category with the largest number was “Why was the entrance of the Kofun at the side?” (N=9) from the Kofuncontent. These questions were focused on the overall positional relationship that the
entrance to the stone chamber laid on the side of theKofun.
The second category was “Why were thereHaniwaaround theKofun?” (N=6) from theHaniwacontent. These ques- tions were focused on the overall positional relationship as well as the first category. The third category was “Why were the Kofunhigh?” (N=4) from theKofuncontent. These questions were focused on the overall characteristics of the Kofun.
5.3 Hypothesis Generation from Questions
Next, we present how the category of questions generated in the 3D only group led to the following step of inquiry-based learning, namely, hypothesis generation. For example, one of the 3D viewing groups that selected the question “Why were the figures of animals attached to theHaniwa?” (the first category of questions for theHaniwacontent) generated nine hypotheses: “Because the human who was buried liked animals,” “Because they thought of cylindricalHaniwaas a tree,” “Because animals were luxury foods,” “Because many people liked animals,” “Because the animal was kept by the human who was buried,” “Because animals looked deli- cious,” “Because there were animal deities,” “Because they drew the scene of the human being chased by the animal,”
and “Because the human was being helped by the animal.”
Another 3D viewing group that selected the question
“Why were theHaniwanot falling?” (the second category of questions for the Haniwa content) generated four hy- potheses: “Because the Haniwa were buried in the soil,”
“Because the balance of the Haniwa was correctly calcu- lated,” “Because theHaniwawere made in order not to be blown by passing wind,” and “Because theHaniwacreated were heavy.”
6. Discussions
Our results showed that the number of student questions after viewing 3D educational materials was significantly higher than that during the pre-test compared to 2D educa- tional materials. Note that the students had already attended the regular class before the experimental class. In other words, the student had finished normal learning in class and understood the learning content before the experimental class. Therefore, the 3D educational materials were effec- tive in that the students were able to generate more questions and think deeply about the learning content.
To clarify the effects of the 3D educational materials, we performed a qualitative analysis of the questions gener- ated by the students. From the results of theKofuncontent (Table 1), in the 3D only group, there were several questions mainly about the size, order, and color of theHaniwa. On the other hand, in the 2D only group, there were questions about the overall positional relationship, such as the posi- tional relationship between theHaniwaand the entrance to the stone chamber, and the height of theHaniwa. Thus, it was suggested that 3D educational materials have an effect to make specific parts attractive.
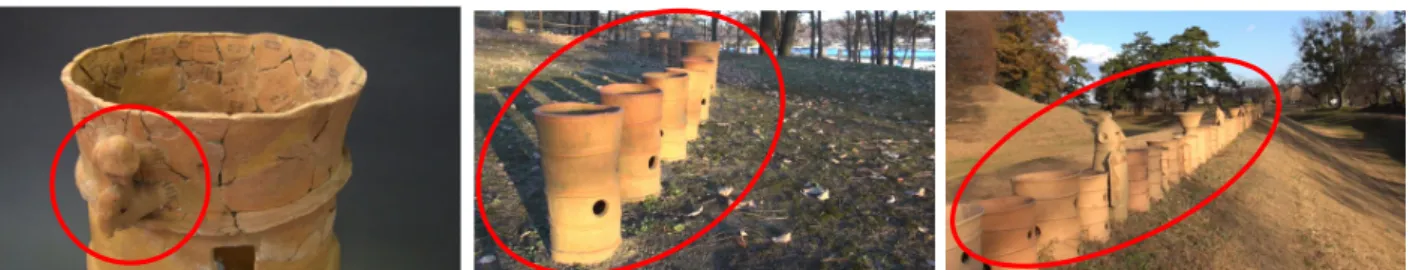
Fig. 7 Differential focus areas of the students’ attention from the viewings of the 3D and 2D educa- tional materials and the related scenes that the students seemed to have referred to.
Fig. 8 An example of a scene featured in the educational materials used in this study. Cross fuse for the left pairs (Left: image for right eye; Center: image for left eye: Right: depth map image).
A similar tendency was also seen in the result of Haniwacontent (Table 2). In other words, in the 3D only group, there were several questions mainly about the at- tached objects of theHaniwa, theHaniwa’s spatial balance and spatial alignment, which were focused on specific parts (Fig. 7). On the other hand, in the 2D only group, there were questions about the overall positional relationship.
The questions common to both the 3D and 2D groups (Tables 1 and 2) were about basic aspects related toHaniwa, such as many kinds ofHaniwa, a face attached toHaniwa, and manyHaniwathat were placed. However, having a face on theHaniwawas unique to the educational material that was used and this is not a general feature of theHaniwa.
The results revealed that 3D educational materials helped them generate novel questions that were not observed in the 2D observation. An interesting finding was that 3D educational materials could increase the focus of the stu- dents on specific parts in images such as attached objects of theHaniwa, whereas 2D educational materials only helped them view the overall scene (Fig. 7). Also, in 3D view-
ing, the students focused on theHaniwa’s spatial balance, and spatial alignment. In contrast, in 2D viewing, they fo- cused on the overall characteristics of theKofun, including the alignment of large areas such as the position of theKo- funand the entrance to the stone chamber and the arranged Haniwaaround theKofun.
The difference of such focus areas suggests that stereo- scopic 3D images have the functionality of enabling stu- dents to focus their attention on specific parts of the edu- cational materials. This is considered to be related to the disparity of stereoscopic 3D images or the spatial position of reconstructed images placed in front or behind of the dis- play screen. Figure 8 represents an example scene that the students seem to have referred to when viewing stereoscopic 3D images. It is an image that seems to have focused the students’ gaze on the order of theHaniwa. The left and cen- ter images consist of the stereogram for cross-eyed view- ing. The left image is for the right eye and the center im- age is for the left. The right image is a depth map that can represent different levels of depth and was produced by the
left and right stereo-pair images. The brightness shows the depth level, which indicates a spatial alignment of the stereo image. The depth map indicates that a row ofHaniwa is clearly represented toward the front in comparison to other objects; hence, it is considered that the students focused on this area and then noticed the alignment and gave it consid- erable thought.
These findings suggest that stereoscopic 3D images could shape the areas of interest that students have in ad- vance. Therefore, the use of 3D educational materials could be more effective when teachers want to make students fo- cus on important parts from the viewpoint of learning objec- tives.
From the perspective of inquiry-based learning of his- tory, it is considered important to think deeply about the background of history. The students thought that “because animals were luxury foods” and “because there were animal deities,” the figure of the animal was attached to theHaniwa.
This can be considered to be a trigger for further exploration into the social positioning of animals of the time. Therefore, 3D images draw students’ attention to a part of historical things and geological formations, making it possible to gen- erate questions that are difficult to notice in character and 2D images materials.
Through the experimental classes, no student reported discomfort or any of the visual fatigues associated with 3D image viewing. Viewing durations were limited to 5 min per movie, with sufficient time between viewings; however, in general, some individuals with normal vision in both eyes are not good at viewing stereoscopic 3D images. There- fore, despite the strong potential of 3D images as a learning tool, their use in schools requires careful consideration. Fur- ther, there are several uses of displays according to learning design in schools. In addition, it is necessary to pay more attention that students are sometimes required to be closer than normal television viewing distance.
7. Conclusions
We examined the advantages of using stereoscopic 3D im- ages for educational purposes in an elementary school class.
Comparing two educational materials presented in 2D and 3D, we showed that 3D viewing could enable students to think in detail about the learning content and thus pro- mote inquiry-based learning. Moreover, the results revealed that 3D educational materials can help students generate novel questions about attached objects of theHaniwa, and Haniwa’s spatial balance and spatial alignment. Addition- ally, 3D educational materials allowed the students to think deeply about the background of history. In concluding the results of the experimental classes, we should note that the educational use of stereoscopic 3D images is worthwhile in that it supports question and hypothesis generation in inquiry-based learning.
In this study, we analyzed only the first two processes out of the eight associated with inquiry-based learning. As a subsequent activity for inquiry-based learning, it is a task
for future studies to determine whether we can further pro- mote the learning by combining it with other kinds of 3D educational materials. For example, the study’s results show the possibility of applying the same process to other factors of inquiry-based learning, such as investigation (fourth pro- cess) and analysis and interpretation (fifth process). In other words, 3D educational materials could possibly be used as an experimental tool to verify a hypothesis. In the class- room, a teacher asks students to think about what and how the order of theHaniwais formed. The students will make some hypotheses and verify them using 3D images instead of textbooks. They may then notice that theHaniwaare dis- jointed and prove the hypotheses correct by 3D observation.
In this study, 3D educational materials were used for a history class in school, and we showed the educational effec- tiveness although it is a subject that seems to have nothing to do with stereoscopic viewing. As we described earlier, stereoscopic 3D images can directly express depth, concav- ity, and convexity. Therefore, it is considered to be very effective for education in science, technology, engineering, and mathematics (STEM) as well.
Future studies are required to examine the educational functionality of stereoscopic 3D images in more detail, along with how 3D educational materials can be used for the development of new educational models in school. An ap- propriate way to use 3D displays in education is also needed to be examined in order to keep students’ interests and im- prove educational effects. In addition, it is necessary for teachers to prepare easy-to-use educational materials with less cognitive load so that they can be practically used in class.
Acknowledgments
This research was supported by the Japan Society for the Promotion of Science (25560118). We acknowledge the co- operation of the Maebashi Board of Education, which per- mitted the recording of the Kofun and Haniwa unearthed from an ancient tumulus.
References
[1] Ministry of Education, Culture, Sports, Science and Technology in Japan, Retrieved Feb. 27th, 2017, from http://www.mext.go.jp/ english/
[2] C. Ware and G. Franck, “Evaluating stereo and motion cues for visu- alizing information nets in three dimensions,” ACM Trans. Graphic., vol.15, no.2, pp.121–140, 1996.
[3] B. Fr¨ohlich, S. Barrass, B. Zehner, J. Plate, and M. Gobel, “Ex- ploring geo-scientific data in virtual environments,” Proc. of IEEE:
Visualization, vol.99, pp.169–173, 1999.
[4] P.J. Edwards, L.G. Johnson, D.J. Hawkes, M.R. Fenlon, A.J. Strong, and M.J. Gleeson, “Clinical experience and perception in stereo aug- mented reality surgical navigation,” Lecture Notes in Computer Sci- ence, vol.3150, pp.369–376, 2004.
[5] R. Zajtchuk and R.M. Satava, “Medical applications of virtual real- ity,” Commun. ACM, vol.40, no.9, pp.63–64, 1997.
[6] Y. Aitsiselmi and N.S. Holliman, “Using mental rotation to evaluate the benefits of stereoscopic displays,” Proc. SPIE 7237, 2009.
[7] A. Bamford, “The 3D in education white paper,” Technical report,
International Research Agency, 2011.
[8] T. Shibata, “Utilization of stereoscopic 3D images for social studies class in elementary school,” EdMedia, pp.2575–2580, 2014.
[9] T. Shibata, Y. Ishihara, and K. Satou, “Usefulness of stereoscopic 3D images in elementary school classes,” SID 2015 DIGEST, vol.46, no.1, pp.126–129, 2015.
[10] Ministry of Education, Culture, Sports, Science and Technology – Japan, Shou Gakkou Gakushuu Sidouyouryou Kaisetsu Shakai hen, Toyo kan shuppannsha, 2008.
[11] Ministry of Education, Culture, Sports, Science and Technology – Japan, Chu Gakkou Gakushuu Sidouyouryou Kaisetsu Shakai hen, Nihon Bunkyo shuppan, 2008.
[12] Ministry of Education, Culture, Sports, Science and Technology – Japan, Koutou Gakkou Gakushuu Sidouyouryou Kaisetsu Chiri Rekishi hen, Kyoiku shuppan, 2010.
[13] T. Bell, D. Urhahne, S. Schanze, and R. Ploetzner, “Collaborative in- quiry learning: Models, tools, and challenges,” International Journal of Science Education, vol.3, no.1, pp.349–377, 2010.
[14] J. van Drie and C. van Boxtel, “Historical reasoning: Towards a framework for analyzing students’ reasoning about the past,” Edu- cational Psychology Review, vol.20, no.2, pp.87–110, 2008.
[15] A.P. Nilsen, “Navigating windows into past human minds: A frame- work of shifting selves in historical perspective taking,” J. Learn.
Sci., vol.25, pp.372–410, 2016. DOI: 10.1080/10508406.2016.
1160830
[16] J. McCall, Gaming The Past Using Video Games to Teach Sec- ondary History, Routledge, 2011.
[17] D.M. Hoffman, A.R. Grishick, K. Akeley, and M.S. Banks,
“Vergence-accommodation conflicts hinder visual performance and cause visual fatigue,” Journal of Vision, vol.8, no.3, pp.1–30, 2008.
DOI: 10.1167/8.3.33
[18] T. Shibata, J. Kim, D.M. Hoffman, and M.S. Banks, “The zone of comfort: Predicting visual discomfort with stereo displays,” Journal of Vision, vol.11, no.8, pp.1–29, 2011. DOI: 10.1167/11.8.11 [19] M. Lambooij, M. Fortuin, W. IJsselsteijn, B. Evans, and I. Heynd-
erickx, “Measuring visual fatigue and visual discomfort associated with 3-D displays,” Journal of the Society for Information Display, vo.18, no.11, pp.931–943, 2010.
[20] K. Ukai and P.A. Howarth, “Visual fatigue caused by viewing stereo- scopic motion images: Background, theories, and observations,”
Displays, vol.29, no.2, pp.106–116, 2008.
Takashi Shibata received his Ph.D.
in Global Information and Telecommunication Studies from Waseda University, Japan, in 2004.
Subsequently, he became a research fellow of the Japan Society for the Promotion of Science and a postdoctoral scholar at the University of California, Berkeley. Currently, he is working as an associate professor at the Tokyo Univer- sity of Social Welfare, Japan. His interests in- clude ergonomics, vision science, and human in- terface. He is a member of the Applied Vision Sub-committee at the Society for Information Display.
Kazunori Sato received his M.A. in Educa- tion from the Joetsu University of Education in 2006. He had been an elementary school teacher at Tokyo Metropolitan from 2006 to 2017. He is currently an assistant professor at the Faculty of Education, Tokoha University, and a Ph.D.
student at the Graduate School of Information Sciences, Tohoku University, after enrolling in 2014. He is engaged in research and the devel- opment of education in the media and informa- tion society.
Ryohei Ikejiri received his B.A. in History from the University of Tokyo in 2008 and his Master’s and Ph.D. in Interfaculty Initiative in Information Studies from the University of To- kyo in 2010 and 2014, respectively. He is cur- rently an assistant professor at the University of Tokyo. His research interests lie in historical learning, educational technology, and the trans- fer of learning.