Decrease in histidine-rich glycoprotein as a novel biomarker to predict sepsis among systemic inflammatory response syndrome
Authors: Kosuke Kuroda, M.D.1,2,a, Hidenori Wake, Ph.D.2,a, Shuji Mori, Ph.D.3, Shiro
Hinotsu, M.D., Ph.D.4, Masahiro Nishibori, M.D., Ph.D.2, Hiroshi Morimatsu, M.D.,
Ph.D.*,1
a: These authors contributed equally to this work.
Affiliation:
1Department of Anesthesiology and Resuscitology, Okayama University Graduate
School of Medicine, Dentistry and Pharmaceutical Sciences, Okayama, Japan
2Department of Pharmacology, Okayama University Graduate School of Medicine,
Dentistry and Pharmaceutical Sciences, Okayama, Japan
3Department of Pharmacology, School of Pharmacy, Shujitsu University, Okayama,
Japan
4Center for Innovative Clinical Medicine, Okayama University Hospital, Okayama,
Japan
Postal addresses:
1,2, &4 2-5-1 Shikata-cho, Kitaku, Okayama 700-8558, Japan
3 1-6-1 Nishigawara, Nakaku, Okayama 703-8516, Japan
*: Corresponding author
Hiroshi Morimatsu, M.D., Ph.D.
2-5-1, Shikata-cho, Kita-ku, Okayama 700-8558, Japan
TEL: +81-86-235-7327, FAX: +81-86-235-6984
E-mail: [email protected]
This study was conducted at Okayama University Graduate School of Medicine,
Dentistry and Pharmaceutical Sciences, Okayama, Japan.
Financial supports: This work was supported by grants from Scientific Research from
the Ministry of Health, Labour, and Welfare of Japan (WA2F2547, WA2F2601), the
Japan Agency for Medical Research and Development, AMED (15lk0201014h0003),
the Japan Society for the Promotion of Science (JSPS No. 2567046405, 15H0468617),
and Secom Science and Technology Foundation to MN, and from the Hokuto
Foundation for Bioscience to HW.
Conflict of interests: We declare no conflict of interests.
Keywords: Histidine-rich glycoprotein, Biomarker, Sepsis, SIRS
Word counts: 2743 words
ABSTRACT Objective
Many biomarkers for sepsis are used in clinical practice, however, few have become the
standard. We measured plasma histidine-rich glycoprotein (HRG) levels in patients with
systemic inflammatory response syndrome (SIRS). We compared HRG, procalcitonin
(PCT), and presepsin levels to assess their significance as biomarkers.
Design
Single center, prospective, observational cohort study.
Setting
Intensive Care Unit (ICU) at a university affiliated hospital.
Patients
Seventy-nine ICU patients (70 with SIRS and 9 without SIRS) and 16 healthy
volunteers.
Interventions
None
Measurements and Main Results
We collected blood samples from patients within 24h of ICU admission. HRG levels
were determined using enzyme-linked immunosorbent assay (ELISA). The median
HRG level in healthy volunteers (n=16) was 63.00 (interquartile range, 51.53–66.21)
µg/ml. HRG levels in SIRS patients (n=70, 28.72 [15.74–41.46] µg/ml) were lower than
those in non-SIRS patients (n=9, 38.64 [30.26–51.81] µg/ml; P = .049). Of 70 patients
with SIRS, 20 had sepsis. HRG levels were lower in septic patients than in
non-infective SIRS patients (8.71 [6.72–15.74] vs 33.27 [26.57–44.99] µg/ml; P < .001)
and were lower in non-survivors (n=8) than in survivors (n=62) of SIRS (9.06
[4.49–15.70] vs. 31.78 [18.57–42.11] µg/ml; P < .001). HRG showed a high sensitivity
and specificity for diagnosing sepsis. Receiver-operating characteristic (ROC) curve
analysis for detecting sepsis within SIRS patients showed that the area under the curve
for HRG, PCT, and presepsin was 0.97, 0.82, and 0.77, respectively. In addition,
survival analysis in SIRS patients revealed that the Harrell C-index for HRG, PCT, and
presepsin was 0.85, 0.65, and 0.87, respectively.
Conclusions
HRG levels were low in patients with sepsis and were significantly related to mortality
in SIRS population. Moreover, as a biomarker, HRG may be superior to PCT and
presepsin.
INTRODUCTION
Sepsis is a systemic illness, one of the most severe diseases of patients encountered in
the intensive care unit (ICU). Despite recent medical progress, the mortality rate of
patients with sepsis shows little sign of improvement (1, 2). There are many clinical
biomarkers available for rapid diagnosis of sepsis; however, few have become standard
(3). Procalcitonin (PCT), the soluble triggering receptor expressed on myeloid cells-1
(sTREM-1), and presepsin are considered promising diagnostic and prognostic
biomarkers, although they are limited in their ability to diagnose sepsis (3, 4).
The liver produces histidine-rich glycoprotein (HRG) present in plasma. HRG is a
multidomain (structured) protein that interacts with many ligands and is therefore
thought to be involved in many functions such as coagulation, immune response,
angiogenesis modulation, and others (5, 6). In particular, some articles previously
reported that HRG, both in vitro and in vivo, was highly relevant to infections caused by
bacteria (7) and fungi (8), and suggested that HRG plays a protective role in the host
defense mechanism (7–9). Recently, our group demonstrated that HRG at normal
physiological concentrations maintains circulating neutrophils and vascular endothelial
cells quiescent, and that plasma HRG levels are decreased rapidly in mice with sepsis,
triggering a cascade of events in septic pathogenesis including immunothrombosis,
acute respiratory distress syndrome (ARDS), and disseminated intravascular
coagulation (DIC) (10). Based on these findings, we suggested a supplementary therapy
with HRG for the treatment of sepsis (10).
In this study, we developed a new enzyme-linked immunosorbent assay (ELISA) to
measure HRG levels in plasma and used it to perform a prospective observational study
of patients with systemic inflammatory response syndrome (SIRS). We aimed to
determine whether there was a difference between HRG levels of patients with and
without infection as well as survivors and non-survivors.
MATERIALS and METHODS Study design
We conducted a single-center, prospective, and observational investigation that was
approved by the Institutional Review Board of the Okayama University Graduate
School of Medicine, Dentistry, and Pharmaceutical Sciences. We followed guidelines as
outlined in Strengthening the Reporting of Observational Studies in Epidemiology (11).
Patients and data collection
Patients newly admitted to the intensive care unit (ICU) of Okayama University
Hospital were prospectively enrolled in the study if they fulfilled at least two diagnostic
criteria for SIRS. Inclusion criteria were patients who were expected to stay in the ICU
for >3 days (excluding less-severe patients) and those with an arterial blood collection
line. Exclusion criteria were <20 years of age, pregnancy, only overnight stay in the
ICU, or failure to obtain consent. For comparison, we collected blood samples from
patients fulfilled all inclusion criteria except for SIRS criteria (non-SIRS ICU patients).
In addition, plasma samples from healthy volunteers were collected and analyzed to
determine HRG levels.
Clinical and laboratory data were collected daily while patients were in the ICU. Initial
Sequential Organ Failure Assessment (SOFA) and Acute Physiology and Chronic
Evaluation (APACHE) II scores were calculated using clinical parameters and blood test
results. SIRS, sepsis, severe sepsis, and septic shock were classified according to the
guidelines of the American College of Chest Physicians/Society of Critical Care
Medicine and the International Surviving Sepsis Campaign Guidelines Committee
(Sepsis-2) (12, 13). Follow-up investigations were conducted 28 and 90 days after
enrollment and at ICU discharge to determine survivors and non-survivors.
Analytical methods
Blood samples were collected in tubes containing K2EDTA (BD 367840;
Beckton-Dickinson, Franklin Lakes, NJ, USA) within 24 h of ICU admission, processed
within 30 min of sampling, and centrifuged at 3500 rpm for 10 min. The supernatant
was pipetted into polypropylene tubes, a protease inhibitor cocktail (Complete mini
EDTA-free; Roche Diagnostics, Basel, Switzerland) was added, and samples were
stored at −80°C.
HRG levels were determined using the quantitative sandwich ELISA with a rat
monoclonal antibody (mAb) against human HRG (made in-house, #75-14) as the
capture antibody and horseradish peroxidase-conjugated nickel-nitrilotriacetic acid
(Ni–NTA HRP Conjugate; Qiagen, Venlo, Netherlands) for detection. To perform
ELISA, 3 µg of mAb per well was diluted in coating buffer (0.05M Na2CO3, pH 9.6),
and immobilized on a 96-well plate (COSTAR 3590; Corning, Tewksbury, MA, USA)
overnight at 4°C. After three washing steps using phosphate-buffered saline (PBS)
containing 0.05% Tween 20, the plate was incubated with blocking buffer containing
3% bovine serum albumin (BSA) in PBS for 1 h at 37°C. After three further washing
steps, plasma samples were diluted 1:50 in PBS containing 1% BSA and incubated for 2
h at 37°C in the mAb-coated wells on the microplate shaker set at 500 rpm. After three
washing steps, the plate was incubated with the Ni-NTA HRP conjugate diluted 1:1000
in PBS containing 0.2% BSA for 1.5 h at 37°C with shaking. After six extensive
washing steps, o-phenylenediamine (Wako, Osaka, Japan) and stop solution (3M
H2SO4) were added, and absorbance at 492 nm was measured using a 96-well plate
reader (Model 680; Bio-Rad, Hercules, CA). A standard curve (Supplementary Fig. 2)
was established using serial dilutions of known amounts of purified HRG (made
in-house, Supplementary Content 1, Supplementary Fig. 3). Intra-assay reproducibility
was determined by assaying the sample six times and inter-assay reproducibility was
determined by five independent assays. The intra-assay and inter-assay coefficients of
variability were 4.19% and 15.5%, respectively. Duplicate plasma samples were tested,
and independent assays were repeated twice.
PCT levels were determined using an automated electrochemiluminescence
immunoanalyzer (Modular Analytics E-170; Roche Diagnostics, Mannheim, Germany)
in the Clinical Chemistry Laboratory of Okayama University Hospital. Presepsin levels
were measured using PATHFAST Presepsin (LSI Medience, Tokyo, Japan).
Outcomes
The primary outcome of this study was to assess the significance of the difference
between HRG levels in healthy volunteers, non-SIRS patients, and patients with SIRS.
Secondary outcomes were to assess differences between each marker in patients with
and without sepsis as well as survivors and non-survivors of SIRS.
Statistical analysis
Data were expressed as median and interquartile ranges (IQR, 25th to 75th percentiles),
all analyses were two-sided, and a P value < .05 was considered statistically significant.
The Mann–Whitney test or the Kruskal–Wallis test implemented following the
Steel–Dwass method was used to compare groups. The receiver-operating characteristic
(ROC) curve analysis was used to determine the diagnostic accuracy. The Cox
proportional hazard model and Kaplan–Meier method were used to analyze survival.
We performed survival analysis using the 90–day mortality. In addition, we made
adjustment with APACHE II score to correct for disease severity. When we performed
Kaplan–Meier method, we divided patients into two groups according to the cut off
value which was calculated in logistic regression model (sensitivity analysis); hazard
ratio was calculated with Cox proportional hazard model. We calculated Spearman rank
correlation coefficient to assess correlations between HRG and other parameters. We
used JMP Pro 11 software (SAS Institute Inc., Chicago, IL, USA) for all analyses,
except for calculations of the Harrell C-index, which was determined using STATA 12
software (SAS Institute Inc.).
RESULTS
Patient characteristics
SIRS patients were prospectively included from November 2012 through November
2014. During this period, the ICUs of Okayama University Hospital admitted 3664
patients, including 728 with SIRS. About three fourth of them were one-night stay in
ICU. For lack of resource availability, we were granted written consent to collect blood
from 70 patients, whose characteristics are shown in Table 1 and Supplementary Table 1.
The median age of patients was 67 (IQR, 62–76) years, 52 (74%) were males, and all
were treated in the ICU for 6 (IQR, 4–9) days. The median patient APACHE II and
SOFA scores were 15 (IQR, 12.7–18.2) and 3 (IQR, 2–5), respectively, and 20 patients
(29%) were diagnosed with sepsis. ICU mortality and 90–day mortality were both 11%
(eight patients) and 28–day mortality was 7.1% (five patients). We were granted written
consent from 9 non-SIRS patients and 16 healthy volunteers. There were no differences
in age among all groups used in analyses, except for healthy volunteers.
Plasma levels of HRG and other markers
The median HRG level in healthy volunteers (n = 16) was 63.00 (IQR, 51.53–66.21)
µg/ml (Supplementary Fig. 3A). HRG levels in non-SIRS patients (n = 9, 38.64 [IQR,
30.26–51.81] µg/ml) were significantly lower than those in healthy volunteers (P
= .0017). Furthermore, HRG levels in SIRS patients (n = 70, 28.72 [IQR, 15.74–41.46]
µg/ml) were lower than those in non-SIRS patients (P = .049).
Supplementary Fig. 3B and Supplementary Fig. 3C show the results of secondary
analyses. Comparison of patients with sepsis (n = 20) and patients with non-infective
SIRS (n = 50) showed that HRG levels in the former group were significantly lower
than those in the latter group (8.71 [IQR, 6.72–15.74] vs 33.27 [IQR, 26.57–44.99]
µg/ml; P < .001). Moreover, PCT and presepsin levels of septic patients were
significantly higher than those of non-infective SIRS patients. In SIRS patients, HRG
levels of non-survivors (n = 8, 9.06 [IQR, 4.49–15.70] µg/ml) were significantly lower
(P < .001) than those of survivors (n = 62, 31.78 [IQR, 18.57–42.11] µg/ml). Although
presepsin levels of non-survivors (1276 [IQR, 802.7–5437] pg/ml) were significantly
higher (P < .001) than those of survivors (449 [IQR, 326.7–618.7] pg/ml), their PCT
levels (0.520 [IQR, 0.220–1.277] vs. 1.605 [IQR, 0.555–3.330] ng/ml) were not
significantly different (P = .73). Within septic patients, there were no differences in
HRG level between survivors (n = 12) and non-survivors (n = 8) (data not shown).
Diagnostic accuracy of HRG levels
We performed ROC curve analysis to detect patients with sepsis within the group with
SIRS. The ROC curve for HRG was highly sensitive and specific, with the following
area under the curve (AUC) values: HRG, 0.97; PCT, 0.82; presepsin, 0.77 (Fig. 1).
AUC for HRG was higher than that of PCT (p = .0018) and presepsin (p = .0012).
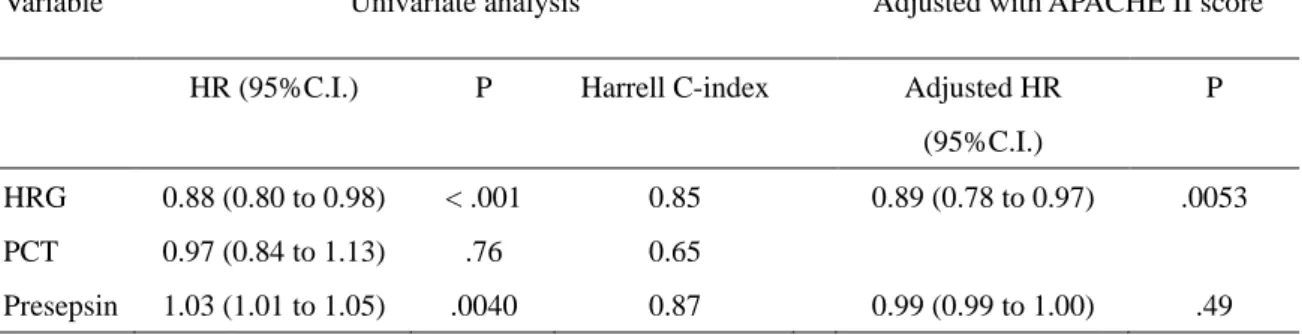
Associations between markers and mortality
Table 2 shows associations between the plasma level of each marker and mortality.
HRG level on ICU day 1 was significantly associated with mortality (Hazard ratio [HR],
0.88; 95% confidence interval [CI], 0.80–0.98; P < .001), and when adjusted according
to APACHE II score, this level remained an independent prognostic factor (adjusted HR,
0.89; 95% CI, 0.78–0.97; P = .0053). The presepsin level was significantly associated
with mortality in univariate analysis (HR, 1.03; 95% CI, 1.01–1.05; P = .0040),
although when adjusted using the APACHE II score, there was no significant
association between presepsin level and mortality (adjusted HR, 0.99; 95% CI,
0.99–1.00; P = .49). The PCT level did not significantly associate with mortality. The
Harrell C-index for mortality was as follows: HRG, 0.85; PCT, 0.65; presepsin, 0.87;
APACHE II score, 0.90; SOFA score, 0.88; C-reactive protein (CRP), 0.61.
Supplementary table 2 shows that the sensitivity and specificity of HRG levels
associated with mortality at the cutoff level of 16.0 µg/ml were 0.87 and 0.79,
respectively. Thus, when patients were divided into higher HRG and lower HRG groups
according to this cutoff level, Kaplan–Meier curves (Fig. 2) showed that the mortality of
the lower HRG group was significantly higher than that of the higher HRG group (HR,
9.18; 95% CI, 1.85–45.5; P = .0028).
DISCUSSION
In this study, we found that HRG levels of SIRS patients were significantly lower than
those of non-SIRS patients and that HRG levels of septic patients were lower than those
of non-infective SIRS patients. In addition, HRG was significantly associated with
mortality and provided sufficient diagnostic and prognostic accuracy as a biomarker for
sepsis within SIRS patients.
HRG levels decreased in patients with SIRS who were treated in the ICU. To our
knowledge, there are no reports describing HRG levels in critically ill patients, although
HRG levels have been shown to decrease in patients with liver insufficiency (14) and in
those receiving corticosteroids (15). HRG levels have also been proposed to decrease
during pregnancy and further decrease in patients with pre-eclampsia (16). In addition,
HRG levels have been shown to decrease in outpatients with elevated CRP values,
leading to the conclusion that HRG acts as a negative acute-phase reactant (17). In this
study, we demonstrated that HRG levels decreased in patients with SIRS and were
negatively correlated with CRP levels (Supplementary table 3). Our results support the
conclusion that inflammation decreases HRG levels.
We evaluated HRG as a biomarker for sepsis by comparing HRG levels with levels of
PCT and presepsin, both clinical biomarkers for sepsis (3). When we divided SIRS
patients into groups with and without infection, ROC curve analysis for diagnosing
sepsis revealed that AUC for HRG, PCT, and presepsin was 0.97, 0.82, and 0.77,
respectively. These data indicate that HRG is the best marker for detecting sepsis within
SIRS patients. The review article focused on the use of PCT in septic patients in an ICU
setting reported that the sensitivity to detect sepsis ranged from 65 to 96 % and the
specificity ranged from 70 to 89 %, which was in agreement with current study (18).
Moreover, we demonstrated that HRG and presepsin levels, but not PCT levels, were
associated with mortality. The Harrell C-index (predictive power) for mortality was 0.85
and 0.87 for HRG and presepsin, respectively, consistent with the C-index for the
APACHE II score (0.90). This score is an established clinical prognostic marker used
worldwide but involves a complicated scoring system calculated according to dozens of
parameters. Thus, our present results strongly suggest that HRG will serve as a more
effective prognostic biomarker for SIRS patients.
Using a mouse sepsis model, we clearly demonstrated that plasma HRG decreased
markedly due to reduction of mRNA expression in the liver, degradation by thrombin,
and deposition on intravascular thrombi (10). Under such condition, a cascade of
responses including intravascular neutrophil extracellular traps (NETs) formation,
strong attachment of neutrophils to vascular endothelial cells, and immunothrombus
formation proceed, leading to acute respiratory distress syndrome (ARDS),
disseminated intravascular coagulation (DIC), and multiple organ failure (10). Thus, the
marked decrease in plasma HRG may have a direct causal relation with septic lethality.
In this study, we also developed sandwich ELISA to measure HRG levels using one
mAb to capture HRG, taking advantage of the high-affinity binding of HRG to Ni–NTA
(19). This method does not rely on different HRG epitopes and therefore does not
require the use of multiple antibodies. Using this ELISA, we determined that the median
HRG level in healthy volunteers was 63.00 (IQR, 51.53–66.21) µg/ml, in agreement
with published data showing that HRG levels are approximately 100 µg/ml in human
plasma and that they vary widely (6, 5). We therefore conclude that HRG ELISA
developed in this study is acceptable for clinical practice.
There are limitations to this study. First, our study was a single-center study and
included only 79 patients. However, to address this limitation, we initiated a multicenter
prospective study to validate the diagnostic and prognostic role of HRG levels. Second,
although we focused on sepsis, we studied 70 patients with SIRS, including only 20
who had the disease. Thus, it is unclear whether HRG would work to differentiate sepsis
survivaldue to limited numbers of individual analyzed here. Larger validation studies
focused on sepsis should be performed. Third, in this study, we used old definition of
sepsis (Sepsis-2) because we conducted this study from November 2012 through
November 2014. We should initiate another study with new definition for sepsis
(Sepsis-3) (20). Fourth, we only assessed the initial HRG level and we had no serial
data. Time-dependent changes in HRG levels would be more valuable and reflect
treatments such as steroids and renal replacement therapies. Further investigations about
serial values would be needed. Fifth, non-infective SIRS patients included many
postoperative patients. Postoperative condition is complicated because of the effects of
general anesthesia, surgical pain, or something associated with operation. These effects
might confuse a comparison between non-infective SIRS patients and septic patients.
Sixth, non-infective SIRS patients included many patients with cancer. Because HRG
levels may prevent tumor growth (21, 22, 5) and are significantly higher in patients with
breast cancer (23), the characteristics of these populations may have influenced our
data.
CONCLUSIONS
HRG levels of septic patients were significantly lower than those of non-infective
SIRS patients and HRG levels were significantly associated with mortality within the
SIRS population. Therefore, HRG may be superior to PCT and presepsin for assessing
severity of SIRS patients. Our results suggest that HRG serves as a novel biomarker for
diagnosing sepsis, evaluating severity of patients, and predicting patient outcomes. To
confirm our findings, larger validation studies are needed.
ACKNOWLEDGEMENTS
We thank Yuko Mihara (Department of Anesthesiology and Resuscitology, Okayama
University Graduate School of Medicine, Dentistry and Pharmaceutical Sciences,
Okayama, Japan) for her assistance as a study nurse, and Yuta Morioka (Department of
Pharmacology, Okayama University Graduate School of Medicine, Dentistry and
Pharmaceutical Sciences, Okayama, Japan) for his technical guidance.
REFERENCES
1. Russell J: Management of sepsis. N Engl J Med 2006; 355:1699-713.
2. Lever A, Mackenzie I: Sepsis: definition, epidemiology, and diagnosis. BMJ
2007; 335:879-83.
3. Henriquez-Camacho C, Losa J: Biomarkers for sepsis. Biomed Res Int 2014;
547818.
4. Pierrakos C, Vincent JL: Sepsis biomarkers: a review. Crit Care 2010;
14(1):R15.
5. Poon IKH, Patel KK, Davis DS, Parish CR, Hulett MD: Histidine-rich
glycoprotein: The Swiss Army knife of mammalian plasma. Blood 2011; 117:2093-101.
6. Blank M, Shoenfeld Y: Histidine-rich glycoprotein modulation of
immune/autoimmune, vascular, and coagulation systems. Clin Rev Allergy Immunol
2008; 34(3):307-12.
7. Shannon O, Rydengård V, Schmidtchen A, et al: Histidine-rich glycoprotein
promotes bacterial entrapment in clots and decreases mortality in a mouse model of
sepsis. Blood 2010; 116:2365-72.
8. Rydengård V, Shannon O, Lundqvist K, et al: Histidine-rich glycoprotein
protects from systemic Candida infection. PLoS Pathog 2008; 4:e1000116.
9. Priebatsch KM, Kvansakul M, Poon IK and Hulett MD: Functional Regulation
of the Plasma Protein Histidine-Rich Glycoprotein by Zn2+ in Settings of Tissue Injury.
Biomolecules 2017; 7:E22.
10. Wake H, Mori S, Liu K, et al: Histidine-rich glycoprotein prevents septic
lethality through regulation of immunothrombosis and inflammation. EBioMedcine
2016; 9:180-194
11. Centre C, Vandenbroucke JP: Strengthening the reporting of observational
studies in epidemiology (STROBE) statement: guidelines for reporting observational
studies. BMJ 2007; 335:806-8.
12. Levy MM, Fink MP, Marshall JC, et al: 2001 SCCM/ESICM/ACCP/ATS/SIS
International Sepsis Definitions Conference. Crit Care Med 2003; 31:1250-6.
13. Dellinger RP, Levy MM, Rhodes A, et al. Surviving Sepsis Campaign:
International guidelines for management of severe sepsis and septic shock: 2012. Crit
Care Med 2013; 41:580-637.
14. Lijnen HR, Jacobs G, Collen D: Histidine-rich glycoprotein in a normal and a
clinical population. Thromb Res 1981; 22:519-23.
15. Morgan WT: Serum histidine-rich glycoprotein levels are decreased in acquired
immune deficiency syndrome and by steroid therapy. Biochem Med Metab Biol 1986;
36:210-3.
16. Bolin M, Åkerud P, Hansson A, Åkerud H: Histidine-rich glycoprotein as an
early biomarker of preeclampsia. Am J Hypertens 2011; 24:496-501.
17. Saigo K, Yoshida A, Ryo R, Yamaguchi N, Leung LLK: Histidine-rich
glycopprotein as a negative acute phase reactant. Am J Hematol 1990; 34:149-50.
18. Carr JA: Procalcitonin-guided antibiotic therapy for septic patients in the
surgical intensive care unit. J Intensive Care 2015; 3(1):36.
19. Mori S, Takahashi HK, Yamaoka K, et al: High affinity binding of serum
histidine-rich glycoprotein to nickel-nitrilotriacetic acid: The application to
microquantification. Life Sci 2003; 73:93-102.
20. Singer M, Deutschman CS, Seymour CW, et al: The Third International
Consensus Definitions for Sepsis and Septic Shock (Sepsis-3). JAMA 2016;
315(8):801-10.
21. Johnson LDS, Goubran HA, Kotb RR: Histidine Rich glycoprotein and cancer:
a multi-faceted relationship. Anticancer Res 2014; 604:593-603.
22. Cedervall J, Zhang Y, Ringvall M, et al: HRG regulates tumor progression,
epithelial to mesenchymal transition and metastasis via platelet-induced signaling in the
pre-tumorigenic microenvironment. Angiogenesis 2013; 16:889-902.
23. Matboli M, Eissa S, Said H: Evaluation of histidine-rich glycoprotein tissue
RNA and serum protein as novel markers for breast cancer. Med Oncol 2014; 31:897.
FIGURE LEGENDS
Fig 1. Receiver-operating characteristic (ROC) curve analysis for detecting sepsis ROC curves of HRG, PCT, and presepsin. The area under the curve (AUC) in ROC
curve analysis for HRG was 0.97. AUC for HRG was higher than that of PCT (0.82, p =
0.0018) and presepsin (0.77, p = 0.0012).
Fig 2. Kaplan-Meier survival curves
Patients were divided into higher HRG and lower HRG groups according to the cutoff
level of 16.0 µg/ml. At the cutoff level of 16.0 µg/ml, the sensitivity and specificity of
HRG levels associated with mortality were 0.87 and 0.79, respectively.
Supplementary Fig 1. Linearity of enzyme-linked immunosorbent assay (ELISA) Typical data of standard curve were shown.
Supplementary Fig 2. SDS-PAGE and western blotting pattern of purified human HRG
Purified HRG was electrophoresed and the gels were stained by Coomassie Brilliant
Blue (CBB). HRG band was detected by western blotting method with rabbit
anti-human HRG polyclonal antibody (made in-house). CBB denote Coomassie
Brilliant Blue. WB denote Western Blotting.
Supplementary Fig 3. Plasma levels of each marker
(A) Plasma levels of HRG. We compared 4 groups of healthy volunteers, non-SIRS,
non-infective SIRS, and sepsis. There were significant differences between groups of
non-SIRS and sepsis, and non-infective SIRS and sepsis. (B) Plasma levels for each
marker used to compare patients with and without infection (sepsis and non-infective
SIRS) within SIRS population. (C) Plasma levels for each marker used to compare
survivors and non-survivors within SIRS population. A box-and-whisker plot showing
median, 25th, and 75th percentiles. The bars represent the 5th and 95th percentiles. A
triangle and open square show outlier. * P < .05. *** P < .001.
1 - Specificity
Sensitivity
0.0 0.2 0.4 0.6 0.8 1.0 0.8
0.6
0.4
0.2
0.0
Logrank test P < .001
Higher HRG group Lower HRG group
Days
Survival rate
1.0
0.8
0.6
0.4
0.2
0.0
0 20 40 60 80
0 0.102 0.125 0.074
0.100
0.3 0.319 0.302 0.260
0.294
0.6 0.517 0.522 0.469
0.503
1.0 0.737 0.718 0.669
0.708
1.3 0.887 0.932 0.819
0.879
1.6 1.030 1.053 0.948
1.010 HRG concentration ( μg/mL )
Optical Density
60
40
20
0
Healthy Non-SIRS Non-infective Sepsis volunteers SIRS
HRG (μg/mL )
(B)
(C)
Survivor Non-survivor Survivor Non-survivor Survivor Non-survivor
HRG (μg/mL ) Procalcitonin ( ng/mL ) Presepsin ( pg/mL )
HRG (μg/mL ) Procalcitonin ( ng/mL ) Presepsin ( pg/mL )
Non-infective Sepsis SIRS
Non-infective Sepsis SIRS
Non-infective Sepsis SIRS
80
60
40
20
0
1000
100
10
1.0
.1
.01
10000
1000
100
10
80
60
40
20
0
1000
100
10
1.0
.1
.01
10000
1000
100
10
***
***
*** ***
***
***
Expressed as median (IQR).
Variable Healthy
volunteers
Non-SIRS patients
SIRS Patients
Total Non-infective SIRS Sepsis N
Age, years Male sex ICU death 28-day death 90-day death ICU stay, days Severity of disease
APACHE II score SOFA score Severe Sepsis Septic Shock
16 31.5 (25.7-35.7)
12 (75%)
9 68.0 (66.0-72.5)
6 (66.7%) 0 0 0 5 (3.5-6.5)
13.0 (10.5-15.5) 1 (0-2)
0 0
70 67 (62-76) 52 (74.2%) 8 (11%) 5 (7.1%) 8 (11%)
6 (4-9)
15 (12.7-18.2) 3 (2-5) 9 (13%) 8 (11%)
50 66.5 (62.7-74.5)
39 (78%) 0 0 0 6 (4-7.2)
14 (12-16) 2 (2-4)
0 0
20 68 (60.5-77)
13 (65%) 8 (40%) 5 (25%) 8 (40%) 14 (6.25-26.5)
19.5 (17.2-28.5) 8 (5.2-12)
9 (45%) 8 (40%) Medical patients
Pneumonia Renal failure Hepatic failure Pancreatitis Brain infarction
Ileus Others
0 0 0 0 0 0 0 0
16 (23%) 6 3 1 1 1 1 3
1 (2%) 0 0 0 0 1 0 0
15 (75%) 6 3 1 1 0 1 3 Surgical patients
Abdominal Esophageal Laryngeal Hepatic Others
9 1 4 3 0 1
54 (77%) 8 21 18 2 5
49 (98%) 3 21 18 2 5
5 (25%) 5 0 0 0 0 Ventilation days
Vasopressors Blood Purification
1 (1-1) 0 0
1 (0-1) 10 (14%)
7 (10%)
1 (1-1) 2 (4.0%)
0
0 (0-7.5) 8 (40%) 7 (35%)
Corticosteroids 0 9 (13%) 1 (2.0%) 8 (40%)
Table 2. Associations between each marker and mortality
HR denotes hazard ratio. Adjusted HR denotes hazard ratio adjusted according to Acute Physiology
and Chronic Evaluation (APACHE) II score.
Variable Univariate analysis Adjusted with APACHE II score
HR (95%C.I.) P Harrell C-index Adjusted HR
(95%C.I.)
P
HRG PCT Presepsin
0.88 (0.80 to 0.98) 0.97 (0.84 to 1.13) 1.03 (1.01 to 1.05)
< .001 .76 .0040
0.85 0.65 0.87
0.89 (0.78 to 0.97)
0.99 (0.99 to 1.00)
.0053
.49
Supplementary Table 1. Patient characteristics Expressed as median (IQR).
Variable SIRS Patients
Total N=70
Non-infective SIRS N=50
Sepsis N=20
P
Biochemical data (ICU Day 1) WBC ( /L) Ht (%)
Plt (*10000/L) CRP (mg/dL) BUN (mg/dL)
Cr (mg/dL) Bil (mg/dL) AST (U/L)
Total Protein (g/dL) ALB (g/dL) Lac (mmol/L) Fbg (mg/dL)
8380 (5455-12280) 29.6 (27.0-33.4) 15.9 (10.2-22.5) 6.46 (4.38-11.5) 14.7 (10.8-18.8) 0.78 (0.59-1.04) 0.89 (0.56-1.33) 32.0 (20.0-61.5) 4.5 (4.1-4.8) 2.5 (2.1-2.8) 2.1 (1.2-2.9) 450 (308-525)
8380 (5500-11460) 30.3 (27.5-33.5) 17.3 (12.9-23.0) 5.94 (4.28-7.65) 12.7 (10.3-16.1) 0.73 (0.58-0.90) 0.82 (0.54-1.15) 31.5 (21.7-60.0) 4.4 (4.0-4.6) 2.5 (2.1-2.8) 2.1 (1.7-2.7) 437 (297-491)
8430 (2680-14610) 28.5 (23.7-33.1) 8.65 (5.10-15.2) 17.1 (9.59-21.3) 33 (13.6-38.4) 1.27 (0.73-2.73) 1.37 (0.61-2.12) 41.0 (16.7-61.7) 4.7 (4.1-5.6) 2.5 (2.1-2.8) 2.0 (1.6-5.2) 525 (367-582)
.78 .024
< .001
< .001
< .001
< .001 .0029 .18 .0059
.67 .0055
.010
Supplementary Table 2. Significance of HRG for predicting mortality PPV and NPM denote positive and negative predictive values, respectively.
Cut off values (µg/mL)
Sensitivity Specificity PPV NPV
5.0 10.0 15.0 16.0 20.0 25.0 30.0
0.38 0.50 0.75 0.88 0.88 0.88 1.00
1.00 0.87 0.85 0.79 0.71 0.68 0.52
1.00 0.33 0.40 0.35 0.28 0.30 0.21
0.91 0.93 0.96 0.98 0.98 0.98 1.00
Supplementary Table 3. Correlations between HRG and other parameters
ρ denote Spearman's rank correlation coefficient.
Variable ρ P
WBC CRP PCT Presepsin SOFA score APACHE II score
0.025 –0.46 –0.56 –0.33 –0.51 –0.38
0.84
<.001 0.22 0.0060
<.001 .0010