1
Working Paper Series
No.48
Estimates of inpatient costs for preterm and low-birthweight infants in Japan:
An exploratory study using
the National Database of Health Insurance Claims
Ruoyan Gai, Hidetoshi Mezawa
April 2021
Hibiya Kokusai Building 6F, 2-2-3 Uchisaiwaicyo, Chiyoda-ku, Tokyo 100-0011 http://www.ipss.go.jp
2
The views expressed herein are those of the authors and not necessarily those of the National Institute of Population and Social Security Research, Japan.
1
Estimates of inpatient costs for preterm and low-birthweight infants in Japan:
An exploratory study using the National Database of Health Insurance Claims
Ruoyan Gai
1, Hidetoshi Mezawa
21. National Institute of Population and Social Security Research 2. National Center for Child Health and Development
Introduction
Preterm birth is a public health problem resulting from intertwining of physical, environmental and social factors. It often leads to low-birthweight, causing short-term and long-term adverse health outcomes. In Japan, population-based studies have indicated trends of decreasing birthweight and increasing prevalence of low-birthweight in past decades, which may be attributable to increases in preterm deliveries and multiple gestations and changing patterns in young women’s anthropometric characteristics, lifestyle, and nutritional status
1. Recent evidence suggests profound short-term and long- term consequences of preterm and low-birthweight at both individual and societal level
2,3
. The care of preterm and low-birthweight infants requires extensive healthcare resources, including impatient costs at birth
4-6.
Despite of the risks and disease burdens associated with preterm and low- birthweight, the relevant data on the related costs for the healthcare utilization are of lack in Japan. In this regarding, the national-wide health insurance claim database contains valuable information regarding clinical practices and associated costs throughout the whole process of hospitalization. In this study, we aim to estimate unit impatient costs per case per hospitalization for preterm and low birthweight infants in Japan by employing a sampling dataset of the National Health Insurance Database (NDB).
Methods
Overview of study design
The NDB, containing almost all healthcare insurance claims in the country, has
been developed by the Ministry of Health, Labor and Welfare of Japan and opened for
research and policy making purposes. In this study, we applied a sampling dataset of NDB,
which comprises 10% of the overall inpatient medical claim data in January, April, July
and October in 2015. The target cases were preterm infants (with the gestational age < 37
2
weeks) who were hospitalized in hospitals registered in the Diagnosis Procedure Combination (DPC) payment scheme. The DPC payment scheme is the Japanese version of the Diagnosis Related Group (DRG) yet with much more detailed classifications, items, and adjustment conditions. There was a total of 2,873 DPC items covering 504 disease groups in 18 major diagnostic classifications (MDC) as of the fiscal year of 2014-2015.
It has been facilitating the digitalization of the claim data since its launch into the national health insurance system. The study identified a retrospective cohort of those preterm infants hospitalized for the related treatment and discharged at the end of the four months and estimated inpatient medical costs per time per case by their DPC admission data.
Data structure and data handling
The NDB data were extracted from five main sheets: literally the common information sheet (as coded “RE”), the patient’s basic information sheet (as coded “KK”), the DPC information sheet (as coded “BU”), the disease information sheet (as coded
“SB”), the clinical practice information sheet (as coded “SI”) and the adjusted cost tariff sheet (as coded “GT”). Those records were first extracted from the sampling dataset by using the anonymized individual identification codes. By screening and reviewing disease records and clinical practice records deriving from the SB sheet and the SI sheet, respectively, those records related to re-admission due to causes other than preterm / premature and incomplete inpatient data at the end of January, April, July and October were excluded. For each individual, the medical cost tariffs in each month were identified in the GT sheet and then added up for the entire duration of hospitalization. Those data from the different sheets were finally merged as per case per hospitalization by using the anonymized individual identification codes and the dates of admission and discharge.
Preterm case ascertainment
Preterm birth cases were defined by using disease codes related to preterm / premature birth utilized in the medical claim data system, namely 6441001 (natural preterm birth), 6441002 (imminent preterm birth), 7651002 (preterm baby), 8836663 (preterm-related neonatal jaundice), 8846723 (artificial preterm birth), and 8849670 (preterm birth posterior to the 28th week of pregnancy). Then, we excluded those who were suspected re-admission cases to be due to causes other than preterm / premature by DPC code and the clinical practice information.
Available total inpatient medical costs
3
The total inpatient medical costs were extracted from the adjusted cost tariff sheet and charged in the medical cost tariffs, the pricing scheme of the national health insurance system. They were converted into Japanese Yen (JPY) by the given ratio of 10 JPY per tariff point. We further excluded those who were still in hospital at the end of the month to order to acquire the full package of medical costs in each hospitalization.
Predictor variables
Independent variables to predict the total inpatient medical costs were extracted from the multiple claim sheets as mentioned above, including sex, the DPC classification code, length of stay, prognosis status at discharge, birth weight, receiving care in the Neonatal Intensive Care Unit (NICU) or not, and complication status. A DPC classification code consists of 14 digits, among which the first 6 digits signify the disease group (the first 2 digits for the MDC) and others indicate clinical characteristics and practices within the group. For patients with multiple disorders and symptoms, the DPC item for the most cost-consuming disease among others will be accounted in the payment claim. Regarding neonates born with the shortened gestational age (preterm) and / or low- birth weight, the DPC classification code starts with “140010”, followed by stratified birthweight into (1) normal birthweight (NBW, birthweight >=2,500g), (2) low birthweight (LBW, birthweight >=1500g and <2500g), 3) very low birthweight (VLBW, birthweight >=1000g and <1500g), and (4) extremely low birthweight (ELBW, birthweight <1000g), and consequent surgery status and clinical practices. Length of stay was calculated using the dates of admission and discharge in day and month. Prognosis status at discharge included 1. Recovered, 2. Alleviated, 3. Somehow alleviated, 4.
Unchanged, 5. Deteriorated, 6. Death due to the cause, 7. Death due to other causes, 9.
Other. By this record, a new binary variable for mortality at discharge were created.
Birthweight was recorded in the patient’s basic information sheet. NICU enrollment was identified with the clinical practice codes (193502010, 193502110, 193502210, 193508310, 193508410, 193508510) in the clinical practice information sheet.
Complications higher cost consumption were also considered in the analysis, including patent ductus arteriosus (PDA), necrotizing enterocolotis (NE), respiratory distress syndrome (RDS), chronic lung diseases (CLD), retinopathy of prematurity (RP) and neonatal sepsis (NS). NICU enrollment status and complication status were created as a binary variable showing the presence or absence of the condition.
Data analysis
4
The distribution of the inpatient medical costs and summary statistics were calculated. To predict the inpatient medical costs, a generalized linear model with a logarithmic link function and a gamma distribution was performed by adjusting sex, birthweight, length of stay, mortality at discharge, NICU enrollment status and complication status. All statistical analysis was performed employing Stata 15.0.
Results
Targeted cases identification flow
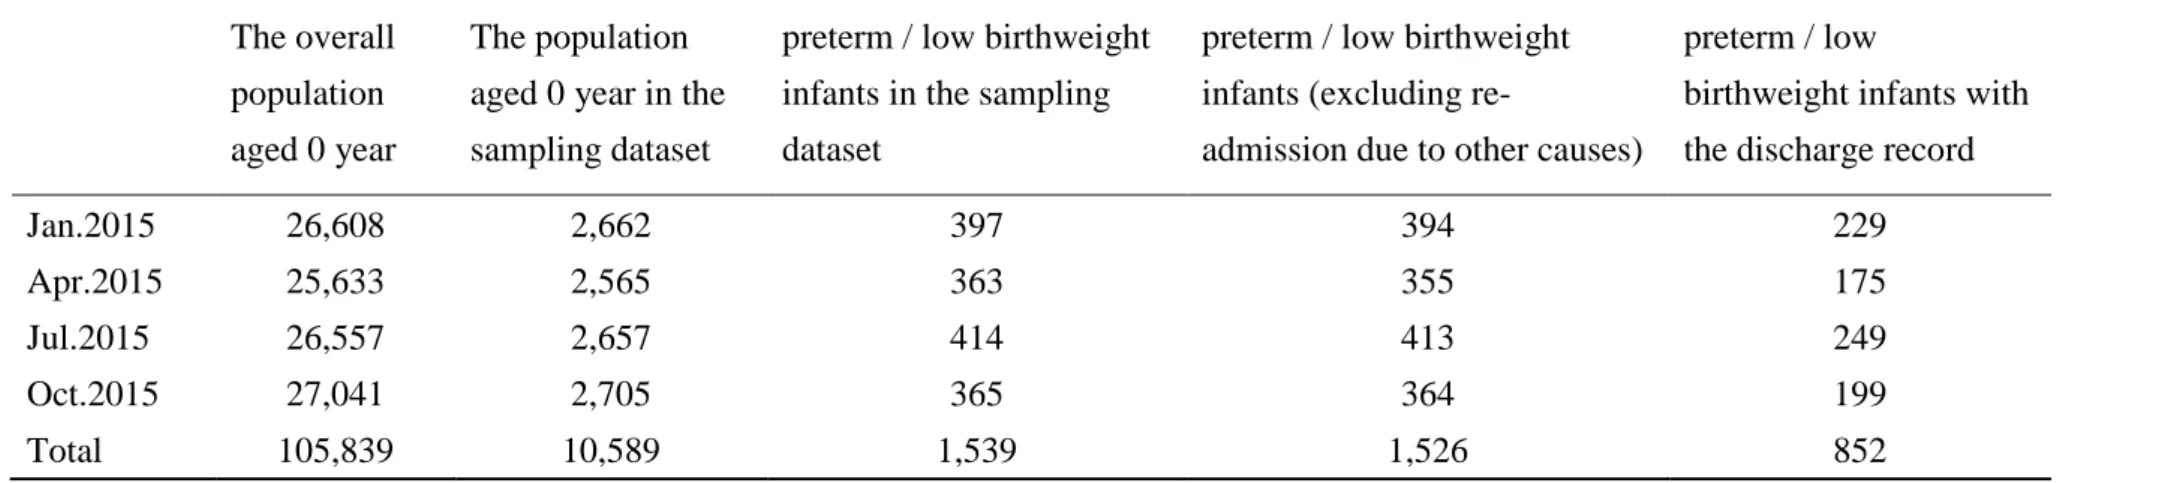
Table 1 summarized the numbers of the overall population and cases extracted at each step going toward exploring and fixing the target cases. The sampling dataset used in the study contained medical records of 10,589 infants (aged 0 year), which were randomly selected from the overall 105,839 counterparts in the four months with the selection ratio of 10%. By using disease codes related to preterm / premature birth utilized in the medical claim data system, we identified 1,539 preterm cases in the four months. Then, 13 re- admission cases suspected to be due to causes other than preterm / premature were excluded. In the remaining 1,526 cases, we further excluded 674 cases who were still in hospital at the end of the month. As the results, a total of 852 cases were finally determined for the analysis.
Basic information
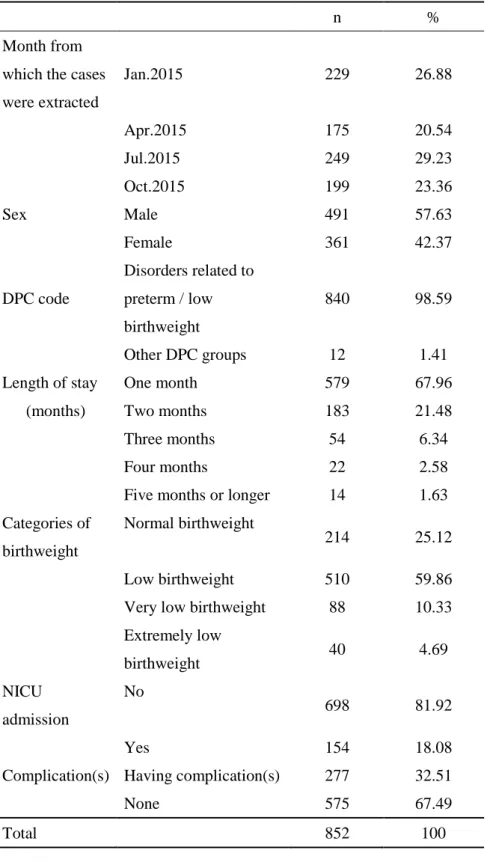
Table 2 summarized basic characteristics of 852 preterm infants hospitalized for the related treatment and discharged at the end of January, April, July and October 2015 as extracted from the sampling set. In the retrospective cohort, those whose DPC classification code starts with “140010” accounted for 98.59%. The average birthweight was 2032.3g (standard deviation: 558.2g), and 25.1%, 59.9%, 10.3%, and 4.7% were in the normal birthweight (birthweight >=2,500g), the low birthweight (birthweight
>=1500g and birthweight <2500g), the very low birthweight (birthweight >=1000g and birthweight <1500g) and the extremely low birthweight group (birthweight <1000g), respectively. In those infants, 18.1% admitted in NICU. The average length of hospitalization was 29.4 days (standard deviation: 27.9 days). At the point of discharge, there were 4 reported death cases. Those having one or more complications accounted for 32.5% of all cases.
Liner regression analyses and cost estimation
5
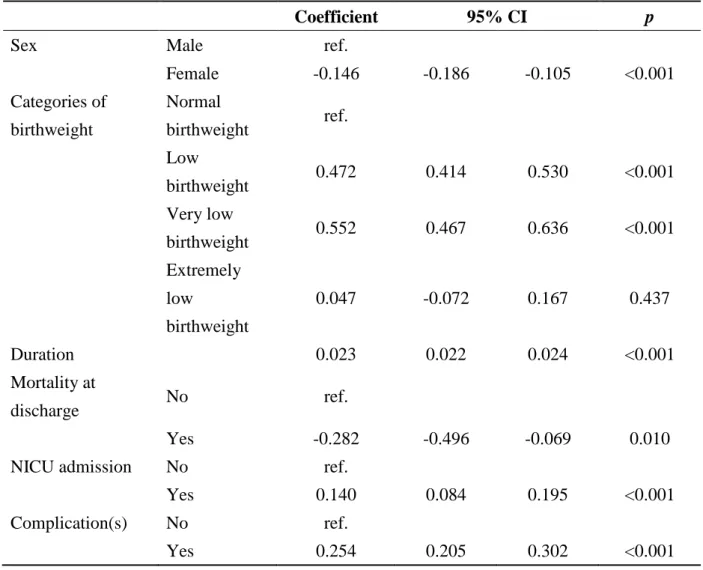
Table 3 indicated the results of generalized linear model after adjusting sex, severity of low birthweight, length of stay, mortality at discharge, NICU admission and complication status. Compared to the male, female infants tended to cost less. Length of stay, NICU admission and having complication(s) were associated higher costs.
Regarding birthweight, compared to the normal birthweight group, those born with low and very low birthweight costed higher.
The model predicted inpatient costs on the whole and by severity of low birthweight and by complications. The inpatient costs were 1,558,835 JPY (95% CI: 1,496,989 JPY - 1,620,682 JPY) in the overall extracted cases, and 1,223,289 JPY (95% CI: 1,092,713 JPY - 1,353,865 JPY), 1,961,642 JPY (95% CI: 1,796,287 JPY – 2,126,996 JPY), 2,124,460 JPY (95% CI: 1,977,519 JPY – 2,271,402 JPY) and 1,282,582 JPY (95% CI:
1,210,163 JPY – 1,355,001 JPY) in NBW, LBW, VLBW and ELBW group, respectively.
Compared to 1,274,238 JPY (1,202,835 JPY – 1,345,641 JPY) in those with no complication, the average inpatient costs were 1,641,991 JPY (95% CI: 1,579,035 JPY - 1,704,947 JPY) in infant cases having one or more complications, and the average predicted costs in those with PDA, RDS, CLD, RP and NS were 3,599,501 JPY (SD:
4,341,212 JPY), 4,871,441 JPY (SD: 1,849,264 JPY), 3,168,368 JPY (SD: 3,489,101 JPY), 2,588,362 JPY (SD: 2,765,505 JPY), and 1,867,910 JPY (SD: 2,263,828 JPY), respectively.
Discussions
To our knowledge, this is the first study investigating impatient costs during the birth hospitalization for preterm and low birthweight infants by employing NDB in Japan.
We generated the unit impatient costs as per case per hospitalization and compared that in different groups in terms of birthweight and complications. The results suggested that the cost increases with decreasing birthweight, increasing length of hospital stay and admitting NICU and having complications, in general consistent with previous findings
6,7
. On the other hand, a significant increase of impatient costs in the ELBW group was not identified in the analysis, which could be partly explained by the relevantly higher incidence of mortality resulting in shortened hospital stay. Complications, in particular PDA, RDS, CLD, and RP, caused even 3 folds higher impatient costs during the birth hospitalization compared to the average level of the whole cohort.
Our analysis provided fundamental figures to capture economic burden of preterm
and low birthweight in Japan. By using the unit impatient costs per case per
hospitalization and other epidemiological data generated from literature review, including
6
incidence and / or prevalence of preterm and relative ratio / odds ratio of a specific risk factor contributing to the disease burden, it is able to estimate the overall medical costs of preterm as well as that caused by the specific environmental and social risk factors. It is worthy to note that in interpreting these major results for the estimates of the economic burden, several issues should be carefully considered. First, due to the data source limitation, this analysis only focused on the impatient costs during the birth hospitalization and failed to track the cohort for a long time as continuous treatment records in subsequent hospitalizations could not be identified in the sampling dataset with the intervals. Moreover, the NDB dataset contain neither non-medical costs such as that for foods and transport nor indirect costs which generally refer to productivity loss of the individual with illness and their caregivers. These two issues may lead to an underestimate of the economic burden due to preterm and low-birth weight. On the other hand, there are also strengths in applying the result to estimate the economic burden.
Compared to literature review, the large-scale high-quality population-based data
warranted reliability and generalization of the results, which authentically reflected the
real-world clinical practice in the country as well. In future, an updated analysis by using
the latest full package of NDB dataset is necessary to further explore the subsequent
medical costs and health outcomes of preterm and low-birthweight infants in long-term.
7
References
1. Takemoto Y, Ota E, Yoneoka D, et al. Japanese secular trends in birthweight and the prevalence of low birthweight infants during the last three decades: A population- based study. Scientific Reports. 2016; 6: 31396.
2. Slattery MM, Morrison JJ. Preterm delivery. Lancet. 2002; 360: 1489–97.
3. Khan KA, Petrou S, Dritsaki M, et al. Economic costs associated with moderate and late preterm birth: a prospective population-based study. BJOG. 2015;122:1495–505.
4. Petrou S, Eddama O, Mangham L. A structured review of the recent literature on the economic consequences of preterm birth. Arch Dis Child Fetal Neonatal Ed. 2010.
doi:10.1136/adc.2009.161117.
5. Gilbert WM, Nesbitt TS, Danielsen B. The cost of prematurity: quantification by gestational age and birth weight. Obstetrics Gynecol. 2003;102(3):488–92.
6. Cavallo MC, Gugiatti A, Fattore G, et al. Cost of care and social consequences of very low birth weight infants without premature-related morbidities in Italy. Italian Journal of Pediatrics. 2015; 41: 59.
7. Rudiger M, Heinrich L, Arnold K, et al. Impact of birthweight on health-care utilization during early childhood – A birth cohort study. BMC Pediatrics. 2019; 19:
69.
8
Table 1. Identification of the target cases from the sampling dataset
The overall population aged 0 year
The population aged 0 year in the sampling dataset
preterm / low birthweight infants in the sampling dataset
preterm / low birthweight infants (excluding re-
admission due to other causes)
preterm / low
birthweight infants with the discharge record
Jan.2015 26,608 2,662 397 394 229
Apr.2015 25,633 2,565 363 355 175
Jul.2015 26,557 2,657 414 413 249
Oct.2015 27,041 2,705 365 364 199
Total 105,839 10,589 1,539 1,526 852
9
Table 2. Basic characteristics of the extracted cases
n %
Month from which the cases were extracted
Jan.2015 229 26.88
Apr.2015 175 20.54
Jul.2015 249 29.23
Oct.2015 199 23.36
Sex Male 491 57.63
Female 361 42.37
DPC code
Disorders related to preterm / low birthweight
840 98.59
Other DPC groups 12 1.41
Length of stay One month 579 67.96
(months) Two months 183 21.48
Three months 54 6.34
Four months 22 2.58
Five months or longer 14 1.63 Categories of
birthweight
Normal birthweight
214 25.12
Low birthweight 510 59.86
Very low birthweight 88 10.33 Extremely low
birthweight 40 4.69
NICU admission
No 698 81.92
Yes 154 18.08
Complication(s) Having complication(s) 277 32.51
None 575 67.49
Total 852 100
10