Native and Non-native Interpretations of a Co-verbal Facial Gesture in Japanese Conversation: An Experimental Study
発話に伴う顔の表情の捉え方に関する実験的研究
―日本語母語話者と非母語話者の比較―
李 イニッド
Waiching Enid Mok
要旨
近年、対人コミュニケーションの研究は、言語と非言語を含めたマルチ・チャネル的アプ ローチによる研究が進展しつつあり、メッセージの記号化と解読プロセスの解明には、社会 文化的要素についても考慮する必要性が指摘されている。本稿では、日本語の会話における 発話に伴うある顔の表情について日本人母語話者と非母語話者の捉え方を考察し、発話者の 感情と言語メッセージの理解に違いの有無を調査することを目的とする。研究方法として日 本人6名のビデオ映像を用いた実験を行い、設定した質問に対する母語話者と非母語話者の 被験者計41名による解答を比較分析した。実験は映像のみ提示、音声のみ提示、映像及び音 声提示という3種類の異なった条件の下に行った。実験より得られたデータの量的・質的分 析した結果は第2言語教育及び学習者のアセスメントに対して大きな示唆を与えるのである。
Abstract
The present study compared native and non-native interpretations of the co-verbal smiles in Japanese conversation and accuracy of decoding the speakers ’ emotions and verbal content. An experiment was carried out in which six video clips were presented to the participants (N= 41 ) under three different conditions: ( 1 ) visual input only, ( 2 ) auditory input only, and ( 3 ) both visual and auditory input. The results showed significant differences on various measures and comparisons of the two groups. It was found that native and non-native speakers derived different information from the same facial gesture, resulting in contradictory interpretations of the speakers ’ verbal content.
Implications and suggestions for second language pedagogy and assessment were discussed.
1. Introduction
All researchers in the field of human communication agree that communicative behavior is
multimodal in nature. In order to objectively represent its reality and gain insights into its complexity,
we need to consider the many different aspects of communication from various theoretical and research
perspectives (Müller et al., 2013 ). Studies focusing on face-to-face interpersonal communication have
suggested that nonverbal signals are likely to be more genuine than verbal messages because they
primarily express inner feelings and cannot be controlled as easily as speech. As Hall ( 1977 ) points
out, “ The body’s messages seldom lie, and come much closer to what the person’s true but sometimes
unconscious feelings are than does the spoken word ” (p. 71 ). Arndt and Janney ( 1987 ) noted that
when there is inconsistency between verbal and nonverbal behaviors, it is only natural that people
would try to understand the former in terms of the latter “ using nonverbal behavior as a sort of check
on the validity, dependability or sincerity of the verbal message ” (p. 369 ). The problem is nonverbal
behavior is not always interpretable across cultures. Even if it is, it may operate under different rules
and thus be interpreted in different ways. Developmental research has suggested that children learn
their cultural rules governing nonverbal behaviors in the same way as they learn the rules of their
mother tongue (Von-Raffler Engel, 1981 ). The rules that govern how people in a specific culture manage and modify universal emotional expressions such as anger, contempt, sadness and happiness are called “ cultural display rules ” (Ekman & Friesen, 1969 ). These rules are learned early on and are an important part of the socialization and enculturation process (Saarni, 1979 ). The inevitable result of these display rules is unique, culture-specific ways in which communication, verbal and nonverbal, is encoded and decoded. Matsumoto and Yoo ( 2005 ) summarize this concept as follows:
“… decoding rules and their associated emotions and value judgments form the basis of the
‘ filters ’ that we use in seeing the world. As we become more enculturated, we add more layers to those filters. These filters are like lenses that allow us to perceive the world in a certain way. By the time we are adults, we share the same filters with others in our cultural group. They become part of our self, inseparable and invisible, and are a normal part of our psychological composition because of the way we have enculturated. ” (p. 262 )
Under these circumstances, misinterpretation will likely arise if one is not successfully enculturated into the target discourse community or adequately informed about its rules.
2. The Present Study
There is extensive research on the cross-cultural differences in facial expressions and emotions. On the other hand, few studies have examined non-native speakers ’ receptive competence (i.e., ability to decode and understand) in relation to these two variables during face-to-face interactions with native speakers. This paper, which is based on an experimental study, is an attempt to demonstrate that for non-native speakers, the information derived from visual input may sometimes hinder rather than facilitate comprehension (and communication). Discussion focuses on the effect of co-speech smiles by Japanese native speakers on the accuracy of native and non-native listeners ’ comprehension of the speaker’s verbal messages.
Many scholars have mentioned that smiling in Japanese culture has culture-specific meanings (e.g. Richmond et al., 2011 ). Ekman ( 1972 ) observes that apparent differences in particular facial expressions between the Japanese and Americans are the result of the Japanese people’s suppressing public displays of emotions. Their use of smiling to hide negative emotions is referred to as “ a smiling mask ” (Ekman & Friesen, 1982 ). Klopf ( 1998 , p. 88 ) writes, “ Children are taught in Japan to smile as a social duty even in case of sorrowful circumstances. Rather than show sorrow, cultural ritual requires the smile. ” Matsumoto ( 1996 ) provides a detailed explanation for that:
“ The special place of the smile in the Japanese culture is related to the Japanese culture’s
emphasis on collectiveness and status differentiation. In Japan, the uninhibited expression
of inappropriate emotions toward others can violate cultural norms dictating the suppression of these emotions. If these emotions are expressed, they can threaten either interpersonal relationships or the preservation of status differences. Smiling serves to maintain relationships, or to subordinate oneself to others of higher status. … When smiles are used in this fashion, they become signs of something other than true joy, or happiness, or positive emotion. Accordingly, Japanese people learn that the smile does not necessarily mean that one is happy [emphasis added]. ” (pp. 108 - 109 )
As suggested in the above quote, the Japanese smile must be decoded in the context of internalized norms of cultural rituals. According to McNeill et al. ( 1994 ), the listener normally attends to both speech and gesture and unifies them into one single system. They write, “ This is part of an interaction of image and word involved in linguistic processes in general, and it is done without the necessity of conscious attention; the two channels smoothly combine into a single idea unit ” (p. 235 ). They found in an experiment with artificial mismatches between gesture and speech that this is still what happened and concluded that “ the combining of gestures with language is a part of the process of communication both in production and in comprehension ” (p. 236 ). It is not hard to imagine, therefore, that if a gesture, such as the speech-accompanying smile, is seen as something that doesn’t match the speech the listener will have difficulty decoding them in unity.
3. Research Question and Hypothesis
This study aimed to answer a very simple question: Do native speakers (NSs) and non-native speakers (NNSs) derive different information/meanings from the same smiles that co-occur with the speech of Japanese NSs? If yes, in what ways do they differ? And to what extent does that affect comprehension of the verbal message? Drawing on McNeill et al.’s ( 1994 ) gesture-speech integration theory in comprehension and production and the particular function of the smile in Japanese communication, we predict that the co-speech smiles by Japanese are likely to be misinterpreted by NNSs as an expression of happiness or satisfaction. In other words, apparently contradictory visual and verbal cues of NSs are likely to negatively affect comprehension.
4. Methodology 4.1 Participants
The study involved 41 students currently enrolled at a Japanese university. They were divided into
two groups: a control group and an experimental group. The control group consisted of 21 native
speakers of Japanese, 6 males and 15 females between the age of 19 and 24 . All of them were born
and raised in Japan. The participants in the experimental group were 20 non-native speakers of
Japanese, 9 males and 11 females aged between 20 and 24 . The non-native participants were all born
and raised outside of Japan and none of them were ethnic Japanese. They arrived in Japan at the age of 17 - 22 . Their native languages were Korean (N= 2 ), French ( 3 ), Cantonese (Macau) ( 4 ), Mandarin (Taiwan) ( 5 ), and Mandarin (Fujian/Fuzhou, China) ( 6 ). At the time the experiments were carried out, the experimental group participants were studying Japanese and/or other subjects at a university in Japan. They had studied Japanese for 1 . 2 - 6 . 6 years. Their proficiency levels ranged from beginner- intermediate to advanced.
4.2 Materials and Procedure
All the participants took part in an experiment in groups of 2 - 4 . The experiment made use of video clips of six native speakers of Japanese ( 3 males and 3 females) ranging in age from 20 to 80 . The length of the video clips was between 3 to 10 seconds (M= 6 . 5 ). All of the speakers were interviewed on the street by TV reporters. Their style of speech and nonverbal behavior represent those commonly found in Japanese adults. As shown in Figures 1 a- 6 b
1, even though none of the speakers were talking about anything that made them feel happy or excited, they were all smiling.
Figures 1 a, 1 b. A young man feeling tired and painful after walking for hours in the mountain.
Figures 2 a, 2 b. An elderly woman complaining about the inconveniences of living in a remote village with an aging population and expressing her anxiety and fears about her future life.
1 a
2 a
1 b
2 b
Figures 3 a, 3 b. A middle-aged woman feeling disappointed and sad about the poor records of Japanese athletes.
Figures 4 a, 4 b. A job-hunting young man worrying about his future.
Figures 5 a, 5 b. A young man who has recently installed an ETC card reader in his car showing anger over the government’s new decision to make all highways toll-free.
4 a
5 a 3 a
4 b
5 b
3 b
Figures 6 a, 6 b. A young woman giving up hope on boarding her flight after waiting for hours at the airport.
For example, a 20 -year-old man (shown in Figures 1 a and 1 b) was interviewed after walking for many hours in the mountain. He told the reporter that it was rather tough and his feet were killing him. He started smiling slightly before he uttered the first word and his smile continued even after he finished talking.
Transcript 1
2Speaker # 1 a young man in his 20 s 00 : 00 : 02 : 00 (
し) 00 : 00 : 00 : 16 (-)
s---
若い男性:しんどいです。Young man: Uh, it’s killing me.
レポーター:
どのへんがしんどいですか?
TV Reporter: What’s killing you?
00 : 00 : 21 : 18 (-) ---
00 : 00 : 19 : 00 (-) 00 : 00 : 19 : 27 (-)
n
00 : 00 : 17 : 25 (
で)
若い男性:自分もう足とかパンパンで(
M:
歩きながら)Young man: My feet are all hard and swollen.
(M: walking)
6 a 6 b
Another example is a young woman in her 20 s (shown in Figures 6 a and 6 b). Feeling exhausted after waiting for hours at the airport, she was disappointed that she could not get on her scheduled flight because it had been cancelled due to volcanic ash. The woman started smiling the moment she started speaking and her smile continued even after she stopped speaking.
Transcript 2
Speaker # 6
a young woman in her 20 s
00 : 05 : 45 : 06 (
も)
00 : 05 : 55 : 14 (-) S--- N1 00 : 05 : 48 : 02 (
す) H 00 : 05 : 50 : 03 (-) N2 00 : 05 : 53 : 12 (
す) N3 00 : 05 : 54 : 27 (-)
00 : 05 : 49 : 04 (
ね)
00 : 05 : 51 : 11 (
あ)
00: 05 : 54 : 09 (-)
00 : 05 : 55 : 14 (-)
N 1 ---
(H---:
首をかしげる)
N 2 -- N 3 --
若い女性:
もう全然進まないですしね(H)
ちょっとあきらめてます。00
: 05 : 50 : 17 (
ち)
00: 05 : 53 : 12 (
す)
Young woman: We’re not moving at all. (H) I feel like giving up.
(H---: moving her head to one side)
The experiment consisted of three tests, each representing a different condition under which the same video clips were presented to the participants. During each test, the video clips (a-f) were presented in a different order.
Condition # 1 (Test # 1 ): visual input only
Condition # 2 (Test # 2 ): auditory input only
Condition # 3 (Test # 3 ): both visual and auditory input (full channel)
Under the first condition, participants were provided with visual input (i.e., face) only. They saw only the upper part of the speakers ’ bodies but did not hear any sound. Under the second condition, only auditory input was provided. The participants heard the speakers ’ voices but did not see their faces or any other part of their bodies. The third condition allowed the participants to receive both visual and auditory input so that they could see the speakers ’ faces and hear their voices at the same time. Based on the limited information given under each condition, the participants were asked the same two questions about each one of the six Japanese native speakers appearing in the video clips:
Question # 1 : What is this person talking about?
(i.e., to decode the speaker’s verbal message) Question # 2 : How does he/she feel?
(i.e., to decode the speaker’s emotional state)
The first question was to be answered in an open-ended response format whereas seven answer
choices (A-G) were provided for Q 2 . Multiple answers were allowed for the second question (See Appendices I-IV).
Participants were told that the purpose of the study was to find out how much they could understand the speakers in the videos, and then they were asked to sign a statement giving their consent to take part in the study. Instructions were given orally before the experiment and care was taken to ensure that participants had sufficient time to answer the questions.
In order to minimize the carryover effects of learning from previous tests, the same six videos were presented to different participants in different orders under the aforementioned conditions.
The participants wrote their answers on an answer sheet which was written in Japanese, English or Chinese (both simplified and traditional characters). They could choose to answer in any one of the three languages, or if they preferred, answer in their native language and provide a translation later.
The entire experiment lasted for approximately 20 - 25 minutes for each group. The collected data were analyzed using two-tailed t-tests and ANOVA.
5. Results and Discussion
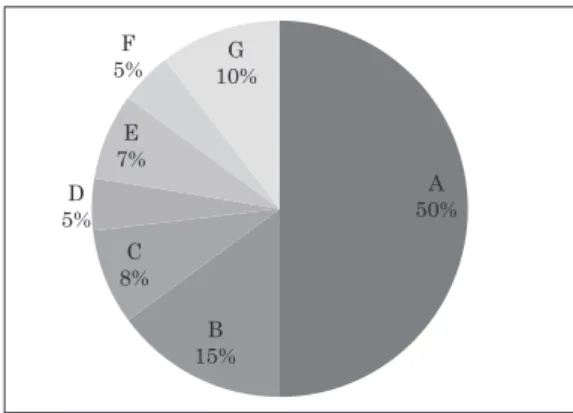
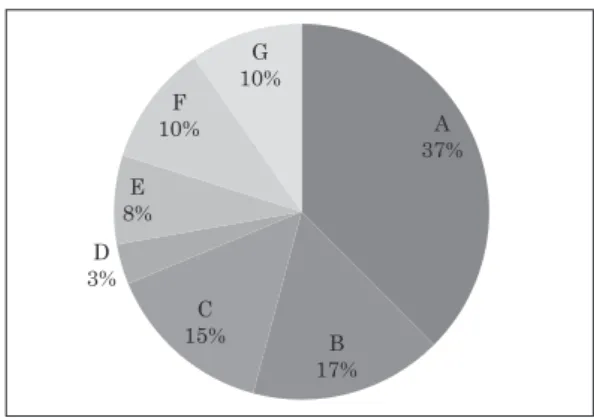
Figures 7 and 8 show the frequency distribution of responses (A-G) to the second question on Test
# 1 by the NS group and the NNS group, respectively. The data reveal that when only visual input was provided, A (i.e., happy/excited) was the most frequently selected response by both groups. It accounted for 50 % of the responses collected from the NNS group and 37 % from the NS group. This suggests that compared with the NSs, the NNSs showed a greater tendency to associate the Japanese speakers ’ co-verbal smiles with positive emotions. In addition, a comparison of the percentages of the other responses suggests that the NSs considered a wider variety of interpretations of the same facial gesture than the NNSs.
A happy/excited; B nervous/anxious; C disappointed/frustrated;
D sad/lonely; E angry/hostile; F tired/painful; G.
Figure 7 . Frequency distribution of responses to Test 1 Question 2 by the NNS group.
Figure 8 . Frequency distribution of responses to Test 1 Question 2 by the NS group.
As shown in Tables 1 and 2 , both groups received a much higher score for both Q 1 and Q 2 on Tests
# 2 and # 3 than on Test # 1 . Statistical analysis of the results showed significant differences among the scores for both questions across the tests for both groups. It is worth noting that although the mean scores for both questions were the lowest on Test # 1 for both groups, the NS group scored higher on Test # 3 than on Test # 2 , whereas the exact opposite pattern was exhibited by the NNS group.
Table 3 shows that in the case of Q 1 , there were significant differences between the two groups on all of the three tests. This suggests that when it comes to decoding verbal messages, the NSs performed significantly better than NNSs, regardless of the kind of input and the amount of information available.
Table 1 . NNSs ’ and NSs ’ Q1 (content of message) scores across tests Test #1 Test #2 Test #3
NNS (N=20) M 0 . 1 2 . 9 2 . 8 *
SD 0 . 31 1 . 41 1 . 01
NS (N=21) M 0 . 67 4 . 23 5 **
SD 0 . 58 0 . 81 0 . 89
*significant at p< 0 . 0001 , F( 2 , 57 )= 3 . 16
**significant at p< 0 . 0001 , F( 2 , 60 )= 3 . 115
Table 2 . NNSs ’ and NSs ’ Q2 (emotional state) scores across tests Test #1 Test #2 Test #3
NNS (N=20) M 0 . 95 4 . 30 4 . 25 *
SD 0 . 83 1 . 26 1 . 52
NS (N=21) M 1 . 33 5 . 19 5 . 33 **
SD 1 . 06 0 . 68 0 . 91
*significant at p< 0 . 0001 , F( 2 , 57 )= 3 . 16
**significant at p< 0 . 0001 , F( 2 , 60 )= 3 . 115
As can be seen from Table 4 , in the case of Q 2 , significant differences were found between the two groups on Tests # 2 & # 3 (p< 0 . 01 ) but not on Test # 1 (p> 0 . 05 ). This suggests that although it was equally difficult for both groups to correctly decode the speakers ’ emotions based on visual input only, the NSs were significantly better than the NNSs at identifying the speakers ’ emotions when auditory input was the only input available and when both visual and auditory input were provided.
Participants in the NNS group were further divided into subgroups according to their Japanese proficiency level, length of study in Japanese, and length of residence in Japan for comparison of their scores for both Q 1 (Tables 5 - 7 ) and Q 2 (Tables 8 - 10 ). There were no statistically significant differences overall between the subgroups (p> 0 . 05 ). This suggests that the NNSs produced similar responses regardless of their L 2 proficiency, length of L 2 study, and length of residence in the target culture.
Table 3 . Comparison of Q1 scores across tests
NNS NS
Test #1 0 . 1 ±0 . 31 0 . 67 ±0 . 58 * Test #2 2 . 9 ±1 . 41 4 . 43 ±0 . 81 **
Test #3 2 . 8 ±1 . 01 5 ±0 . 89 ***
Note: Data represent M ± SD
*significant at p< 0 . 05 , two-tailed t-tests
**significant at p< 0 . 001 , two-tailed t-tests
***significant at p< 0 . 01 , two-tailed t-tests
Table 4 . Comparison of Q2 scores across tests
NNS NS
Test #1 0 . 95±0 . 83 1 . 33±1 . 06 Test #2 4 . 30±1 . 26 5 . 19±0 . 68 * Test #3 4 . 25±1 . 52 5 . 33±0 . 91 * Note: Data represent M ± SD
*significant at p< 0 . 01 , two-tailed t-tests
Table 5 . Comparison of NNSs ’ Q1 scores by proficiency level Proficiency level
Beginner Intermediate Advanced
N 3 7 10
M 2 . 33 2 . 43 3 . 2
SD 1 . 15 0 . 53 1 . 14
F( 2 , 17 )= 3 . 59 , p= 0 . 21 .
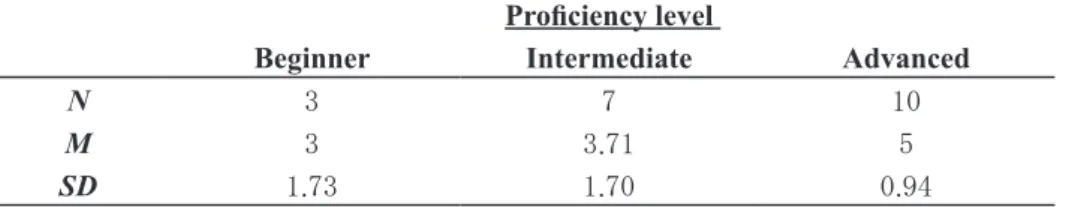
Table 8 . Comparison of NNSs ’ Q2 scores by proficiency level Proficiency level
Beginner Intermediate Advanced
N 3 7 10
M 3 3 . 71 5
SD 1 . 73 1 . 70 0 . 94
F( 2 , 17 )= 3 . 59 , p= 0 . 06 .
Table 6 . Comparison of NNSs ’ Q1 scores by length of residence in Japan Length of residence in Japan
less than 1 year (0.3-0.9) more than 1 year (1.2-2.11)
N 12 8
M 3 2 . 5
SD 1 . 21 0 . 53
t( 16 )= 1 . 26 , p= 0 . 22
Table 7 . Comparison of NNSs ’ Q1 scores by length of L2 study Length of L2 Study
less than 3 yrs (1.2-2.11) more than 3 yrs (3.6-6.6)
N 8 12
M 2 . 63 2 . 92
SD 0 . 74 1 . 16
t( 18 )=- 0 . 63 , p= 0 . 54
Table 9 . Comparison of NNSs ’ Q2 scores by length of residence in Japan Length of residence in Japan
less than 1 year (0.3-0.9) more than 1 year (1.2-2.11)
N 12 8
M 4 . 42 4
SD 1 . 38 1 . 77
t( 18 )= 0 . 59 , p= 0 . 56
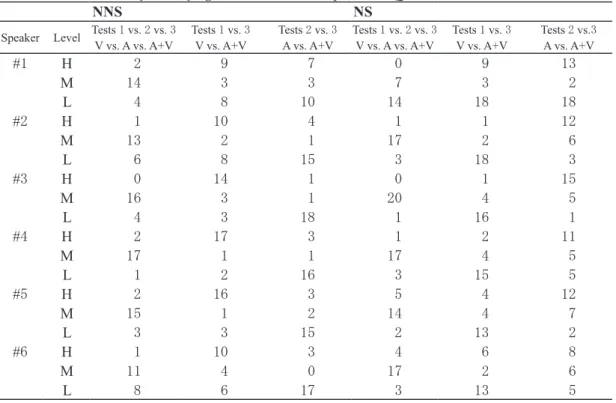
The distribution of level of agreement, i.e., consistency in responses, was examined for Q 2 across speakers on each test for both groups. The results are given in Table 11 .
Different patterns were observed for the two groups. In the case of Speaker # 1 , for example, only two ( 10 %) of the non-native participants chose the same answers for the speakers ’ emotions under
Table 10 . Comparison of NNSs ’ Q2 scores by length of L2 study Length of L2 Study
less than 3 yrs (1.2-2.11) more than 3 yrs (3.6-6.6)
N 8 12
M 4 4 . 42
SD 1 . 77 1 . 38
t( 18 )=- 0 . 59 , p= 0 . 56
Table 11 . Distribution of level of agreement between responses to Q2
NNS NS
Speaker Level Tests 1 vs. 2 vs. 3
V vs. A vs. A+V Tests 1 vs. 3
V vs. A+V Tests 2 vs. 3
A vs. A+V Tests 1 vs. 2 vs. 3
V vs. A vs. A+V Tests 1 vs. 3
V vs. A+V Tests 2 vs. 3 A vs. A+V
# 1 H 2 9 7 0 9 13
M 14 3 3 7 3 2
L 4 8 10 14 18 18
# 2 H 1 10 4 1 1 12
M 13 2 1 17 2 6
L 6 8 15 3 18 3
# 3 H 0 14 1 0 1 15
M 16 3 1 20 4 5
L 4 3 18 1 16 1
# 4 H 2 17 3 1 2 11
M 17 1 1 17 4 5
L 1 2 16 3 15 5
# 5 H 2 16 3 5 4 12
M 15 1 2 14 4 7
L 3 3 15 2 13 2
# 6 H 1 10 3 4 6 8
M 11 4 0 17 2 6
L 8 6 17 3 13 5
H = same responses are given L = different responses are given M = some responses are the same
Table 12 . Level of agreement (from high to low)
NNS Tests 1 vs. 3 > Tests 2 vs. 3 > Tests 1 vs. 2 . vs. 3
NS Tests 2 vs. 3 > Tests 1 vs. 3 > Tests 1 vs. 2 . vs. 3
all the conditions. Four ( 20 %) gave completely different responses. For nine ( 45 %) of the NNSs, the audio input had no impact on how they interpreted the speaker’s emotional state. Eight ( 40 %) provided different interpretations of the verbal message by the same speaker, suggesting that they might have derived different information from the visual input, or that the changes might have been brought about by the audio input. Half ( 50 %) of the NNSs changed their interpretation of the verbal message based on auditory input only. For the NNS group, a comparison between Tests # 1 & # 3 (Visual vs. Audio + Visual) demonstrates the highest level of agreement for all speakers, suggesting that the NNSs tended to interpret the speakers ’ emotional states just the same with or without verbal input (Table 12 ).
A comparison between Tests # 2 & # 3 (Audio vs. Audio + Visual), on the other hand, shows the highest level of disagreement (Table 13 ). This finding indicates that interpretations differed greatly when the NNSs had access to verbal input only, as opposed to having both verbal and nonverbal input.
Interestingly enough, the results for the NS group were the exact opposite: they showed the highest level of agreement between Tests # 2 & # 3 , and the highest level of disagreement between Tests # 1 &
# 3 (Table 12 and Table 13 ).
As mentioned earlier, the data clearly indicate that the NNSs had a stronger tendency than the NSs to interpret the smiles as an expression of happiness. What that means is that when non-native listeners perceive a verbal message and a facial gesture as a mismatch, they will be confused and the chances are that they will rely more on what they see than what they hear to decode the speaker’s verbal message and emotion. This is best captured in a remark made by a French participant about one of the speakers appearing in the videos and the choice she made for the speaker’s emotion. The participant wrote, “ She [referring to Speaker # 4 ] seems happy but she says, ‘ It’s sad. ’ ” The participant chose A (i.e., happy/excited) for her answer to Q 2 (i.e., How does he/she feel?). Evidently, she was sure about what she saw but had second thoughts about what she heard.
These findings suggest that the NNSs ’ judgments were greatly influenced by what they saw. The NSs, on the contrary, were evidently more open and flexible when it comes to decoding the meanings of the co-verbal smiles in Japanese conversation. They paid more attention to what they heard than what they saw. In other words, for most of the NNSs, seeing is believing, whereas for the NSs, that is not always true.
Table 13 . Level of disagreement (from high to low)
NNS Tests 2 vs. 3 > Tests 1 vs. 3 ≥ Tests 1 vs. 2 . Vs. 3
NS Tests 1 vs. 3 > Tests 2 vs. 3 ≥ Tests 1 vs. 2 . Vs. 3
6. Implications
This study has provided empirical evidence that NSs and NNSs do derive different information from the same smiles that co-occur with the speech of Japanese native speakers. There is no question that the NSs recognize the fact that smiling can convey something other than happiness. The communicative intent behind the speaker’s smile is, however, not immediately perceivable to NNSs, regardless of their proficiency level, length of L 2 study, or amount of exposure to the target culture.
While the smile does not seem to have much impact on NSs ’ understanding of the speech of other native speakers, it may constitute a major distractor for NNSs ’ comprehension. In other words, the NNSs can be misguided by Japanese co-verbal smiles, resulting in failure to distinguish between “ what appears to be ” and “ what really is, ” as evidenced in errors such as mishearing the speakers ’ utterances and misreading their emotions. In addition, this study has shown that Japanese native listeners are enculturated in such a way that they can dissociate smiles from the emotion of mirth whereas it is not so easy for non-native listeners to separate the two. This suggests that enculturation is inevitable in developing L 2 interactional competence.
Another observation is that the Japanese smile under study goes beyond Ekman and Friesen’s
( 1982 ) explanation as a mask to hide one’s negative emotions or a way “ to maintain relationships,
or to subordinate oneself to others of higher status ” , as Matsumoto ( 1996 : 109 ) puts it. Evidence
supporting this idea comes from the material used in the experiment: ( 1 ) The speakers ’ utterances
were full of words and phrases expressing strong emotions, such as shindoi ‘ tough, difficult, painful ’ ,
tsurai ‘ bitter, tough, painful ’ , sabishii ‘ lonesome, sad ’ , kinchou ‘ nervous, tense ’ , okorimasu ‘ I’m
angry ’ , mukatsukimasu ‘ that makes me mad ’ , and akirametemasu ‘ I give up. ’ Given the semantic
transparency of these remarks, there is no doubt that the speakers were sad, angry, exhausted,
disappointed, or in pain. It would be contradictory to assume that the speakers ’ co-verbal smiles were
intended to conceal their negative emotions because the emotions were so clearly expressed through
spoken words that they could not be effectively disguised in a fake smile. ( 2 ) The speakers were
randomly interviewed by TV reporters on the street, which means that there is a strong possibility
that the encounter was unplanned and unrehearsed and that the interviewers and interviewees were
strangers to each other. In an impromptu situation like that, we can safely assume that there is no pre-
established relationship or status difference to maintain or preserve between the two parties. Thus,
it is more likely that the speakers smiled simply because they wanted to show politeness toward
their interlocutor or to project an image of themselves as well-educated people with good manners,
especially in a situation where they found themselves speaking in front of a camera with an imagined
audience. In this sense, the co-verbal smile can be better understood as a bi-directional gesture of
politeness with face-enhancing effects for both the speaker and the listener. In either case, the smile is
voluntary and independent of the co-occurring speech. That explains why it is easily mistaken by non-
native listeners as a mismatch with speech.
These observations and findings have significant implications for L 2 pedagogy and assessment.
First, since language and culture are closely intertwined, effective communication requires a common ground that includes not only linguistic knowledge but also the specific cultural aspects of language use such as behavioral norms in face-to-face communication. It is thus essential for L 2 learners to acquire schematic knowledge concerning the target discourse community and be able to make use of it in both L 2 production and L 2 comprehension. By the same token, L 2 teachers must be culturally sensitive and responsive as well as linguistically competent. They should be aware of the fact that not all nonverbal behaviors are equally usable and interpretable across cultures and that some nonverbal behaviors could be misleading to the learners, especially those that are often considered to have universal values but operate under different rules in different cultures and communities. Therefore, they are advised to be careful in selecting video-taped material for listening practice and testing so as to minimize the risks of misjudgment of the learners ’ strengths and weaknesses and under-assessment of their competence in the target language. Finally, this study suggests an explicit-reflective approach to teaching cross-cultural differences in communication, particularly in relation to nonverbal behavior.
When differences are observed, teachers should discuss the implications and meaning of the behaviors and rules and encourage students to appreciate cultural perspectives other than their own.
Notes
1. Sources are given in order of their appearance in the text. ( 1 ) TBS The News. 18 : 00 - 19 : 50 , February 19 , 2011 . ( 2 ) ANN Houdou Station. 21 : 54 - 23 : 10 , March 03 , 2011 . ( 3 ) TBS Sunday Morning. 8 : 00 - 9 : 54 , March 07 , 2011 . ( 4 ) NHK News Watch 9. 21 : 00 - 22 : 00 , April 01 , 2011 . ( 5 ) FNN Super News. 16 : 53 - 17 : 54 , April 08 , 2011 . ( 6 ) ANN J-Channel. 16 : 54 - 18 : 18 , April 20 , 2011 . 2. Abbreviations: s=a slight smile, dotted line=same action continues, n=a slight head nod, M=a
body movement, H=a head movement, S= a big smile, N=a deep nod.
Acknowledgments
The author thanks Minami Yara, Airi Miyagi, Machiko Shinzato and Shuhei Tomita for their assistance throughout the experiments and all the participants in this study for their cooperation. This study was funded by a special research grant (Type C) from Okinawa International University.
References
Arndt , H. & Janney, R. W. ( 1987 ). InterGrammar: Toward an Integrative Model of Verbal, Prosodic and Kinesic Choices in Speech. Berlin: Mouton Gruyter.
Ekman, P. ( 1972 ). Universals and cultural differences in facial expressions of emotions. In J. K. Cole (Ed.), Nebraska Symposium on Motivation (pp. 207 - 283 ). Lincoln: University of Nebraska Press.
Ekman, P. & Friesen, W. ( 1969 ). The repertoire of nonverbal behavior: Categories, origins, usage and
coding. Semiotica, 1, 49 - 98 .
Ekman. P. & Friesen, W. ( 1982 ). Felt, false, and miserable smiles. Journal of Nonverbal Behavior 6( 4 ): 238 - 252 .
Hall, E. T. ( 1977 ). Beyond Culture. New York: Anchor.
Hasada, R. ( 1997 ). Some aspects of Japanese cultural ethos embedded in nonverbal communicative behavior. In F. Poyatos (Ed.), Nonverbal Communication and Translation: New Perspectives and Challenges in Literature, Interpretation and the Media (pp. 83 - 106 ). Philadelphia, PA: John Benjamins.
Klopf, D. W. ( 1998 ). Intercultural Encounters: The Fundamentals of Intercultural Communication ( 4
thed.). Englewood, CO: Morton.
Matsumoto, D. ( 1996 ). Unmasking Japan: Myths and Realities about the Emotions of the Japanese.
Stanford: Stanford University Press.
Matsumoto, D. & Yoo, S. H. ( 2005 ). Culture and applied nonverbal communication. In R. E. Riggio &
R. S. Feldman (Eds.), Nonverbal Communication (pp. 255 - 277 ). Mahwah, NJ: Lawrence Erlbaum Associates.
McNeill, D., Cassell, J. & McCullough, K.-E. ( 1994 ). Communicative effects of speech-mismatched gestures. Research on Language and Social Interaction, 27 ( 3 ), 223 - 237 .
Müller, C., Cienki, A., Fricke, E., Ladewig, S., McNeill, D. & Teßendorf, S. (Eds.) ( 2013 ). Body- Language-Communication: An International Handbook on Multimodality in Human Interaction.
Berlin & Boston: De Gruyter Mouton.
Richmond, V. P., McCroskey, J. C. & Hickson, M. L. ( 2011 ). Nonverbal Behavior in Interpersonal Relations ( 7
thed.). Boston, MA: Allyn and Bacon.
Saarni, C. ( 1979 ). Children’s understanding of display rules for expressive behavior. Developmental Psychology, 15 ( 4 ), 424 - 429 .
Von-Raffler Engel, W. ( 1981 ). Developmental kinesics: How children acquire communicative and
non-communicative nonverbal behavior. Infant Mental Health Journal, 2( 2 ), 84 - 94 .
Appendix I: Questionnair e in English Q 1. W ha t i s th is p er so n ta lk in g ab ou t?
Q 2. H ow d oe s he /s he fe el ? Pl ea se c ir cl e al l t ha t a pp ly . I f y ou c ho os e G , p le as e sp ec ify . E xp er im en t # 1, # 2, # 3 1. A. happ y/ ex ci te d B . ne rv ous /anx io us C . di sappo inte d/ fr us tr ate d D. s ad/ lo ne ly E . ang ry /ho sti le F. ti re d/ pai nf ul G. 2. A. happ y/ ex ci te d B . ne rv ous /anx io us C . di sappo inte d/ fr us tr ate d D. s ad/ lo ne ly E . ang ry /ho sti le F. ti re d/ pai nf ul G. 3. A. happ y/ ex ci te d B . ne rv ous /anx io us C . di sappo inte d/ fr us tr ate d D. s ad/ lo ne ly E . ang ry /ho sti le F. ti re d/ pai nf ul G. 4. A . happ y/ ex ci te d B . ne rv ous /anx io us C . di sappo inte d/ fr us tr ate d D. s ad/ lo ne ly E . ang ry /ho sti le F. ti re d/ pai nf ul G. 5. A . happ y/ ex ci te d B . ne rv ous /anx io us C . di sappo inte d/ fr us tr ate d D. s ad/ lo ne ly E . ang ry /ho sti le F. ti re d/ pai nf ul G. 6. A . happ y/ ex ci te d B . ne rv ous /anx io us C . di sappo inte d/ fr us tr ate d D. s ad/ lo ne ly E . ang ry /ho sti le F. ti re d/ pai nf ul G.
Appendix II: Questionnair e in Japanese
問1:この人は、何について話していますか。 問2:彼(女)はどんな気持ちで話していますか。(複数回答可) 実験1, 2 , 3 1. A.喜び・興奮 B.緊張・不安 C.失望・悔しい D.悲しい・寂しい E.怒り・反感 F.苦痛・疲れた G.その他: 2.
A.喜び・興奮 B.緊張・不安 C.失望・悔しい D.悲しい・寂しい E.怒り・反感 F.苦痛・疲れた G.その他: 3.
A.喜び・興奮 B.緊張・不安 C.失望・悔しい D.悲しい・寂しい E.怒り・反感 F.苦痛・疲れた G.その他: 4.
A.喜び・興奮 B.緊張・不安 C.失望・悔しい D.悲しい・寂しい E.怒り・反感 F.苦痛・疲れた G.その他: 5.
A.喜び・興奮 B.緊張・不安 C.失望・悔しい D.悲しい・寂しい E.怒り・反感 F.苦痛・疲れた G.その他: 6.
A.喜び・興奮 B.緊張・不安 C.失望・悔しい D.悲しい・寂しい E.怒り・反感 F.苦痛・疲れた G.その他:
Appendix III: Questionnair e in Chinese (traditional characters)
問題1:
這個人在說什麼?
問題2:
這個人說話時的心情如何? (
可選擇一個以上)
實驗1, 2 , 3 1. A.高興‧興奮 B .
緊張‧憂慮 C.
受挫‧失望 D.
悲哀‧寂寞 E.
憤怒‧反感 F.
痛苦‧疲勞 G.
其他: 2. A.
高興‧興奮 B .
緊張‧憂慮 C.
受挫‧失望 D.
悲哀‧寂寞 E.
憤怒‧反感 F.
痛苦‧疲勞 G.
其他: 3. A
.高興‧興奮 B .
緊張‧憂慮 C.
受挫‧失望 D.
悲哀‧寂寞 E.
憤怒‧反感 F.
痛苦‧疲勞 G .
其他: 4. A
.高興‧興奮 B .
緊張‧憂慮 C.
受挫‧失望 D.
悲哀‧寂寞 E.
憤怒‧反感 F.
痛苦‧疲勞 G .
其他: 5. A
.高興‧興奮 B .
緊張‧憂慮 C.
受挫‧失望 D.
悲哀‧寂寞 E.
憤怒‧反感 F.
痛苦‧疲勞 G .
其他: 6. A.
高興‧興奮 B .
緊張‧憂慮 C.
受挫‧失望 D.
悲哀‧寂寞 E.
憤怒‧反感 F.
痛苦‧疲勞 G.
其他:
Appendix IV : Questionnair e in Chinese (simplified characters)
问题1: 这个人在说什麽?
问题2: 这个人说话时的心情如何? (可选择一个以上) 实验1, 2, 3