1.
(OTEC)
OTEC 30℃
25℃
OTEC
OTEC 30℃
(1) (2) (3) (4)
Djordjevic (5) (1) (2)
/
( )
*1 *2 *3 *4 *1
Boiling heat transfer enhancement for ammonia using micro fabrication surface on plate evaporator
(Effect of micro groove direction)
Hirofumi ARIMA
*5, Nobuhiko MATSUO, Keita SHIGYOU, Akio OKAMOTO and Yasuyuki IKEGAMI
*5 Institute of Ocean Energy, Saga University
1-48 Kubara-aza, Hirao, Yamashiro-machi, Imari-shi, Saga 849-4256, Japan
The experimental study has been performed for the heat transfer enhancement in ammonia on this new plate evaporator which treated the surface on the micro groove. The micro groove is depth of 30 micro meters and width of 200 micro meters. The local boiling heat transfers were measured on the evaporator surface using 10-thermocouples inside evaporator. For comparison of the heat transfer characteristic of the evaporator, the local boiling heat transfer coefficient on a flat surface and two micro grooved surface which have vertical and horizontal directions to ammonia flow, were measured in a range of mass flux (2 - 7.5 kg/m2 s), heat flux (10 - 20kW/m2), and saturation pressure (0.7 - 0.9 MPa).
The result shows that, the local boiling heat transfer coefficient increased with an increase mass flux, averaged heat flux and vapor quality in all surface conditions. The heat transfer coefficient of horizontal and vertical micro grooved surface was larger than that of flat surface. Especially, the horizontal micro grooved surface had best heat transfer coefficient. In case of low vapor quality which was in nucleate boiling region, the heat transfer coefficient of horizontal and vertical surfaces showed large increment from that of flat surface.
However, in case of high vapor quality which was added the slightly effect of convective boiling, the heat transfer of vertical surface showed small increment from that of flat surface though that of horizontal surface showed large increment.
Key Words : Heat transfer enhancemnet, Ammonia, Plate heat exchanger, Micro grooved surface
* 2010 7 31
*1
*2
*3
*4
E-mail: [email protected]
(3) (4)
/ ( 90%)
Djordjevic
(5)
OTEC
(6)
(7) (8) (7)
(8)
30µm
10 ~ 40%
(8)
2.
G [kg/m2s]
h [W/m2K]
i [J/kg]
ifg [J/kg]
isat.liq [J/kg]
k [W/mK]
li [m]
Psat [Pa]
qav [W/m2]
rc [m]
Ti [℃]
Tsat [℃]
Twall [℃]
w [m]
x [-]
δ [m]
3.
3 1 Fig. 1
(8) (
)
3
2kW
PROMASS 83A ± 0.1%
FD-M, FD-P ± 1.6%
FP101
0 ~ 2MPa ± 0.25%
K ST6 1
±1.5℃
PC
0.1oC Fig. 2
SUS304 ( 370mm 220mm)
SUS304 ( 2mm)
5 2 10 K
40mm, 59mm
100V-1050W
100mm 250mm 20mm
150W
P
1
2
3
4
5 6
7 8
9
10
11 12
13
Cold water circuit Working fluid circuit
P
P
T
T
P
T P 14
T
T
T
T
P T
15
16
T T
1. Test plate (Evaporator) 2. Pre-heater 3. Condenser 4. Working fluid tank 5. Sub cooler 6. Electric heater
7. Cold water tank 8. Refrigerator 9. Hot water tank 10. Working fluid pump 11. Hot water pump 12. Cold water pump 13. Mass flow meter 14. Volumetric flow meter 15. Degassed valve 16. Release valve
Hot water circuit
T
T
T T
Fig. 1 Schematic of experimental apparatus
40
l2
S1, S3: l2= 5.02 S2: l2= 5.01 Frame
Heat transfer plate Spacer
B
Heater block
5
A A
TC wells
Fig. 2 Assembly of test plate
7
Fig. 3 (w) 100mm (δ) 2 mm
Fig. 2 B Fig. 4
T1, T2,
l1, T2 l2
2
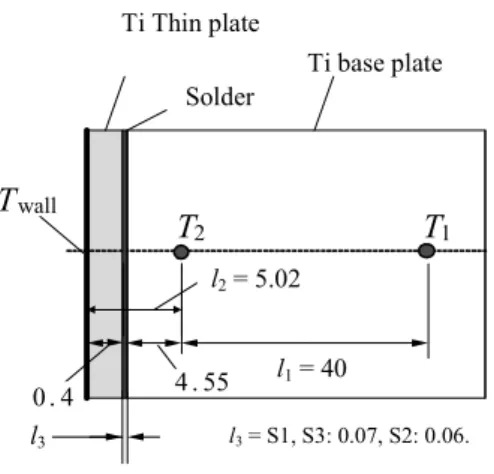
Fig. 3 Cross sectional view of test plate (A-A’ cross section of Fig. 2)
T
2T
1T
wallTi Thin plate
Ti base plate Solder
4 . 55 0 . 4
l3 = S1, S3: 0.07, S2: 0.06.
l1 = 40 l2 = 5.02
l3
Fig. 4 Configuration of thermocouples inside test plate (Detail of circle “B” area of Fig. 2) 3 2
Fig. 5 3
3 ( Ti)
220mm,
370mm 50mm 100mm 250mm
0.4mm
Ti Ti (a) ~ (c)
Ti
Ti (a) ~ (c)
(a) ( S1) : 0.6 µm
(b) ( S2) :
(c) ( S3) :
Fig. 6 (b), (c) Ti
Fig. 6 (b) 200µm,
100µm, 30µm
0.6 µm 5 µm
3 3
3.3.1
q Fig. 4 T1
T2 l1 k
1 2 1
l T kT
q −
= (1)
Twall (1)
k T ql
Twall = 2− 2 (2)
h
Twall Tsat
) (Twall Tsat h q
= − (3)
Tsat
Psat
3.3.2
x ( )
fg liq , sat
i i x i−
= (4)
i isat.liq ifg
i (8)
P-PROPATH(9)
3 4 Table 1
5 2
(a)
(b)
(c)
(i) General view (ii) Side view
Fig. 5 Photographs of three test heat transfer plates
(a) S1: Flat surface, (b) S2: Vertical grooved surface, (c) S3: Horizontal grooved surface
Fig. 6 Detail of S2 and S3 plate surface
Table 1 Experimental Conditions
Working fluid Pure ammonia
Plate surface
S1: Flat surface S2: Vertical grooved surface S3: Horizontal grooved surface
Plate substance Titanium
Mass fluxG[kg/ m2s] 2, 5, 7.5 Average heat flux
qav [kW/ m2] 10, 15, 20 Saturation pressure
Psat [MPa] 0.7, 0.8, 0.9 Ti thin grooved plate
Ti base Ti thin flat surface
Ti base
Ti base Ti thin grooved plate 250
100
4.
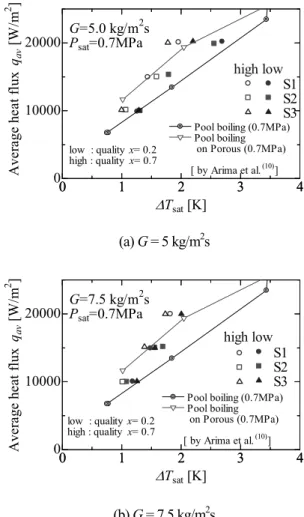
4 1 Fig. 7 (a) (b) G = 5 7.5 kg/m2s
S1 ~ S3 (x = 0.2)
(x = 0.7)
(10)
(Psat = 0.7MPa) Fig. 7 (a) G = 5 kg/m2s
S1 (10)
S1
S2 S3 qav =10kW/m2
S3 0.5K
S2 S3
S1
qav = 10kW/m2 S1 ~ S3 0.2K qav > 15kW/m2
S1, S2, S3
S1
Fig. 7 (b) G = 7.5 kg/m2s
S1 ~ S3 Fig. 7 (a)
G 5 7.5
0 1 2 3 4
0 10000 20000
∆Tsat [K]
Average heat flux qav [W/m2 ]
G=5.0 kg/m2s Psat=0.7MPa
S1 S2 S3 high low
low : quality x= 0.2 high : quality x= 0.7
0 1 2 3 4
Pool boiling (0.7MPa) Pool boiling on Porous (0.7MPa) [ by Arima et al. (10)]
(a) G = 5 kg/m2s
0 1 2 3 4
0 10000 20000
∆Tsat [K]
Average heat flux qav [W/m2 ]
G=7.5 kg/m2s Psat=0.7MPa
S1 S2 S3 high low
low : quality x= 0.2 high : quality x= 0.7
0 1 2 3 4
Pool boiling (0.7MPa) Pool boiling on Porous (0.7MPa) [ by Arima et al. (10)]
(b) G = 7.5 kg/m2s
Fig. 7 Boiling curve at different plate surfaces
4 2 Fig. 8
(a) (b) (qav = 10 kW/m2)
(Psat = 0.7 MPa)
Fig. 8 (a) (b)
Fig. 8 (a) S2
G = 2
5 kg/m2s 30%
G = 5 7.5 kg/m2s Fig. 8 (b) S3
(3) G = 7.5 ~ 15 kg/m2s
G = 2 kg/m2s
3 ~ 11 mm/s
0 0.2 0.4 0.6 0.8 1
0 5000 10000
Vapor quality x [-]
Local heat transfer coefficient hloc [W/(m2 K)]
qav=10kW/m2 Psat=0.7MPa
G[kg/m2s]
2.0 5.0 7.5
(a) S2
0 0.2 0.4 0.6 0.8 1
0 5000 10000
Vapor quality x [-]
qav=10kW/m2 Psat=0.7MPa
G[kg/m2s]
2.0 5.0 7.5
Local heat transfer coefficient hloc [W/(m2 K)]
(b) S3
Fig. 8 Comparison between boiling heat transfer coefficient at different mass fluxes on S2 and S3
4 3 Fig. 9 (a)
(b) (qav = 20 kW/m2) (Psat = 0.7 MPa) S1, S2, S3
Fig. 9 (a) G = 5 kg/m2s, Fig. 9 (b) 7.5kg/m2s
Fig. 9 (a) (b)
(x < 0.3) S1 S2 12%, S3 16 ~ 22%
(x > 0.3)
S1 S2 0 ~ 2%
, S3 10%
S3 S2
rc (11)
rc = 2 µm (Psat = 0.7MPa, ∆Tsat = 1℃) S1 0.6µm
S2 S3 200µm 30µm
rc
S2 S3
S2 S3
Fig. 6 S2
S3 S3
0 0.2 0.4 0.6 0.8 1
0 5000 10000
Vapor quality x [-]
Local heat transfer coefficient hloc [W/(m2 K)]
G=5 kg/m2s qav=20kW/m2 Psat=0.7MPa
S1 S2
(S2/S1) 11% S3
(S3/S1) 16%
(S2/S1) 2%
(S3/S1) 10%
(a) G = 5 kg/m2s
0 0.2 0.4 0.6 0.8 1
0 5000 10000
Vapor quality x [-]
G=7.5 kg/m2s qav=20kW/m2 Psat=0.7MPa
S1 S2
(S2/S1) 12% S3
(S3/S1) 22%
(S2/S1) 0%
(S3/S1) 10%
Local heat transfer coefficient hloc [W/(m2 K)]
(b) G = 7.5 kg/m2s
Fig. 9 Comparison between boiling heat transfer coefficient for plate S1, S2 and S3
S2
S1 S2
S3 S2
5.
(1) (2) (3) (4)
G = 2 kg/m2s
OTEC
(1) Kushibe M. et al., Trans. JSRAE, Vol. 22, No. 4 (2005) , pp. 403-415 (in Japanese).
(2) Kushibe M. et al., Trans. JSRAE, Vol. 23, No. 4 (2006), pp. 389-397 (in Japanese).
(3) Arima H. et al., Int. J. Refrigeration, Vol. 33, No. 2 (2010), pp. 359-370.
(4) Okamoto A. et al., Trans. JSRAE, Vol. 26, No. 2 (2009), pp. 131 - 139 (in Japanese).
(5) Djordjevic E. et al., Int. J. Heat Mass Trans., Vol. 51 (2008), pp. 6235-6242.
(6) The Japan Society of Mechanical Engineers ed., Boiling heat transfer and cooling, (1989), pp. 347- 367, Japan industrial publishing (in Japanese).
(7) Ikegami Y. et al., Proceedings of 37th National heat transfer symposium of Japan, Vol. 37, No. 3, (2000), pp.
825-826 (in Japanese).
(8) Arima H. et al., OTEC, Vol. 14, (2009), pp. 11-19 (in Japanese).
(9) P-Propath
http://www2.mech.nagasaki-u.ac.jp/PROPATH/p-propath.
html (2006.4).
(10) Arima H., et al., Thermal Science and Engineering, Vol. 9, No. 4, (2001), pp. 65-66
(11) Griffith P. et al., Chem. Eng. Progress Symp. Series, Vol.
56, No. 30, (1960) , pp. 39 - 48.