九州大学学術情報リポジトリ
Kyushu University Institutional Repository
トレーサー試験に基づく蒸気卓越型地熱地域におけ る貯留層涵養の評価に関する研究
福田, 大輔
https://doi.org/10.15017/1398344
出版情報:Kyushu University, 2013, 博士(工学), 課程博士 バージョン:
権利関係:Fulltext available.
1 ... 1
... 10
2 ... 14
2.1 ... 14
2.2 ... 14
2.3 ... 21
2.3.1 ... 21
2.3.2 ... 23
2.3.3 ... 27
2.3.4 ... 27
2.4 ... 29
2.4.1 MR-1 (2000) ... 29
2.4.2 MR-1 (2003) ... 33
2.4.3 M-6 (2000) ... 35
2.4.4 M-13 (2002) ... 35
2.4.5 M-13 (2007) ... 38
2.4.6 M-14 (2001) ... 38
2.5 ... 41
2.6 ... 42
... 44
3
... 46
3.1 ... 46
3.2 ... 46
3.2.1 ... 46
3.2.2 ... 51
3.3 ... 51
3.3.1 MR-1 ... 51
3.3.2 M-6 ... 56
3.4 ... 60
3.5 ... 62
... 63
4 .... 64
4.1 ... 64
4.2 ... 66
4.3 ... 69
4.4 ... 73
4.5 ... 75
4.5.1 MR-1(2000) ... 75
4.5.2 M-13(2002) ... 77
4.5.3 M-14(2001) ... 81
4.6 ... 83
4.7 ... 86
... 87
5 ... 89
5.1 ... 89
5.2 ... 90
5.2.1 ... 90
5.2.2 ... 94
5.2.3 ... 95
5.2.4 ... 95
5.2.5 ... 95
5.2.6 ... 97
5.3 ... 101
5.3.1 ... 101
5.3.2 ... 104
5.3.3 ( ) ... 104
5.3.4 ... 109
5.4 ... 109
5.5 ... 113
5.6 ... 118
... 119
6 ... 121
... 124
1
( )
90% 70% (2006
, 2013, pp. 15-18)
100
(Stefansson, 2005) (2009, pp. 67-68)
3
(150°C ) 2347 kW ( , 2008)
17 20
54 kW ( , 2013, p. 1)
2.3%
1.1
( )
m 4000 m (
)
( )
( ) ( )
Fault Intrusive rock
Magma chamber
Geothermal fluid Conductive heat
Geothermal well Geothermal
manifestation Altered rock (cap rock) Lava
bed boundary
Fault Meteoric
water
Meteoric water
Volcanic vent
図1.1 地熱資源開発を行う熱水対流系の概念
Conductive heat Geothermal
fluid
( : Ferrara et al., 1970; : Barker et al., 1992; Goyal and Box, 1990; Mock, 1990)
( )
( : Bertrami et al., 1985;
Cappetti et al., 1995; Giovannoni et al., 1981; : Barker et al., 1995; Chasteen, 1975; Enedy et al., 1991; Gambill, 1990; Goyal, 1999; Goyal and Box, 1992; Stark et al., 2005)
(
) ( )
Calpine 2003
(482 L/s) 105 MWnet
(Goyal and Conant, 2010)
( )
( )
(Goyal and Box, 1992)
(Grant and Bixley, 2011, p.42)
1.2
( )
( ) ( 1.2
) ( )
( )
( Adams, 1985; Adams et al., 1992; Horne,
1985) ( )
(2H
18O) (Nuti et al., 1981)
( ) (Gulati et al., 1978)
(Beall et al., 1989; Gambill, 1990) ( )
Production well A Injection well Production well B
Flow path (permeable fracture)
Tracer flow
Production well A
Production well B
Elapsed time
Tracer concentration
Tracer injection
図1.2 トレーサー試験の概念
ground
Tracer return curve
Sampling, analysis Sampling, analysis
(Adams et al., 2001) 1990
(R-12, R-13, Adams et al., 1991; Beall et al., 1994)
(R-23, R-134a, Beall et al., 1998; Adams et al., 1999) (SF6 Voge et al., 1994)
( )
(Adams et al., 2001)
(Adams, 1995)
Adams (1995)
(Adams, 1995)
Adams (1995)
(Adams, 1995; Adams et al., 2000, 2004;
, 1998) ( 1-
1- )
( ) (
) (
)
1988 1989
(Hanano et al., 1991) 2003
10 ( , 2013)
1988 1989
(Hanano et al., 1991)
1.3
4 4 6
図1.3 本研究の流れと各章の関係
二相トレーサー試験方法の開発(第2章)
・トレーサー試薬の選択
・トレーサー投入方法
・モニタリング試料採取方法
・トレーサー分析方法
二相トレーサー試験の適用(第2章)
・松川蒸気卓越型地熱地域に対する試験の実施
・4種類の低級アルコールのトレサーとしての使用
・4坑井を用いた計6回の試験の実施
・本トレーサー試験方法の蒸気卓越型地熱貯留層への適合性の評価
松川地域での二相トレーサー試験結果を用いた,貯留層涵養に係る要素の評価(第3−5章)
・二相トレーサー試験結果による注水流動および沸騰挙動の解明
生産井の注水応答の判別と定量 的な解釈(第3章)
注水流体の沸騰過程の定量的な 解析(第4章)
地熱貯留層の透水性フラクチャ 分布と貯留層構造の関係の考察 (第5章)
トレーサー試験に基づく蒸気卓越型地熱地域における貯留層涵養の評価に関する研究
トレーサー試験を用いた貯留層涵養の評価手法に関する現状の把握と問題点の抽出(第1章)
1) 2) 3)
6 1
2
4 4
6
3
4
( )
5
6
Adams, M. C. (1985) Tracer stability and chemical changes in an injected geothermal fluid during injection-backflow testing at the East Mesa geothermal field. Proceedings of Tenth Workshop on Geothermal Reservoir Engineering, Stanford University, Stanford, California, January 22- 24, 1985, SCP-TU-84, 247-252.
Adams, M. C., Beall, J. J., Enedy, S. L., and Hirtz, P. N. (1991) The application of halogenated alkanes as vapor-phase tracers: A field test in The Southeast Geysers. Geothermal Resources Council Transactions, 15, 457-463.
Adams, M. C., Moore, J. N., Fabry, L. G., and Ahn, J. (1992) Thermal stabilities of aromatic acids as geothermal tracers. Geothermics, 21, 323-339.
Adams, M. C. (1995) Vapor, liquid and two-phase tracers for geothermal systems. Proceedings of the 1995 World Geothermal Congress, Florence, Italy, May 18-31, 1875-1880.
Adams, M. C., Beall, J. J., Hirtz, P., Koenig, B. A., and Smith, J. L. B. (1999) Tracing effluent injection into The SE Geysers - a progress report. Geothermal Resources Council Transactions, 23, 341-345.
Adams, M. C., Yamada, Y., Yagi, M., Kondo, T., and Wada, T. (2000) Stability of methanol, propanol, and SF6 as high-temperature tracers. Proceedings of the 2000 World Geothermal Congress, Kyushu-Tohoku, Japan, May 28-June 10, 3015-3019.
Adams, M. C., Beall, J. J., Enedy, S. L., Hirtz, P. N., Kilbourn, P., Koenig, B. A., Kunzman, R., and Smith, J. L. B. (2001) Hydrofluorocarbons as geothermal vapor-phase tracers. Geothermics, 30, 747-775.
Adams, M. C., Yamada, Y., Yagi, M., Kasteler, C., Kilbourn, P., and Dahdah, N. (2004) Alcohols as two-phase tracers. Proceedings of 29th Workshop on Geothermal Reservoir Engineering, Stanford University, Stanford, CA, USA, January 26-28, 2004, SGP-TR-175, 8p.
Barker, B. J., Gulati, M. S., Bryan, M. A., and Riedel, K. L. (1992) Geysers reservoir performance.
Monograph on The Geysers Geothermal Field, Geothermal Resources Council, 167-177.
Barker, B. J., Koenig, B. A., and Stark, M. A. (1995) Water injection management for resource maximization: Observations from 25 years at The Geysers, California. Proceedings of the 1995 World Geothermal Congress, Florence, Italy, May 18-31, 1959-1964.
Beall, J. J., Enedy, S., and Box Jr., W. T. (1989) Recovery of injected condensate as steam in The
South Geysers field. Geothermal Resources Council Transactions, 13, 351-358.
Beall, J. J., Adams, M. C., and Hirtz, P. N. (1994) R-13 tracing of injection in The Geysers.
Geothermal Resources Council Transactions, 18, 151-159.
Beall, J. J., Adams, M. C., and Hirtz, P. N. (1998) Evaluation of R134A as an injection water tracer in The Southeast Geysers. Geothermal Resources Council Transactions, 22, 569-573.
Bertrami, R., Calore, C., Cappetti, G., Celati, R., and D'Amore, F. (1985) A three-year recharge test by reinjection in the central area of Larderello field: Analysis of production data. Geothermal Resources Council Transactions, 9, 293-298.
Cappetti, G., Parisi, L., Ridolfi, A., and Stefani, G. (1995) Fifteen years of reinjection in the Larderello-Valle Secolo area: Analysis of the production data. Proceedings of the 1995 World Geothermal Congress, Florence, Italy, May 18-31, 1997-2000.
Chasteen, A. J. (1975) Geothermal steam condensate reinjection. Proceedings of the Second United Nations Symposium on the Development and Use of Geothermal Resources, San Francisco, California, USA, 20-29 May 1975, 1335-1336.
Enedy, S., Enedy, K., and Maney, J. (1991) Reservoir response to injection in The Southeast Geysers. Proceedings of 16th Workshop on Geothermal Reservoir Engineering Stanford University, Stanford, CA, USA, January 23-25, 1991, SGP-TR-134, 75-82.
Ferrara, G. C., Panichi, C., and Stefani, G. (1970) Remarks on the geothermal phenomenon in an intensively exploited field. Results of an experimental well. Geothermics, 2, 578-586.
(2013)
. , 35,
69-81.
Gambill, D. T. (1990) The recovery of injected water as steam at The Geysers. Geothermal Resources Council Transactions, 14, 1655-1660.
Giovannoni, A., Allegrini, G., and Cappetti, G. (1981) First results of a reinjection experiment at Larderello. Proceedings of 7th Workshop on Geothermal Reservoir Engineering Stanford University, Stanford, CA, USA, December 15-17, 1981, SGP-TR-55, 77-83.
Goyal, K. P. and Box Jr., W. T. (1990) Reservoir response to production: Castle Rock Springs Area, East Geysers, California, USA. Proceedings of 15th Workshop on Geothermal Reservoir
Engineering Stanford University, Stanford, CA, USA, January 23-25, 1990, SGP-TR-130,
103-112.
Goyal, K. P. and Box Jr., W. T. (1992) Injection recovery based on production data in Unit 13 and Unit 16 areas of The Geysers field. Proceedings of 17th Workshop on Geothermal Reservoir Engineering Stanford University, Stanford, CA, USA, January 29-31, 1992, SGP-TR-141, 103-109.
Goyal, K. P. (1999) Injection related cooling in the Unit 13 area of The Southeast Geysers, California, USA. Geothermics, 28, 3-19.
Goyal, K. P. and Conant, T. T. (2010) Performance history of The Geysers steam field, California, USA. Geothermics, 39, 321-328.
Grant, M. A. and Bixley, P. F. (2011) Geothermal reservoir engineering. 2nd ed., Academic Press, 359p.
Gulati, M. S., Lipman, S. C., and Strobel, C. J. (1978) Tritium tracer survey at The Geysers.
Geothermal Resources Council Transactions, 2, 237-239.
Hanano, M., Ohmiya, T., and Sato, K. (1991) Reinjection experiment at the Matsukawa
vapor-dominated geothermal field: Increase in steam production and secondary heat recovery from the reservoir. Geothermics, 20, 279-289.
Horne, R. N. (1985) Reservoir engineering aspects of reinjection. Geothermics, 14, 449-457.
(2013) 2012 .
, 95p.
Mock, J. E. (1990) DOE's Geothermal R&D program: Progress and developments. Proceedings of 15th Workshop on Geothermal Reservoir Engineering Stanford University, Stanford, CA, USA, January 23-25, 1990, SGP-TR-130, 1-4.
(2008) 2008.
20 , B01.
(2009) III. 3. 1 . ,
, 145p.
Nuti, S., Calore, C., and Noto, P. (1981) Use of environmental isotopes as natural tracers in a reinjection experiment at Larderello. Proceedings of 7th Workshop on Geothermal Reservoir Engineering Stanford University, Stanford, CA, USA, December 15-17, 1981, SGP-TR-55, 85-89.
(1998) 9 /
/ . 200p.
Stark, M. A., Box Jr., W. T., Beall, J. J., Goyal, K. P., and Pingol, A. S. (2005) The Santa Rosa-Geysers recharge project, Geysers geothermal field, California. Geothermal Resources Council Transactions, 29, 145-150.
Stefansson, V. (2005) World geothermal assessment. Proceedings of the 2005 World Geothermal Congress, Antalya, Turkey, April 24-29, 6p.
Voge, E., Koenig, B., Smith, J. L. B., Enedy, S., Beall, J. J., Adams, M. C., and Haizlip, J. (1994) Initial findings of The Geysers Unit 18 cooperative injection project. Geothermal Resources Council Transactions, 18, 353-357.
2 2.1
蒸気卓越型貯留層に対する注水を用いた貯留層涵養
(Adams, 1995)
(Adams, 1995) (Adams, 1995;
Adams et al., 2000, 2004; , 1998)
4 4
6
。
2.2
( 1- 2- )
(R-134a R-23 SF6)
(100 kg
1000 kg )
(1) 2.1
(15°C) 489 kPa 3691 kPa
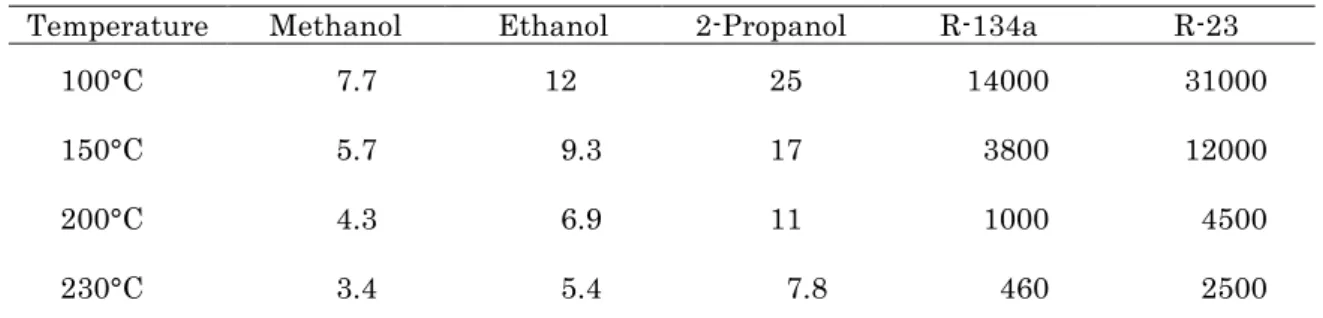
表 2. 1 二相トレーサー試験に使用する低級アルコール 類,気相トレーサーおよび水 の物理的性質
Compound FormulaFormula weight (g/mol) Boiling point (°C) Solubility in water Vapor pressure (calculated at 15°C, kPa)Vapor pressure (calculated at 200°C, MPa) Reference MethanolCH3OH32.0 64.7 ∞9.8 4.0 FW, BP, S, VP: [1] EthanolCH3CH2OH46.1 78.4 ∞4.3 3.0 FW, BP, S, VP: [1] 1-Propanol CH3(CH2)2OH60.1 97.8 ∞1.4 1.7 FW, BP, S, VP: [1] 2-Propanol (CH3)2CHOH60.1 82.5 ∞3.1 2.6 FW, BP, S, VP: [1] Water H2O18.0 100– 1.7 1.6 FW, BP: [2]; VP: [1] R-134aCF3CH2F102.0 -26.1 0.15% (wt.) 489– FW, BP, VP: [4]; S:[3] R-23CHF370.0 -82.0 0.1% (wt.) 3691– FW, BP, VP: [4]; S:[2] Sulfur hexafluorideSF6146.1 -63.5 0.0035% (wt.) 1868– FW, BP: [4]; S, VP: [2] Reference: FW as formula weight, BP as boiling point, S as solubility in water, VP as vapor pressure [1] Poling et al. (2008); [2] The Japan Society of Mechanical Engineers (1983); [3] McLinden et al. (1998); [4] Poling et al. (2001)
1.4 kPa 9.8 Pa 3–4
(1.71 kPa) 200°C
(2)
0.15 wt%
(R-134a, 2.1)
( )
( 30°C 50°C )
( )
(Hirtz et al., 2010) ( 2.1)
(Hirtz et al., 2010)
R-134a kg
2–3 (Hirtz et al., 2010)
(
30°C )
( )
(Giggenbach and Goguel,1986)
(3)
Adams (1995), Adams et al. (2000, 2004) (1998)
R-134a SF6
1- 2.1
250°C 330°C 15
SF6
0 5 10 15 Time (day) 0.2
0.4 0.6 0.8 1.0
Fraction remaining
Methanol
● 250 C, pH 4.0
○ 250 C, pH 6.6
□ 280 C, pH 6.6
▲ 300 C, pH 4.0
△ 300 C, pH 6.6
◇ 320 C, pH 6.6
0 5 10 15
Time (day) 0.2
0.4 0.6 0.8 1.0
Fraction remaining
1-Propanol
● 250 C, pH 4.0
■ 280 C, pH 3.3
□ 280 C, pH 6.6
▲ 300 C, pH 4.0
◇ 320 C, pH 6.6
0 5 10 15
Time (day) 0.2
0.4 0.6 0.8 1.0
Fraction remaining
SF
6● 250 C, pH 4.0
○ 250 C, pH 7.0
□ 280 C, pH 6.6
▲ 300 C, pH 4.0
△ 300 C, pH 7.0
◇ 330 C, pH 6.6
0 5 10 15
Time (day) 0.2
0.4 0.6 0.8 1.0
Fraction remaining
● 250 C, pH 4.0
○ 250 C, pH 6.58
■ 280 C, pH 3.3
▲ 300 C, pH 4.0
△ 300 C, pH 6.58
0 5 10 15
Time (day) 0.2
0.4 0.6 0.8 1.0
Fraction remaining
Ethanol R-134a
(HFC)
● 270 C
○ 290 C
◇ 310 C
図2.1 低級アルコール類および気相トレーサーの耐熱性室内実験結果
(Adams, 1995, Adams et al., 2000, 2001および 新エネルギー・産業技術総合開発機構 ,
1998のデータから作成)
pH 4 300°C
95% 1-
300°C 80%
300°C pH 4 1-
280°C pH 3.3 ( 2.1)
R-134a 1-
270°C 290°C 80% 60%
280°C pH
250°C 277°C (Hanano and Matsuo, 1990) 220°C
(4)
(ECD) 1 ppt 100 ppt (Adams, 1995; Adams et al., 1999)
(FID) (0.1–0.5 ppm; Hirtz et al., 2010)
( )
( )
( 2.1)
1- 2- 0.03 ppm
0.1 ppm 3
(5)
(CFCs)
(HFCs) (SF6)
( :
; UNEP, 2009)
HFC R-134a (Sugandhi et al., 2009) HFC R-23 (Adams et al., 2001)
(Sugandhi et al., 2009)
( )
Sugandhi et al. (2009)
(PFCs) Darajat PFCs SF6
(United Nations, 1998)
PFCs SF6
1)
2) 3)
2.3
1) 2)
3) 4)
4
2.3.1
4 6 2000 2007
MR-1 M-6 M-13 M-14
2.2 MR-1 (1988 2003
15 ) (10 )
MR-1 M-13
2 6
MR-1 (2000) MR-1 (2003) M-6 (2000) M-13 (2002) M-13 (2007) M-14 (2001)
Sumikawa River
Matsukawa River
0 200 m
Aka
ag
aw
Rive
r
feed point
wellhead b o tt o m hole
M-1
M-1 5
M-2 M-9M-8
MT-24M-N3MT-22
M-1 3
M-5
M-1 2 M-7 M-1 1 M-1 4
M-6
MR -1
MT-23 M. N.図2.2 松川地熱地域の坑跡平面図
1- 2-
2.2
100%
100 kg 3000 kg
2.3
10 t/h 40 t/h 2.2
1.6 kl 4.0 kl 5 45
2.3.2
2.4
(100 ml)
( ) 5%
( ) 0.1 ml (
) 10
1
( 10 )
2 1
4 1 3 1 2 1 1 1
1
表 2. 2 松川地熱地域におけるトレーサー試験方法一覧
Injection well Injection dateTracerWeight of tracer (kg) Volume of tracer (kl) Total concentration (wt%)Injecting time (min) MR-12000/8/6 Ethanol 2-Propanol
768 134
2.4 488 MR-12003/5/132-Propanol Toluenesulfonate
3200 100
4.0 0.3
100 33
25 5 M-62000/9/121-Propanol15303.0 6020 M-132002/10/24Methanol Ethanol
710 680
2.7 5745 M-132007/10/9 2-Propanol12801.6 10012 M-142001/5/18Ethanol 2-Propanol
650 1290
3.6 605
PG
P
Injection well
Water injection
Container of tracer (200 l drum)
Tracer tank (2 kl)
Tracer
Valve
P High-pressure pump
PG Pressure gauge Pressure-proof hose
<Injection method 2>
Where wellhead pressure was positive, tracer solution was once moved into a tracer tank, then injected using a high-pressure pump.
図2.3 トレーサー投入方法
Tracer penetration from wellbore into a reservoir Ground
Measurement of wellhead pressure, checking if it was positive or negative
<Injection method 1>
Where wellhead pressure was negative, containers of tracer were connected to valves attached on wellhead with pressure-proof hose, then tracer solution was injected by suction of the injection well.
Steam line (cross section) Steam sampling valve
Pressure-proof flexible tubing
Cooling coil (stainless steel tubing)
Polyethylene screw cap bottle (100 ml) Cooling water
図2.4 モニタリング試料採取方法
Samples were treated with 0.1 ml of 5% zinc acetate (cadmium acetate) solution to precipitate H2S to protect the GC column and detector.
2.3.3
2.5
(( ) GC-14B) (FID)
Carbopack 80/120 (SPELCO )
( 3mm 3m)
1 l 5 l
1-
2- 0.03 ppm 0.1 ppm
15 20
2.3.4
(1)
( 2.2)
(Normalized Tracer-Production Rate: NTPR ) ( )
C (mg/kg) Gs (t/h) Pt (g/h)
Pt =CGs (2.1)
Pt M (g)
NTPR (h-1)
NTPR=CGs/M (2.2)
NTPR
(NTPR )
NTPR
Combustion gas (hydrogen, air)
Column oven (100°C)
Analytical column (3 m x 3 mm) Carrier gas
(high-purity nitrogen gas)
Vaporizing chamber(200°C)
Flame ionization detector (FID; 250°C) PC
(recording and integration of chromatograms)
D/A converter
図2.5 ガスクロマトグラフによるアルコールの分析方法
Gas chromatograph Shimadzu GC-14B Auto injector
(maximum volume 10 μL)
(2)
L ( ) t (h)
L t
( ) L t v (m/h)
v=L/t (2.3)
2.4
2.6
(h) (m) (m/h)
(wt%) 2.3
2.4.1 MR-1 (2000)
2000 8 6 2- 48 wt%
8 MR-1 M-1 M-5 M-12
30 M-1 120 M-5 M-12
M-1 M-5 M-12
(NTPR ) 2.7
NTPR 81
M-12
M-5 M-1 ( 2.3) M-5 M-12
2- NTPR( )
Sumikawa River
Matsukawa River
0 200 m
Aka
ag
aw
Rive
r
M-1
M-1 5
M-2 M-9M-8
MT-24M-N3MT-22
M-1 3
M-5
M-1 2 M-7 M-1 1 M-1 4
M-6
MR -1
MT-23 M. N. feed pointwellhead bottom hole
Legend tracer flow path (direction)
図2.6 松川地熱地域のトレーサー流動経路
表 2. 3 松川地熱地域におけるトレーサー試験結果一覧
Injection well Injection dateTracer-returning well TracerInitial detection time (h) Tracer flow distance (m) Tracer velocity (m/h)Tracer recovery (%) MR-12000/8/6 M-1 M-5 M-12
Ethanol 2-Propanol Ethanol 2-Propanol Ethanol 2-Propanol
30 30 145 216 121 192
223 223 396 396 377 377
7 7 3 2 3 2
1.5 2.4 5.0 3.3 25 17 MR-12003/5/13M-5 M-8 M-12 M-15
2-Propanol 2-Propanol 2-Propanol Toluenesulfonate 2-Propanol
192 1510 96 171 1850
535 239 131 131 278
3 0.2 1 0.8 0.2
0.13 0.09 6.8 6.2 0.07 M-62000/9/12M-8 M-131-Propanol 1-Propanol10 49394 26139 5 72 10 M-132002/10/24M-6Methanol Ethanol70 45261 2614 6 14 8.1 M-132007/10/9 M-72-Propanol1817710– M-142001/5/18M-7 M-11Ethanol Ethanol 2-Propanol
17 3.8 3.8
524 323 323
31 85 85
0.06 0.27 0.21
0.00 0.05 0.10 0.15 0.20 0.25 0.30 0.35
0 10 20 30 40 50 60 70 80 0.00
0.05 0.10 0.15 0.20 0.25 0.30 0.35 N T PR (1 0
-3h
-1)
Elapsed time (day)
N T PR (1 0
-3h
-1) M-1
M-5 M-12 Ethanol
2-Propanol M-1 M-5 M-12
図2.7 MR-1試験(2000)で得られたトレーサー回帰曲線 (M-1, M-5, M-12)
NTPR
4 2.4.2 MR-1 (2003)
MR-1 2003 5 13 2-
100 wt% 25 MR-1 MR-1 (2000)
( 2.2)
MR-1 (2000) M-5 M-12
M-8 M-15 MR-1 (2000)
MR-1 (2000) M-1
96 192 M-5 M-12 M-8 M-15
1510 1850 2.8
M-5 M-12 MR-1 (2000)
M-8 M-15
2.8 M-8 M-15
M-5 M-12 M-8 M-15
M-8 M-15
(0.2 m/h 0.1 wt% , 2.3)
M-5 5 t/h M-5 NTPR M-12
( 2.8)
M-5 M-12 29
M-5 M-12 NTPR
( )
33 wt% 5 MR-1 ( 2.2)
M-12 ( 2.3) 3
-5 0 5 10 15 20 25 30 35 0.0000
0.0005 0.0010 0.0015 0.0020 0.0025
-5 0 5 10 15 20 25 30 35 0.00
0.05 0.10 0.15 0.20
N T PR (1 0
-3h
-1)
Elapsed time (day) M-12
N T PR (1 0
-3h
-1)
Elapsed time (day) M-5
図2.8 MR-1試験(2003)で得られたトレーサー回帰曲線 (M-5, M-12)
2-Propanol
2-Propanol
2.4.3 M-6 (2000)
2000 2 7 10 23 9 M-6
( 20 t/h ) 9
12 1- ( 60 wt%) 20 M-6
M-8 M-13 2.9
10 M-8
44 39 m/h
M-8 73 wt%
M-8
2 NTPR
M-13 49 44
NTPR 6 M-8
5 m/h 10 wt% M-8
M-8 2.4.4 M-13 (2002)
2002 10 7 11 4 1 M-13
( 36 t/h ) 10
24 57 wt% 45
M-13 M-6
M-13 M-6 M-6
(2000) M-6 M-13
( 2.6)
M-6 2.10 70
75
NTPR M-6 4 – 6 m/h
M-6 8 – 14 wt% ( 2.3) MR-1 (2000)
NTPR
4
0 10 20 30 40 0.0
1.0 2.0 3.0 4.0 5.0 6.0
M-13 M-8
N T PR (1 0
-3h
-1)
Elapsed time (day)
1-Propanol
図2.9 M-6試験(2000)で得られたトレーサー回帰曲線 (M-8, M-13)
0 10 20 30 40 50 60 70 80 0.00
0.10 0.20 0.30 0.40
N T PR (1 0
-3h
-1)
Elapsed time (day)
Ethanol Methanol M-6
図2.10 M-13試験(2002)で得られたトレーサー回帰曲線 (M-6)
2.4.5 M-13 (2007)
M-13 10 5 10 23 18
M-7
2.11 M-13
48 t/h 20 t/h
10 9 2- ( 100 wt%) 12
M-13 M-13 M-6
M-7 M-13
2.11 18 M-7
58 M-13
( 2.3 )
2.4.6 M-14 (2001)
M-14 M-14
M-14 2001
5 18 2- ( 60 wt%) 5
M-14 5 9 6 5
23600 t
2- M-7 M-11 M-11
2.12 (
) 4 M-14
M-11( 2.6) M-11 M-14 M-7 17
40
M-11 M-7 85 m/h 31 m/h
0.00 0.01 0.02
0 10 20 30 40 50 60 0
20 40 60 N T PR (1 0
-3h
-1)
Elapsed time (day) G
ia t M-1 3 (t/ h )
M-7
2-Propanol
M-13
Water injection rate (G
i)
図2.11 M-13試験(2007)で得られたトレーサー回帰曲線 (M-7)
0 10 20 30 40 50 60 70 0.00
0.05 0.10 0.15 0.20 0.25
N T PR (1 0
-3h
-1)
Elapsed time (h)
M-11 Ethanol M-11 2-Propanol
M-7 2-Propanol
図2.12 M-14試験(2001)で得られたトレーサー回帰曲線 (M-7, M-11)
M-11
40 ( 2.12)
30 80
0.3 wt% ( 2.3)
M-14
2.12 2-
NTPR
4
2.5
(1)
1.6 kl 4.0 kl ( 2.2) 5
45
( 44 84 )
(2)
M-14(2001)
(3)
( ) 4
( 1- 2- )
4
NTPR
(4)
4 ( 1-
2- )
81 1- 44
2- 84
( )
2.6
1)
2)
3)
4 ( 1- 2-
)
4) ( 40–80 )
5)
Adams, M. C. (1995) Vapor, liquid and two-phase tracers for geothermal systems. Proceedings of the 1995 World Geothermal Congress, Florence, Italy, May 18-31, 1875-1880.
Adams, M. C., Beall, J. J., Hirtz, P., Koenig, B. A., and Smith, J. L. B. (1999) Tracing effluent injection into The SE Geysers - a progress report. Geothermal Resources Council Transactions, 23, 341-345.
Adams, M. C., Yamada, Y., Yagi, M., Kondo, T., and Wada, T. (2000) Stability of methanol, propanol, and SF6 as high-temperature tracers. Proceedings of the 2000 World Geothermal Congress, Kyushu-Tohoku, Japan, May 28-June 10, 3015-3019.
Adams, M. C., Beall, J. J., Enedy, S. L., Hirtz, P. N., Kilbourn, P., Koenig, B. A., Kunzman, R., and Smith, J. L. B. (2001) Hydrofluorocarbons as geothermal vapor-phase tracers. Geothermics, 30, 747-775.
Adams, M. C., Yamada, Y., Yagi, M., Kasteler, C., Kilbourn, P., and Dahdah, N. (2004) Alcohols as two-phase tracers. Proceedings of 29th Workshop on Geothermal Reservoir Engineering, Stanford University, Stanford, CA, USA, January 26-28, 2004, SGP-TR-175, 8p.
Giggenbach, W. F. and Goguel, R. L. (1986) Methods for the collection and analysis of geothermal and volcanic water and gas samples. Department of Scientific and Industrial Research, Chemistry Division, New Zealand, 51p.
Hanano, M. and Matsuo, G. (1990) Initial state of the Matsukawa geothermal reservoir:
reconstruction of a reservoir pressure profile and its implications. Geothermics, 19, 541-560.
Hirtz, P. N., Kunzman, R. J., Adams, M. C., Roberts, J. W., Sugandhi, A., Martiady, K., Mahagyo, P., and Iman, A. S. (2010) First multi-well vapor and two-phase tracer test in a geothermal reservoir, using perfluorocarbons and alcohols. Proceedings of the 2010 World Geothermal Congress, Bali, Indonesia, April 25-29, 12p.
McLinden, M. O., Klein, S. A., Lemmon, E. W., and Peskin, A. P. (1998) Thermodynamic and transport properties of refrigerants and refrigerant mixtures database (REFPROP). Standard Reference Database 23 version 6.01, National Institute of Standards and Technology (NIST), Gaithersburg, MD. 41p.
(1983) . 547p.
Poling, B. E., Prausnitz, J. M., and O'Connell, J. P. (2001) Fluid Phase Equilibria in
Multicomponent Systems. The properties of gases and liquids, 5th ed., McGraw Hill, 8.1-8.204.
Poling, B. E., Thomson, G. H., Friend, D. G., Rowley, R. L., and Wilding, W. V. (2008) Physical and Chemical Data. In Green, D. W. and Perry, R. H. (Eds.), Perry's Chemical Engineers' Handbook, 8th ed, McGraw-Hill, 2–1-2–517.
(1998) 9 /
/ . 200p.
Sugandhi, A., Hirtz, P. N., Mahagyo, P., Nordquist, G. A., Martiady, K., Roberts, J. W., Kunzman, R. J., and Adams, M. C. (2009) Results of the first application of perfluorocarbons and alcohols in a multi-well vapor and two-phase tracer test at the Darajat geothermal field, Indonesia, and implications for injection management. Geothermal Resources Council Transactions, 33, 871-878.
United Nations (1998) Kyoto protocol to the United Nations framework convention on climate change. 20p.
UNEP (2009) Handbook for the Montreal Protocol on substances that deplete the ozone layer.
Ozone Secretariat United Nations Environment Programme, Nairobi, Kenya, 572p.
3 3.1
( )
( 2 )
3.2 3.2.1
(1)
3.1 (Goyal, 1995)
(2)
( )
(Goyal,
1999) ( )
3.2 (Goyal, 1999)
(3)
3.3 (Giovannoni et al., 1981)
Injection Recovery Factors in Southeast Geysers, California 173 Recovery factors (RI O due to injection into CA 956A-1
In this study, a total of 13 production wells are considered: eight wells located within the dashed outline showing maximum injection benefit, and the five nearby wells located outside this area exhibiting some injection benefit (Fig. 2). The combined normalized flow rate of all 13 wells at 110 psig (758.4 kPag) wellhead pressure (WHP) is presented in Fig. 5 from January 1988 to May 1993. Due to conversion of production well CA 956A-1 into an injection well, the flow rate of only 12 wells is plotted after October 1989.
Decline rates, shown in Fig. 5, are estimated by excluding the data points affected by plant outages and testing. The 13 production wells, including CA 956A-1, exhibit an annual exponential decline of 26% in 1988 and 20% in 1989 before the start of injection into CA 956A-1 in October 1989. During the next four months, the flow rate increased by 110 klbm/hr (49.9 t/h).
This increase was experienced by the 12 wells (13 wells minus CA 956A-1) and was over and above the flow rate of the original 13 wells. Subsequently, the flow rate of these wells declined but at a moderate rate of 10.5%, as shown in Fig. 5. Injection into CA 956A-1 has helped in two ways: in reducing decline rates by 9.5%, and in providing an increase in the flow rate. The injection rate averaged over a month since start-up in October 1989 is also shown in this figure, and ranges from 300 to 800 gpm (18.9 to 50.5 l/s).
The hatched area in Fig. 5 is used to calculate the recovery of the injected water. In these calculations, it is assumed that the original 13 wells would have declined at a 20% harmonic rate, starting in October 1989. This assumption is consistent with the behavior of these wells in 1988 and 1989 (Fig. 5), where a moderation in decline rate from 26 to 20% is seen as a result of a decrease in flow rate. This assumption is also supported by the modeling effort of the Technical Advisory Committee appointed by the California Energy Commission (GeothermEx, 1992), in which an output projection of The Geysers field matched a harmonic decline trend. Addition- ally, recovery factors calculated by using harmonic decline assumption will be conservative compared to those using exponential or hyperbolic trends.
Cumulative steam recovery, as well as recovery factors (RF) for three years, are shown in
FLOW RATE OF WELLS SURROUNDING CA 956A-1
FLOW RATE NoRMAu Jl'L~n AT llO PSIG w l l F
1,500 3,000
1,000
6OO
260
- 13 Prod. We~ -v 1_
-"'~,_. _ ~ Exponenmd
12 ProducUon Welb ,n
" ~ . • ° o
S l a i m P r o d u d l e m ~. i wedv ~"~ i ~ a ~ a i i ~ . ,
• ,~, i ~- i "IL p T J¢ ~
l.n, lecaon
,
2,600
M 8 9 9 0 91 9~ 9 3 9 4
Fig. 5. Effect of injection into C A 956A-1 on s o m e s u r r o u n d i n g p r o d u c t i o n wells.
.,000
1,500
1,000
' 0
図3.1 注水による蒸気生産流量増量の例 (Goyal, 1995に加筆)
The recovery of the injected water as steam
K[P[ Goyal:Geothermics 17 "0888# 2 08 04
Fig[ 7[ Temporal variation in wellhead temperature and enthalpy for CA 847!03 well[
front "Figs[ 00 and 01#[ A further increase in steam decline rate can be observed in 0885 and 0886[ Some of these decreases in steam ~ow rate can also be attributed to scale deposits in fractures and changes in NCPA operations starting in early 0885[
7[ Heat transfer in a homogenous porous reservoir
By the time of the arrival of the thermal front in September 0883\ injection wells CA 845A!0 and CA 845A!1 had accepted a combined water volume of 33[3 million barrels "6 billion liters# at a wellhead temperature of 54 004>F "07 35>C#[ This amount a}ected producers located within the dashed outline that surrounds an area of approximately 095 acres "9[32 km1# on Fig[ 0[ At that time\ steam had a wellhead enthalpy of approximately 0122 Btu:lbm "1757 kJ:kg#\ as shown in Fig[ 2[ A downhole enthalpy of 0150 Btu:lbm "1822 kJ:kg# can be estimated\ allowing for a wellbore heat loss of 17 Btu:lbm "54 kJ:kg# as observed in the downhole P:T:S survey of CA 845A!
5 in December 0882[
For an average 49) recovery\ the injected water needs to extract 8[2 trillion Btu
"8[7 trillion kJ# of heat from rocks to convert from 89>F "21>C# water to a superheated
図3.2 注水による生産蒸気の温度低下の例 (Goyal, 1999に加筆)
(171°C) (204°C)
(260°C) (2884 kJ/kg)
(2791 kJ/kg)
(2698 kJ/kg)
50 100 150 200 2 50
7 -
x
* 6 - 0 0) al Dl 5-;
a 4-
Figure 4 Injection rate in well w 0 and total production increase in wells wl to w14. Wellhead temperature and pressure in the seven most produc- tive wells of the area. Average g a s content in wells wl to w14.
-80-
図3.3 注水による蒸気中の非凝縮性ガス濃度低下の例 (Giovannoni et al., 1981に加筆)
Non-condensable gas concentration without water injection3.2.2
3.3
MR-1 M-6 MR-1 (2000,
2003) M-6 (2000)
3.3.1 MR-1
MR-1 1988 1989
(Hanano et al., 1991) 3.4 3.5
10 t/h 35 t/h 15 t/h 35 t/h
M-1
190°C 150°C
( 3.5) 2 (2.4.1 ) MR-1 (2000) M-1
M-1 ( 3.5)
M-5
( 3.4 Hanano et al., 1991)
M-5 50
190°C 150°C ( ) ( 3.5) 15 t/h 25 t/h
10 t/h (Hanano et al., 1991) MR-1 (2000, 2003) M-5
(2.4.1 )
Hanano et al. (1991) 1989 MR-1 M-1
Steam Production and Secondary Heat Recovery from Matsukawa Reservoir 285 reinjection, the steam temperature of M l b decreased significantly. H o w e v e r , M l b showed only this decrease in steam temperature and did not show any other change.
As seen in Fig. 7, the steam production rate of M5 increased suddenly on 6 October 1989, from approximately 15 t/h to 25 t/h on average. At the same time, though it is not shown in Fig.
7, production of hot water also increased from nearly zero to approximately 10 t/h. This increase occurred at the total cumulative reinjection of 36,000 tons. Because of the difficulties of tracer testing in this area as described above, the precise evaluation of the recovery rate of reinjected
(barG) Po
(barG)
:l
(barG)
~barG)
M R - 1 40 :
30 ¢/ - l"
( t / h )
C R
+ . . . . .
No.5
I{Jfl9
1!t
( t 'h ) 2010f . . . --"
8 0 . 0 0 0
70~X)0 6 0 0 0 0
~ , 0 0 0
4o, o0o c~) 30OO0 2°.000
~q000 0
Fig. 6. Record of the first reinjection experiment. (CL), the well closed; CR, cumulative reinjection; (EM), the well emitted; GR, reinjection rate; Gs, steam production rate; OH, power plant overhaul; T, steam temperature; Po, well
head pressure in bar-gauge.
T 0
4oJ r ~--~,.,,,----~, ~ ~ . ,__,_,...~...,...~__..~ _ -,J 22
j M-2 G, ~ t200
L t ~ - - T
t h ) 2 0 I ,,FM) ~160
,Oo ... ... - ...
,o, ... ... [,,o
O J - - ~ - - . . . . . . -- . . . . - - -
7 \ - - 240
) 40-1 "I" ~ ~ T
t h I _ _ . - - ~ - - - - ~ - ~ " - " - - ~ - ' ~ - - - ' - ~ r ' ~ - ~ - - - - ~ _ . " ~ ~ Z 0 0 CC)
~ - T ' ~ (EL)
30 -I 'CL) p, . . . 1180
hS$8 1989
,t200
" " ' / 'V'IT6o(C {
図3.4 注水井MR-1を用いた注水試験結果 1回目 (Hanano et al., 1991)
286 Mineyuki Hanano et al.
50-
40-
G R
( t h ) 30
2(]-
10-
0 1 1989. August
G R t f I "
lb 30 3b' t'o 2'0 3'6 lb 26 3'0' 1~ 2'0
91 101 111
18 ~ Ti me
- 60.000
- 5 0 . 0 0 0
• 4 0 , 0 0 ~
CR
- 3 0 . 0 0 0 t/
-20,000
3'~ 10 121
-10.g00
M - l b
lO ~ G ;
8 -
Gs ( t h ) 6
4
2 0
1
1989. August
1'0 20 30' I0 20 30 I
9 1 ~ Tim~O t
190 180
® ®
170
i f ] T i q r
1~0 20 30 10 20 30 10
11 1 12 1
o v e r h a u l i n g
CC )
G s
( t h ) 30
11 o
(LC)
I
T
190
5 = . . . 150
g I 1'o z'o a'o' 9 1 1'o 2'0 3~' ;o ~'o 3~' 11 1 ~ z'o 3b' 12 1 lo ----* T i me
1989. August
Fig. 7. Record of the second reinjection experiment. CR, cumulative reinjection; GR, reinjection rate; Gs, steam production rate; (LC), lost circulation in the drilling at M12; T, steam temperature. Well head pressures had been
constant at 3.9 bar-gauge in Mlb and 4.0 bar-gauge in MS.
160 180
T
~7o CC )
図3.5 注水井MR-1を用いた注水試験結果 2回目 (Hanano et al., 1991に加筆)
Saturation temperature
Saturation temperature
M-1
M-5 (
20 t/h) MR-1 ( 20 t/h ) 100%
M-5
MR-1
32% ( 2.3) M-5
( 2.3)
M-6 (2000) 86% 0.21% 14%
MR-1 ( 20 t/h) M-5 M-5
( 20 t/h)
M-5
M-12 M-5 ( 2.6) M-5 MR-1
M-12 M-12 MR-1
M-1 M-5
MR-1 M-12 3.6
1993
1994 1997 1998 MR-1 0 t/h
M-12 M-12
30 t/h
M-12 MR-1 (2000)
M-12
図3.6 注水井MR-1への注水流量と生産井M-12の蒸気・熱水流量の履歴
010 20 30 40 50
0 10 20 30 40 50
1987 1988 1989 1990 1991 1992 1993 1994 1995 1996 1997 1998 1999 2000 2001 2002 2003 2004
0 50 100 150
G
w(t/ h )
Date G
s(t/ h ) G
i(t/ h )
Production well M-12 Steam flow rate
Production well M-12 Water flow rate
Injection well MR-1 Injection rate
( ) M-12
MR-1 (2003)
M-12 ( 2.3) M-12
3.7
(Grant and Bixley, 2011, pp.42-43) MR-1 M-12
( 3.7)
3.3.2 M-6
MR-1 M-6
M-8 M-13
3.8 M-8 M-13
0.45 MPa 145°C
M-6 M-8 ( 30°C) (
3.8) M-6 20 t/h 5 6 M-8
M-8 10 t/h
0.7 wt% ( 3.8) M-8
M-8
0 5 10 15 20 25 30 35 0.00
0.05 0.10 0.15 0.20
N T PR (1 0
-3h
-1)
Elapsed time (day) Sodium
toluenesulfonate 2-Propanol M-12
図3.7 MR-1試験(2003)における二相および液相トレーサーの回帰曲線 2-Propanol as a two-phase tracer
Sodium toluenesulfonate as a liquid phase tracer
図3.8 注水井M-6の注水流量と生産井M-8およびM-13の蒸気温度,生産流量,
非凝縮性ガス濃度の履歴
010 20 30
Injection rate (t/h)
140 160 180 200
Steam temp. (
°C)
0 10 20 30
Flow rate (t/h)
01-Jan-99! 01-Jan-00! 01-Jan-01! 01-Jan-02!
Date 0.5
1.0 1.5 2.0
NCG (wt%)
Group: 8 Group: 5 Group: 6 Group: 10 Group: 10 Group: 7 Water injection into well M-6
tracer injection
M-8 M-13
M-8
M-13
M-8 steam
M-8 water
M-13 steamsaturated temperature super-heated
temperature
M-8 1
( 3.8) M-8
M-8 ( 2.9) 5
M-8 10
M-8 M-8 72%
M-8
M-8 M-6 (20 t/h) M-8
14 t/h M-8 (2000
9 1 2000 10 1 ) M-8 38 t/h (
28 t/h 10 t/h) ( ) 20 t/h
M-8 18 t/h
M-8
M-6 M-8
M-8
M-5
M-13 M-8 M-6 ( 20°C 30°C)
M-13 M-8
4 M-13
M-13
M-13 7
M-13 M-8
M-8 M-13
M-8 M-13
M-8 M-13 ( 2.3)
M-8 M-13
M-8 M-13
3.4
M-14 (2001) M-14
M-14
M-14
M-14 (2001) M-14 M-7 M-11
(2.4.6 2.6)
M-14 M-7 M-11
3.9 M-14 M-7 M-11
M-14 30 t/h 70 t/h
M-7 M-11 10 t/h
M-14
M-7 M-11 30% 25%
(0.3% 2.3)
図3.9 生産井M-14,M-7およびM-11の蒸気流量の履歴
2000 2001 2002 2003 2004
0 10 20 30 40 50 60 70 80
Date G s (t/ h )
M-7
M-11 M-14
3.5
本章では,トレーサ
。
1)2)
3)
4) 5)
Giovannoni, A., Allegrini, G., and Cappetti, G. (1981) First results of a reinjection experiment at Larderello. Proceedings of 7th Workshop on Geothermal Reservoir Engineering Stanford University, Stanford, CA, USA, December 15-17, 1981, SGP-TR-55, 77-83.
Goyal, K. P. (1995) Injection recovery factors in various areas of The Southeast Geysers, California.
Geothermics, 24, 167-186.
Goyal, K. P. (1999) Injection related cooling in the Unit 13 area of The Southeast Geysers, California, USA. Geothermics, 28, 3-19.
Grant, M. A. and Bixley, P. F. (2011) Geothermal reservoir engineering. 2nd ed., Academic Press, 359p.
Hanano, M., Ohmiya, T., and Sato, K. (1991) Reinjection experiment at the Matsukawa
vapor-dominated geothermal field: Increase in steam production and secondary heat recovery from the reservoir. Geothermics, 20, 279-289.
4 4.1
( : Bertrami et al., 1985; Cappetti et al., 1995; Giovannoni et al., 1981; : Barker et al., 1995; Chasteen, 1975; Enedy et al., 1991; Gambill, 1990; Goyal, 1999; Goyal and Box, 1992; Stark et al., 2005)
( )
( )
Adams et al. (2001)
(single-stage boiling) (multiple-stage boiling) (continuous boiling)
( 0.03 )
Adams et al. (2001)
MR-1 (2000) M-13 (2002) M-14
(2001)
B (–)
C ( )
R (J/K mol)
C* (–)
T (K)
V (dm3/mol)
x (–)
y ( )
∆y ( )