Takato Hirayama1 and Ichiro Arakawa2
1Department of Physics, Rikkyo University, Nishi-Ikebukuro, Toshimaku, Tokyo 171-8501 JAPAN
2Department of Physics, Gakushuin University, Mejiro, Toshimaku, Tokyo 171-8588 JAPAN
E-mail: [email protected], [email protected]
Abstract. This paper reviews our progress on the desorption induced by electronic transitions (DIET) in rare gas solids by selective excitation of valence excitons. Observation of metastable atoms desorbed by excitonic excitation gives us direct information on the exciton-induced desorption processes in rare gas solids. Validity of three desorption mechanisms, cavity ejection, excimer dissociation, and internal sputtering, are demonstrated by systematic measurements of kinetic energies and angular distributions of desorbed particles.
Absolute yield of total and partial desorption was measured, which can lead us to the quantitative understanding of exciton-induced desorption processes.
Submitted to: J. Phys.: Condens. Matter
1. Introduction
Desorption of atoms from the surface of solid rare gases (RGS) has been extensively studied in the past two decades (Zimmerer 1994, Arakawa 1998). RGS is a model system to investigate the dynamic processes of desorption induced by electronic transitions (DIET) because of its simplicity and similarity of the electronic structure to the isolated atoms.
The correlation between exciton creation and atomic desorption in RGS was first suggested by the electron stimulated desorption (ESD) experiment for solid Ar (Coletti et al 1984). Feulner et al (Feulner et al 1987) clearly demonstrated that the desorption of atoms can be initiated by the creation of surface and bulk excitons for monolayers and multilayers of Ar and Kr by state-selective excitation with synchrotron radiation. Further breakthrough was achieved by selective detection of desorbed species (Kloiberet al 1988, Kloiber & Zimmerer 1989) by combining mass- spectroscopic and luminescence technique. They measured partial desorption yields of excited atoms innp5(n+ 1)s (3P1 and1P1),np5(n+ 1)s (3P0,2), andnp5(n+ 1)p states (n= 2 for Ne,n= 3 for Ar) separately from the total yield.
Detailed information on the exciton-induced desorption processes was also provided by low energy electron impact experiments (Arakawa et al 1989, Weibel et al 1993, Leclercet al 1990, Leclercet al 1992). They discussed the desorption mechanism using the results on the kinetic energy and angular distribution of desorbed metastable atoms. Another important contribution to this field was ion-impact
experiments (Ellegaard et al 1986, Schou 1987, Johnson & Brown 1982, Reimann et al 1984, Reimannet al 1988). They clearly demonstrated the significance of the exciton-induced desorption even in the ion-induced sputtering phenomena (Johnson
& Inokuti 1983).
For the desorption induced by exciton creation from the surface of solid rare gases, excimer dissociation (ED) and cavity ejection (CE) mechanisms were proposed (Colettiet al 1984, Coletti & Debever 1984) and have been confirmed experimentally.
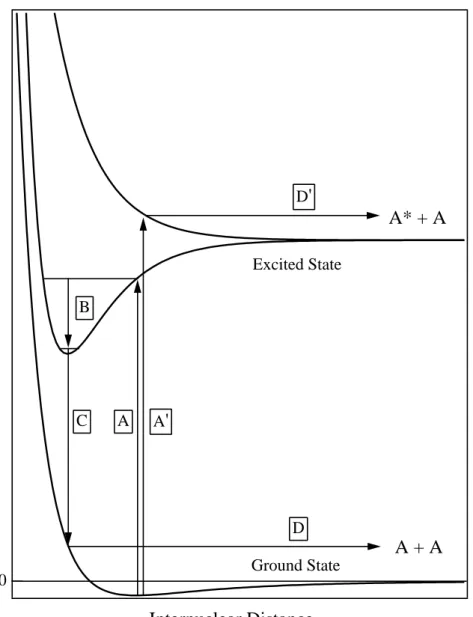
The desorption via ED process is due to a dissociation of a molecular type exciton similar to the dissociation of an excited dimer (excimer) in the gas phase. Potential curves relevant to the ED process is schematically shown in figure 1. Initial excitation (A) forms a vibrationally excited excimer. During or after the vibrational relaxation (B), the excimer can decay to the ground state (C), which leads to the desorption of a ground state atom. Excitation to higher level (A’) can results in the desorption of an atom in excited state (D’).
Figure 2 shows the cavity ejection mechanism schematically. Negative electron affinity (or positiveV0value) of the matrix is known to be essential for the desorption of an excited atom via CE mechanism to have a repulsive interaction between the excited atom and the surrounding ground state atoms. While all rare gases in gas phase have negative electron affinity, the sign changes to positive for solid Kr and solid Xe because of their large polarizability (Schwentner et al 1975). Systematic measurements (Runne et al 1993) revealed a clear correlation between the sign of the electron affinity and the desorption via CE mechanism. This mechanism has been discussed by molecular dynamics calculation for solid Ne (Dutkiewicz et al 1996) and solid Ar (Cui & Johnson 1989). The calculated results for the kinetic energies of desorbed excited atoms were in good agreement with the experimental results. It should be worth noting that desorbed atoms via CE process are essentially in excited states.
Internal sputtering (IS) mechanism is another process for the desorption of excited and ground state atoms. In ED process, dissociation of an excimer release the kinetic energy in the order of 1 eV. If ED occurs in the vicinity of the surface, this large energy release may blow off many atoms in/near the surface layer, which can significantly contribute to the desorption. IS process has been quantitatively discussed by a molecular dynamics calculation for solid Ar (Cui et al 1988) and experimentally observed by our group (Arakawa et al 1995). IS process can be also possible in the desorption via CE mechanism (Dutkiewicz et al 1996). An excited atom created just below the surface may be ejected into the vacuum via CE mechanism, thereby pushing aside the atoms in the overlayer, which may also desorb due to the small cohesive energy of rare gas solid.
Here, we present our results on the photo-desorption experiments from the surface of solid rare gases, mainly solid Ne, by selective creation of valence excitons by synchrotron radiation. Validity of the desorption mechanisms described above will be discussed with our experimental results on the excited atom desorption. We also show the absolute desorption yields, which can lead us to the quantitative understanding of the exciton induced desorption processes.
2. Experimental
2.1. Beam line
Experiments presented here were performed using the beam line BL5B, UVSOR Facility of the Institute for Molecular Science, Okazaki. Detail of the beam line is described elsewhere (Sakurai et al 1989, Sakurai et al 1990). A plane grating monochromator (PGM) covers a wavelength range of 2 to 240 nm by a combination of three gratings (G1- G3) and 7 post mirrors (M02- M62). The wavelength resolution (λ/∆λ) at the region of excitonic excitation in rare gas solids is 100 to 500 depending on the width of the exit slit.
A photon beam monitor was used for the measurements of absolute number of photons incident on the sample surface (Hirayama et al 1997). It consists of a beam defining aperture of 3 mm in diameter and a thick Au sheet. Negative voltage (-45 V) was applied to the Au sheet by a dry battery. The number of photons was estimated from the photoemission current emitted from the Au surface and the photoelectric yield (number of electrons per incident photon) of Au reported by Samson (Samson 1964), and was typically in the order of 109 s−1.
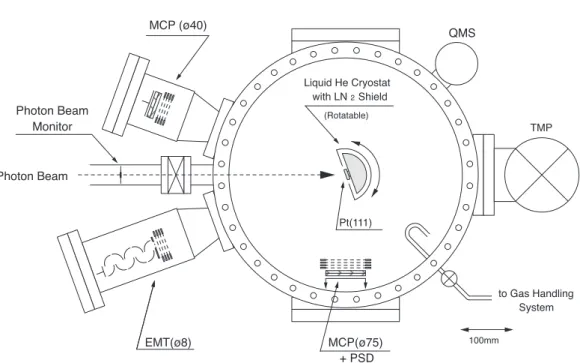
2.2. Main chamber
Schematic of the main chamber is shown in figure 3. The chamber was evacuated by a turbo molecular pump and a Ti-sublimation pump, and the base pressure was about 5×10⁻⁹ Pa.
The sample film was prepared on a Pt(111) disk of 8 mm diameter. This was fixed to a liquid He cryostat and cooled down to about 6 K. The cryostat was surrounded by a liquid N2-cooled heat shield. The sample film was condensed on the Pt disk by filling the chamber with a sample gas to a pressure of 10−6 ∼ 10−4 Pa. The film thickness was estimated from the exposure assuming the condensation coefficient to be unity.
2.3. Time-of-flight measurements
For the measurements of the time-of-flight spectra of desorbed metastable atoms, the pulsed incident light must be used. Since the kinetic energy of desorbed species does not exceed a few eV, the flight-time is in the order of 10−5 ∼10−3s, which is much longer than the interval of synchrotron radiation pulses from the storage ring even in single bunch operation. Therefore we have used a mechanical chopper for pulsing the incident light. A disc of 40 cm in diameter was mounted and driven by a DC motor via a rotational feedthrough. The FWHM and the frequency of the photon pulse were typically 15µs and 400 Hz, respectively.
Detected metastable atoms were innp5(n+ 1)s (3P0,2) state, which have lifetimes much longer (in Ne case, 430 s forJ = 0, 24.4 s forJ= 2 (Small-Warren & Chiu 1975)) than the flight time between the sample and the detector (10µs∼1 ms).
2.4. Absolute desorption yield measurements
2.4.1. Metastable atom desorption Absolute yield of metastable atom desorption was determined by measuring the intensity of the desorbed metastable atoms, number of incident photons, geometrical conditions, and the angular distribution of the
desorption (Hirayama et al 1997). Desorbed metastable atoms are detected by an open electron multiplier tube (EMT, Hamamatsu, R595) with a CuBe dynode as the first electrode. The EMT was fixed at a distance of 360 mm from the sample in the normal direction of the sample. The diameter of the entrance of the EMT is 8 mm which corresponds to the detection solid angle of 3.1×10⁻⁵ sr.
The absolute desorption yield,YMwas calculated using the following equations,
YM=NM×F(Ωd, n) (1)
NM= CM ηEMT × 1
Nph
(2) whereNM andCMare the absolute yield detected by EMT per photon and detected count rate of the metastable atoms, respectively, ηEMT is the detection efficiency of EMT for metastable atoms, F(Ωd, n) is a factor which takes into account the geometrical condition and the angular distribution of the desorbed atoms, and is calculated as follows,
F(Ωd, n) =
∫ 2π 0
∫ π2
0
cosnθdθdφ
∫
Ωd
cosnθdΩ
(3)
where Ωd, θ, φ, and cosnθ are the solid angle of the detector, the polar angle, the azimuth angle, and the fitting function for the angular distribution of the desorbed atoms, respectively.
The quantum efficiency of EMT for metastable atoms has been reported by several authors (Borst 1971, Alvari˜no et al 1984) to be 0.12 and 0.035 for Ne and Ar, respectively. The angular distributions of the desorbed metastable atoms from solid Ne by exciton creation have already been reported by our group (Arakawaet al
1995, Sakuraiet al 1995, Weibel et al 1993).
2.4.2. Total desorption Absolute yield of total desorption from the surface of solid rare gas was estimated from the partial pressure change in the main chamber during the irradiation of light, number of incident light, and the pumping speed of the pumping system for the desorbed gas (Arakawaet al 2000, Arakawaet al 2003, Adachi et al 2003).
The desorption rate was calculated from the pumping speed for corresponding gas and the rise of the partial pressure in a vacuum chamber during irradiation of the sample. The pumping speed of a turbomolecular pump and cold surfaces was 0.14± 0.01 m3/s in total for Ne, which was determined from the Ne pressure measured by an extractor gauge installed in the main chamber and from the flow rate calibrated volumetrically using a reference volume and a Baratron pressure gauge as reference.
The small rise of the partial pressure during irradiation was detected by a quadrupole mass spectrometer which was calibrated against the extractor gauge for each run of the experiment. It should be noted that the uncertainty of the relative sensitivity of the extractor gauge for each gas was cancelled in the present method for determining the desorption rate.
3. Experimental Results and Discussion
3.1. Excited atom desorption
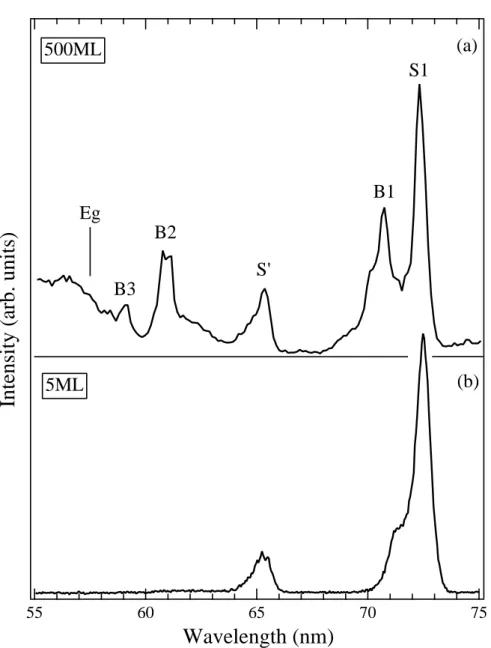
3.1.1. Wavelength dependence of metastable desorption yield. Figure 4 shows desorption yield of the metastable atoms in 3P0,2 states via the cavity ejection mechanism from the surface of solid Ne as a function of the wavelength of the incident light for sample thicknesses of (a) 500 ML and (b) 5 ML. Observed peaks were assigned to a series of bulk (B) and surface (S) excitons (Saile & Koch 1979).
The close correlation between exciton creation and metastable desorption was clearly demonstrated. It should be noted that only the surface peaks (S1 and S’) are observed at the thin sample.
3.1.2. Time-of-flight spectra of desorbed metastable atoms. Figure 5 shows time-of- flight spectra of desorbed metastable atoms from the surface of solid Ne measured at the wavelengths of 72.3 nm, 70.7 nm, 65.4 nm and 61.1 nm, which correspond to the excitation energies of the 1st order surface (S1) and bulk(B1) excitons, 2p53p-type surface exciton (S’) and the 2nd order bulk exciton (B2), respectively.
The strongest peak at flight time tf = 0 is due to scattered and emitted light from the sample. The higher kinetic energy peak (tf ∼100µs,Ek= 1.4±0.1 eV) is due to metastable Ne atoms desorbed via the excimer dissociation (ED) process. ED peak was observed in the TOF spectra by S’ and B2 excitation but not in S1 and B1 excitation. This is because only ground state atoms, which can not be detected in the present measurements, desorbed by the excitation of the 1st order excitons.
The peak attf∼250µs is due to the cavity ejection (CE) mechanism. In the CE scheme, the motive force of the desorption of excited atom is the repulsive interaction between the excited atom and the surrounding ground state atoms, therefore, the kinetic energy of desorbed excited atoms should depend on the electronic state of the excited atom. The kinetic energies of CE peaks for S1, B1, and B2 excitation are found to be the same within the experimental uncertainty (Ek = 0.18± 0.02 eV).
This fact suggests that the desorbed Ne*(CE) at S1, B1, and B2 excitation are, at least when leaving from the surface, all in the same electronic states, probably in 2p53s (3P0,2). The initial electronic state of B2 exciton (2p54s) is known to relax very rapidly (∼10−13s) to the 1st order excitonic state (Schwentner & Koch 1976), which is consistent with the discussion above. Additional shoulder appeared in the higher energy side in B2 spectrum (tf∼180µs), whose kinetic energy is 0.36±0.04 eV, can be the contribution of Ne* in 2p54s state at the desorption.
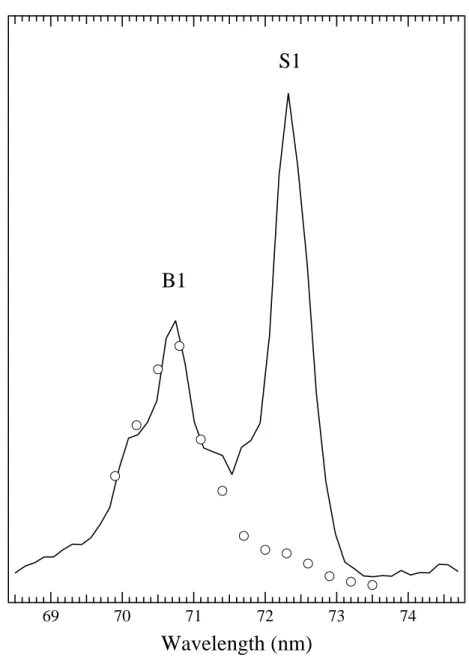
In the TOF spectra (figure 5), a tail was observed by the bulk excitation (B1 and B2). Figure 6 shows the wavelength dependence of the intensity of CE peak (solid line) and the area of the tail (open circles) (tf : 600 ∼900µs, Ek : 0.01∼0.03 eV).
It is clearly seen that this tail appeared only by the bulk excitation. This tail can be attributed to desorption via IS mechanism, i.e. an excited atom created just below the surface has lost its energy by blowing off the atoms in the overlayer before desorption via CE process. Low kinetic energy and broad angular distribution (see section 3.1.3 below and table 2) support this idea. Our result is in consistent with a molecular dynamics simulation (Dutkiewicz et al 1996). The simulation shows that an exciton created in 5 outermost layers can desorb via CE mechanism with a kinetic energy lower than 0.1 eV.
Table 1 summarize the kinetic energies of desorbed excited atoms by S1, B1, S’,
and B2 excitation for solid Ne together with their desorption mechanism and electronic state at the desorption.
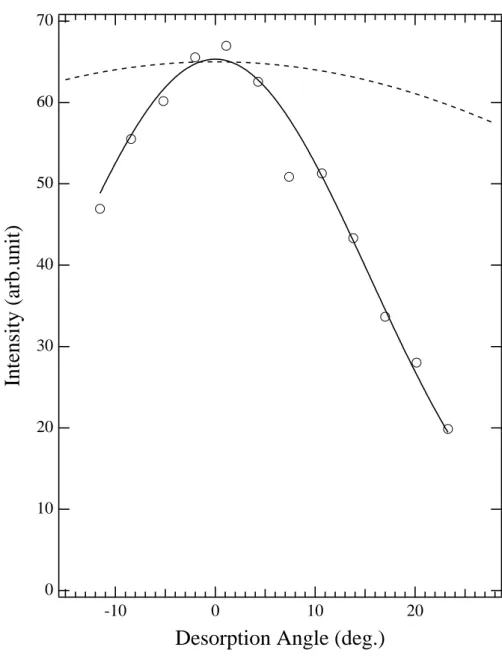
3.1.3. Angular distribution of desorption. Motive force of the desorption via the cavity ejection mechanism is the repulsive force from ground state atoms surrounding the excited atom, which should be axially symmetric around the sample normal direction (see figure 2). The desorbed excited atoms, therefore, should have a sharp angular distribution towards the sample normal direction. Figure 7 shows the results of the angular distribution of the CE peak of desorbed metastable Ne atoms by S1 excitation (Arakawaet al 1995). Very sharp distribution was observed as expected:
n= 14 if the distribution is fitted to cosnθ. The sharpness varied with the excitation energy, i.e., the kind of exciton created, as summarized in table 2. Such a narrow distribution is explained qualitatively in terms of the vibrational displacement of Ne atoms at excitation by simple trajectory calculations (Sakuraiet al 1995). This is also supported by the recent ESD measurements where FWHM of the angular distribution increases as the sample temperature rises (Katoet al 2006).
The ED component by S’ excitation showed a much broader angular distribution (0 ≤ n ≤ 1, FWHM ≥ 120 deg.). Molecular dynamics calculation for solid Kr (Dutkiewicz et al 1995) showed that an excimer formed in the surface layer easily “forget” their initial orientation along crystal axes before dissociation, which may explain the broad angular distribution in ED component. Another possible explanation is that the excimer created in the surface layer desorbs and dissociates in vacuum (see section 3.2), resulting in the isotropic angular distribution.
Throughout the series of angular distribution measurements of the desorbed Ne*, no azimuthal structure around the sample normal was observed for any TOF components, as was the case for ESD Ar* (Leclercet al 1992).
3.1.4. Desorption by 2p53p-type surface exciton. Excited atom desorption through the creation of S’ exciton can be a good test for the validity of the cavity ejection mechanism. Electronic configuration of S’ exciton is 2p53p, which is optically forbidden state but partly allowed at the surface and the lattice defect due to reduced symmetry (Inoue et al 1984). This configuration has 10 states, whose excitation energies in gas phase is from 18.382 to 18.966 eV (Saloman & Sansonetti 2004). Kloiber and Zimmerer demonstrated that excited atoms in these states desorb by S’ exciton creation (Kloiber & Zimmerer 1990).
Figure 8(a) shows a series of time-of-flight (TOF) spectra of metastable atoms in 2p53s (3P0,2) states desorbed via CE process from the surface of solid Ne, and figure 8(b) shows a dependence of Ne* desorption yield on the wavelength of the incident light in the energy range corresponding to the excitation of 2p53p-type surface exciton (S’). Thickness of the sample was 690 ML. The wavelengths where each TOF spectrum was measured are marked by open circles in figure 8(b). It is clearly seen from the figure that there are 2 components in TOF spectra, one whose kinetic energy increases with the energy of incident light (peak A), and the other whose kinetic energy is fixed (peak B). Figure 9 shows the kinetic energy spectra converted from figure 8(a). Dots show the measured points and solid lines are fitted curves using 2 Gaussian functions.
The kinetic energy of the peak A as a function of the incident photon energy is plotted in figure 11. The kinetic energy increases linearly with increasing the incident photon energy, i.e., the desorbed atom in higher electronic state gains larger kinetic
energy, which supports the validity of the cavity ejection mechanism. The thickness dependence of the TOF spectra (figure 10) shows that the peak A is the contribution of the excitation of S’ exciton at the surface, while the peak B is due to the bulk excitation, probably at the lattice defect, which may explain why the kinetic energy of the peak B does not depend on the incident wavelength.
3.2. Excimer desorption
Desorption of excited dimers from the surface of rare gas solids was first suggested by Coletti et al (Coletti et al 1984) for solid Ar irradiated by low energy (≤ 100 eV) electron beam. Reimann and co-workers (Reimann et al 1988, Reimann et al 1990, Reimann et al 1992) systematically studied the sputtering and luminescence at the surface of solid Ar caused by MeV light ions. They detected the luminescence of the desorbed excimers by observing only the plume in front of the Ar sample using such an experimental geometry that the emission from the sample was blocked by the edge of the sample substrate. From the detailed analysis of the results, they concluded that Ar2* 3Σu; 1u,0−u desorbed with a kinetic energy around 0.1 eV, and that many-body collisions during the dimerization and desorption efficiently relaxed the vibrational levels of the excimers. Excimer desorption by low energy photon was first reported by Grigorashchenkoet al (Grigorashchenko et al 1997). for solid Ar and by Savchenkoet al. (Savchenkoet al 1997) for solid Ne. Their results suggested that the desorption of excited dimers was closely related to the exciton creation.
Molecular dynamics calculations by Johnson and co-workers have shown that the desorption of excited dimers was energetically possible for Ar2* in1,3Σustates (Cuiet al 1989) and for Kr2* in1Σu state (Buller & Johnson 1991). They pointed out that the excimer desorption was related to the formation of a ‘cavity’ around a molecular- type self-trapped exciton like in the atomic desorption case. Chenet al. (Chenet al 1996) have studied the desorption of an excimer from solid Ne using the extended-ion method on the basis of one-electron Hartree-Fock approximation. Their results also supported the cavity ejection mechanism in the case of excimer desorption.
We have observed the desorption of excimers Ne2* in 3Σu state by observing a luminescent ‘plume’ in front of the sample surface by low energy (20 - 200 eV) electron impact and irradiation of 55 - 75 nm synchrotron radiation (Hirayamaet al 2001). Figure 12(a) shows the dependence of the excimer desorption yield, or the plume emission intensity, on the wavelength of the incident light. Also shown in 12(b) is the desorption yield of excited Ne atoms via the cavity ejection mechanism. The agreement in peak positions between theNe* desorption yieldand theplume intensity shows that the plume emission is closely related to the valence exciton creation.
The average kinetic energy of desorbed Ne2* was estimated at 0.2±0.1 eV by analyzing the shape of the emission plume. This estimation is in fair agreement with Chen et al.’s value 0.23 eV (Chenet al 1996) theoretically obtained for Ne2* desorbed from (100) face of solid Ne. These low values of kinetic energy suggest that the cavity ejection model is also plausible for the desorption of excimers.
The decay of the plume emission was not of single exponential type, owing to the dependence of the emission lifetime on the vibrational level of the excimers (Cohen &
Schneider 1974). Detailed analysis showed that most of the desorbed excimers were in the highest vibrational level, suggesting that the desorption process is much faster than vibrational relaxation.
3.3. Absolute desorption yields
3.3.1. Total desorption For the quantitative understanding of the mechanism for exciton induced desorption and relaxation processes, we have measured absolute desorption yields in the excitonic excitation region. Total desorption yield from the surface of solid Ne in the excitonic excitation range is shown in figure 13 (Arakawaet al 2000). High background yield is due to the second order light of the monochromator, fraction of which was measured to be 20 ∼35 % in this wavelength region (Sakurai et al 2002). Peaks by the excitation of the surface excitons (S1 and S’) are clearly visible in the spectrum of the thickness of 73 ML in addition to those by the bulk excitons (B1, B2 and B3). At the excitation energy higher than the band gap energy, a rise of yield was observed in the results of thicker sample. At this energy, an ion can be created, which may lead to the formation of either an exciton or an excited dimer (excimer) via an electron-hole recombination. They result in the cavity ejection and the excimer dissociation processes, respectively. The latter, the formation of the excimer followed by the dissociation, can be the dominant process for the total desorption after ionization.
The thickness dependences of the total desorption yields at the excitation of S1, B1, S’ and B2 excitons are shown in figure 14. The yields were estimated from the peak height above the continuous background. Contribution of the 2nd and 3rd order light was taken into account. For the films thinner than 20 atomic layers, it was difficult to determine the yields because of high background signal. The yields by the bulk excitation, B1 and B2, increase as the film becomes thicker, and seem to reach constant values, 1.6±0.3 and 1±0.2 (atoms/photon), respectively, at the thickness around 100∼200 ML. Absolute yields by the excitation of surface excitons, S1 and S’, on the other hand, showed no dependence on the film thickness, as is expected for surface excitations.
One can obtain the ratio of the number of desorbed atoms to that of surface excitons created by photons by the absolute value of the total desorption yield.
Number of surface excitons created can be estimated by the absorption coefficient of solid Ne at the wavelength corresponding to the bulk exciton (B1) excitation.
We assume that the excitation probability of S1 is the same as that of B1 in each layer at their excitation energy. The estimation based on the photoabsorption data (Pudewill et al 1976) leads to 0.1 excitons per photon. It is likely that a surface exciton can desorb at most a single atom, the excited atom itself in the CE process.
Although this estimation, 0.1 excitons per photon, is considerably smaller than the observed yields, 0.3 atoms per photon by the creation of S1 exciton, we concluded that almost all the surface exciton yield the desorption of one Ne atom or, in other words, that the desorption probability of the surface exciton S1 is almost unity. The larger desorption yield in comparison with the estimated efficiency for an exciton creation may be explained by other desorption process: the CE process of a dimer and the ED process which yield two or more desorbing atoms. Another possibility is a contribution of reflected light on the sample substrate, which may enhance the number of excitons on the surface.
Similar measurements were performed for solid Kr (Adachi et al 2003). The thickness dependence of the yields for B1(3/2) exciton is shown in figure 15. Solid lines are the results of a simulation. In this simulation we assumed that the desorption by a bulk exciton creation is caused by the sequential processes as i) diffusion of the exciton, ii) formation of an excimer, iii) dissociation of the excimer, and iv)
collision cascade followed by internal sputtering. The initial distribution of bulk excitons was estimated from the photoabsorption coefficient for solid Kr (Haenselet al 1970, Skibowski 1971, Sonntag 1977), and a classical molecular dynamics calculation (Dutkiewicz et al 1995) was used for the estimation of collision cascade. Diffusion lengthLfor excitons was the single adjustable parameter in this simulation. As shown in the figure, our experimental results, both absolute values and thickness dependence, were well reproduced by the diffusion length L between 5 ∼ 10 nm. Because the diffusion length may strongly depend on the crystalline condition and the sample temperature, it is not easy to make a critical comparison with other experimental results. We, however, refer to the result of the photoemission study (Schwentner et al 1981). They reported the diffusion length of the exciton in solid Kr of the range between 1 and 10 nm, which is consistent with the present value.
3.3.2. Metastable atom desorption We also measured the absolute desorption yield of metastable atoms by exciton creation for Ne and Ar (Hirayama et al 1997).
Experimental procedures to deduce the absolute yield are described in section 2.4.1.
The results are listed in table 3. Only rough estimation for Ar (S1) is given because of unknown angular distribution for desorbed metastable Ar atoms and low signal intensity.
Comparison between the metastable and total desorption yield at S1 excitation shows that about 1% of the desorbed Ne atoms are in the metastable state (3P0,2), rest of which can be excited atoms in optically-allowed states (1,3P1).
4. summary
Our experimental results on the metastable and total desorption initiated by exciton creation were presented and the validity of three desorption mechanisms, cavity ejection (CE), excimer dissociation (ED) and internal sputtering (IS), was demonstrated. Observation of metastable atoms is found to be one of the most powerful tools for understanding the dynamic nature of excitons, especially on a surface, because an exciton created on the surface can desorb keeping its ‘memory’ as it was on the surface, such as its interaction with surrounding atoms, local geometrical condition, local temperature, etc. The results of the absolute desorption yields provided us a quantitative understanding of the exciton induced desorption processes.
It should be noted that some of important results are missing in this paper. The results for mixed (Hirayamaet al 1996, Weibelet al 1996) and adsorbed (Weibelet al 1993) system can show another aspect of the exciton dynamics. In the viewpoint of vacuum technology, adsorption of residual gases on the cryogenic surface can be a serious problem. Very small amount of residual gas adsorption on rare gas solid surfaces was found to have a considerable influence on the desorption of ions (Sakurai et al 1990) and metastable atoms (Kuninobuet al 1997, Hayamaet al 1998).
Acknowledgments
All of the data presented in this paper was obtained at UVSOR facility, Institute for Molecular Science, Okazaki, under the Joint Studies Program. Authors are grateful to the staff of the facility for their kind help throughout the work. We acknowledge a long-standing collaboration with Professor Makoto Sakurai, Kobe University. This
work was partly supported by Grant-in-Aid for Scientific Research from the Ministry of Education, Science, Sports and Culture, Japan.
References
Adachi T, Hirayama T, Miura T, Arakawa I & Sakurai M 2003Surf. Sci.52860
Alvari˜no J M, Hepp C, Kreiensen M, Staudenmayer B, Vecchiocattivi F & Kempter V 1984J. Chem.
Phys.80765
Arakawa I 1998Molecular Crystals and Liquid Crystals Vol. 314 (New York: Gordon and Breach Science Publishers) p 47
Arakawa I, Adachi T, Hirayama T & Sakurai M 2000Surf. Sci.451136
Arakawa I, Adachi T, Hirayama T & Sakurai M 2003Fizika Nizkikh Temperatur (Low Temperature Physics)29259
Arakawa I, Takahasi M & Takeuchi K 1989J. Vac. Sci. Tech. A72090
Arakawa I, Weibel D E, Nagai T, Abo M, Hirayama T, Kanno M, Mitsuke K & Sakurai M 1995Nucl.
Instrum. Meth. Phys. Res. B101195 Borst W 1971Rev. Sci. Instrum.421543
Buller W & Johnson R 1991Phys. Rev. B436118
Chen L F, Huang G Q & Song K S 1996Nucl. Instrum. Meth. Phys. Res. B11661 Cohen J S & Schneider B 1974J. Chem. Phys.613230
Coletti F & Debever J M 1984J. Luminesc.31/32927
Coletti F, Debever J & Zimmerer G 1984J. Physique Lett.45L467 Cui S & Johnson R 1989Phys. Rev. B399580
Cui S, Johnson R & Cummings P 1988Surf. Sci.207186
Cui S, Johnson R E, Reimann C T & Boring J W 1989Phys. Rev. B3912345 Dutkiewicz ÃL, P¸edrys R & Schou J 1995Nucl. Instrum. Meth. Phys. Res. B101188 Dutkiewicz ÃL, P¸edrys R & Schou J 1996Europhys. Lett.36301
Ellegaard O, Schou J & Sørensen H 1986Nucl. Instrum. Meth. Phys. Res. B13567 Feulner P, Muller T, Puschmann A & Menzel D 1987Phys. Rev. Lett.59791
Grigorashchenko O, Ogurtsov A, Savchenko E, Becker J, Runne M & Zimmerer G 1997Surf. Sci.
390277
Haensel R, Eitel G, Koch E E, Skibowski M & Schreiber P 1970Opt. Comm.259 Hayama A, Kuninobu T, Hirayama T & Arakawa I 1998J. Vac. Sci. Tech. A16979 Hirayama T, Hayama A, Adachi T, Arakawa I & Sakurai M 2001Phys. Rev. B63075407
Hirayama T, Hayama A, Koike T, Kuninobu T, Arakawa I, Mitsuke K, Sakurai M & Savchenko E V 1997Surf. Sci.390266
Hirayama T, Nagai T, Abo M, Arakawa I, Mitsuke K & Sakurai M 1996J. Electr. Spectr. Rel. Phen.
80101
Inoue K, Sakamoto H & Kanzaki H 1984J. Phys. Soc. Jpn.53819 Johnson R & Brown W 1982Nucl. Instrum. Meth. Phys. Res.198103 Johnson R & Inokuti M 1983Nucl. Instrum. Meth. Phys. Res.206289 Kato H, Furuhashi O & Hirayama T 2006in preparation.
Kloiber T, Laasch W, Zimmerer G, Coletti F & Debever J M 1988Europhys. Lett.777 Kloiber T & Zimmerer G 1989Radiat. Eff. Def. Solids109219
Kloiber T & Zimmerer G 1990Physica Scripta41962
Kuninobu T, Hayama A, Hirayama T & Arakawa I 1997Surf. Sci.390272 Leclerc G, Bass A D, Mann A & Sanche L 1992Phys. Rev. B464865
Leclerc G, Bass A D, Michaud M & Sanche L 1990J. Elect. Spectr. Relat. Phenom.52725 Pudewill D, Himpsel F J, Saile V, Schwentner N, Skibowski M & Koch E E 1976Phys. Stat. Sol. B
74485
Reimann C T, Brown W L, Grosjean D E & Nowakowski M J 1992Phys. Rev. B4543 Reimann C T, Brown W L & Johnson R E 1988Phys. Rev. B37(4), 1455
Reimann C T, Brown W L, Nowakowski M J, Cui S & Johnson R E 1990Desorption Induced by Electronic Transitions, DIET-IVed G Betz & P Varga (Heidelberg: Springer) p. 226 Reimann C T, Johnson R E & Brown W L 1984Phys. Rev. Lett.53(6), 600
Runne M, Becker J, Laasch W, Varding D & Zimmerer G 1993Nucl. Instrum. Meth. Phys. Res. B 82301
Saile V & Koch E E 1979Phys. Rev. B20784
Sakurai M, Adachi T, Hirayama T & Arakawa I 2002UVSOR Activity Report, UVSOR-29p. 214 Sakurai M, Hirayama T & Arakawa I 1990Vacuum41217
Sakurai M, Morita S, Fujita J, Yonezu H, Fukui K, Sakai K, Nakamura E, Watanabe M, Ishiguro E
& Yamashita K 1989Rev. Sci. Instrum.602089
Sakurai M, Nagai T, Abo M, Hirayama T & Arakawa I 1995J. Vac. Soc. Jpn.38298 Saloman E B & Sansonetti C J 2004J. Phys. Chem. Ref. Data331113
Samson J A R 1964J. Opt. Soc. Am.546
Savchenko E V, Hirayama T, Hayama A, Koike T, Kuninobu T, Arakawa I, Mitsuke K & Sakurai M 1997Surf. Sci.390261
Schou J 1987Nucl. Instrum. Meth. Phys. Res. B27188
Schwentner N, Himpsel F J, Saile V, Skibowski M, Steinmann W & Koch E E 1975Phys. Rev. Lett.
34528
Schwentner N & Koch E E 1976Phys. Rev. B144687
Schwentner N, Martens G & Rudolf H W 1981Phys. Stat. Sol. B106183 Skibowski M 1971Proc. 3rd Int. Conf. on VUV Rad. Phys. (Tokyo) Small-Warren N E & Chiu L Y C 1975Phys. Rev. A111777
Sonntag B 1977Rare Gas SolidsVol. 2 ed M L Klein & J A Venables (London: Academic Press) p 1022
Weibel D E, Hirayama T & Arakawa I 1993Surf. Sci.283204
Weibel D E, Hoshino A, Hirayama T, Sakurai M & Arakawa I 1993Desorption Induced by Electronic Transitions - Ved A R Burns, E B Stechel & D R Jenninson (Springer-Verlag) p 333 Weibel D E, Nagai T, Hirayama T, Arakawa I & Sakurai M 1996Langmuir12193
Zimmerer G 1994Nucl. Instrum. Meth. Phys. Res. B91601
Table 1. Kinetic energies and electronic states of desorbed metastable Ne atoms.
Electronic Configuration
Excitation Energy (eV)
Kinetic Energy (eV)
Desorption Mechanism
Electronic State at Desorption
S1 2p53s 17.2 0.18 CE 2p53s (3P0,2)
B1 2p53s 17.5 0.18 CE 2p53s (3P0,2)
≤0.05 IS 2p53s (3P0,2)
S’ 2p53p 19.0 0.19 CE (bulk) 2p53p or 2p53s
0.2 ∼0.4 CE 2p53p
1.4 ED
B2 2p54s 20.3 0.18 CE 2p53s (3P0,2)
0.36 CE 2p54s
1.4 ED
≤0.05 IS 2p53s (3P0,2)
Table 2. Fitting parameternand FWHM of angular distribution of desorbed metastable atoms from the surface of solid Ne.
Exciton Mechanism n FWHM (deg.)
S1 CE 14 36
B1 CE 10 42
S’ CE 8 47
ED 0∼1 ≥120
B1 tail IS 2∼4 70∼90
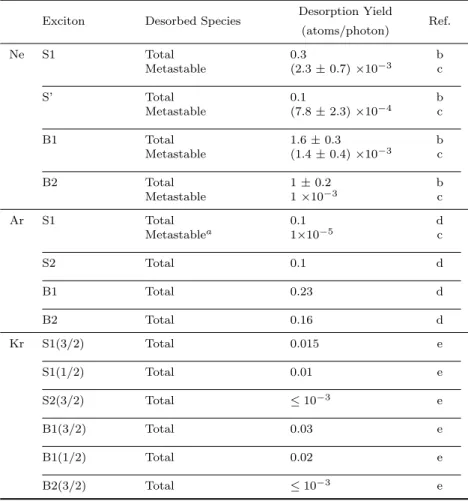
Table 3. Absolute yields of the total and metastable desorption from solid Ne, Ar, and Kr.
Desorption Yield
Exciton Desorbed Species Ref.
(atoms/photon)
Ne S1 Total 0.3 b
Metastable (2.3±0.7)×10−3 c
S’ Total 0.1 b
Metastable (7.8±2.3)×10−4 c
B1 Total 1.6±0.3 b
Metastable (1.4±0.4)×10−3 c
B2 Total 1±0.2 b
Metastable 1×10⁻³ c
Ar S1 Total 0.1 d
Metastablea 1×10⁻⁵ c
S2 Total 0.1 d
B1 Total 0.23 d
B2 Total 0.16 d
Kr S1(3/2) Total 0.015 e
S1(1/2) Total 0.01 e
S2(3/2) Total ≤10−3 e
B1(3/2) Total 0.03 e
B1(1/2) Total 0.02 e
B2(3/2) Total ≤10−3 e
a only rough estimation.
b From Arakawaet al(2000).
cFrom Hirayamaet al(1997).
d From Arakawaet al(2003).
eFrom Adachiet al(2003).
0
Potential Energy (arb. units)
Internuclear Distance
A B
C
D A
'
D
'
A + A A* + A
Ground State Excited State
Figure 1. Schematic potential curve for the excimer dissociation mechanism.
See text for details.
hv
Exciton creation on the surface
Cavity formation
Desorption
Figure 2. Schematic of the cavity ejection mechanism. Solid and open circles represent the excited and ground state atoms, respectively. See text for details.
Liquid He Cryostat with LN2 Shield
100mm MCP (ø40)
EMT(ø8) MCP(ø75)
+ PSD Pt(111)
to Gas Handling System
TMP (Rotatable)
Photon Beam
QMS
Photon Beam Monitor
Figure 3. Schematic view of the main chamber.
Intensity (arb. units)
75 70
65 60
55
Wavelength (nm)
S1
B1
S' B2
Eg
B3 500ML
5ML
(a)
(b)
Figure 4. Dependence of metastable Ne* yield via the cavity ejection mechanism from the surface of solid Ne on the wavelength of excitation light. The assignments for each peaks and the position of the band gap energy Eg are shown. The thickness of the sample is (a) 500 and (b) 5 atomic monolayers. From Hirayama et al(1997).
Intensity (arb.units)
800 600
400 200
0
Flight Time (µsec)
x4 x5 x2 72.3nm (S1)
70.5nm (B1)
65.4nm (S')
61.1nm (B2) Photon
CE
ED
Figure 5. Time-of-flight spectra of desorbed metastable Ne atoms from solid Ne at excitation wavelengths corresponding to the surface (S1, S’) and bulk (B1, B2) excitons. From Hirayamaet al(1996).
Intensity (arb. units)
74 73
72 71
70 69
Wavelength (nm) B1
S1
Figure 6. Wavelength dependence of the CE intensity (solid line) and the area of the tail in the TOF spectra (open circles). The area of the tail was taken at the region of tf = 600 ∼ 900µs, which correspond to the kinetic energy Ek: 0.01∼0.03 eV. The scale is arbitrary in each curve.
70
60
50
40
30
20
10
0
Intensity (arb.unit)
20 10
0 -10
Desorption Angle (deg.)
Figure 7. Angular distribution of the desorbed metastable Ne atoms via the cavity ejection mechanism by the excitation of the first order surface exciton (S1). Solid line is the fitting curve using cosnθwheren= 14. Dashed line shows cosθfor comparison. From Arakawaet al(1995).
Intensity (a.u.)
400 300
200 100
Flight Time (µs)
66.065.565.064.564.063.5
Excitation Wavelength (nm)
Intensity (a.u.)
TOF Spectra Ne* Yield
Spectrum
(a) (b)
Figure 8. (a) Series of time-of-flight spectra and (b) dependence of Ne*(CE) intensity on the wavelength of incident light in the wavelength range of 63 – 65.7 nm corresponding the excitation energy of S’ exciton. Thickness of the sample was 690 ML. The wavelengths where each TOF spectrum in (a) was measured are marked by open circles in (b).
INTENSITY (arb.units)
0.6 0.5
0.4 0.3
0.2 0.1
Kinetic Energy (eV)
63.6 nm
64.2 nm 63.9 nm
64.5 nm
65.1 nm 64.8 nm
65.4 nm
65.7 nm
66.0 nm
Figure 9. Kinetic energy spectra of desorbed Ne*(CE) by the excitation of S’
excitons. Dots and solid lines are measured fitted results. Vertical solid lines and dashed line are the peak positions of the peak (A) and peak (B), respectively.
Intensity (arb. units)
500 400
300 200
100 0
Fligth Time (µsec)
5 ML 10 ML 50 ML
λ = 64.2nm
690 ML
A B
Figure 10. Thickness dependence of the time-of-flight spectra of Ne* measured at the wavelength of 64.2 nm.
0.40
0.35
0.30
0.25
0.20
Kinetic Energy (eV)
19.6 19.4
19.2 19.0
18.8
Incident Photon Energy (eV)
66.0 65.5 65.0 64.5 64.0 63.5
Wavelength (nm)
Figure 11. Kinetic energy of peak (A) as a function of the incident photon energy. Solid line is a guide to the eye.
Intensity (arb. units)
75 70
65 60
55
Wavelength (nm) (a)
(b)
S1B1
S' B2
B3
Figure 12. (a) Plume emission intensity, or the desorption yield of Ne2* (3Σu) from the surface of solid Ne vs. the wavelength of stimulating light. (b) Yield of excited Ne atoms Ne* in3P0,2 states that are desorbed from the surface of solid Ne through the cavity ejection mechanism. From Hirayamaet al(2001).
3.5
3.0
2.5
2.0
1.5
1.0
0.5
0.0
Desorption Yields (Atoms/Photon)
75 70
65
60
Wavelength (nm)
q = 73 ML q = 1600 ML
Figure 13. Absolute desorption yield spectra for solid Ne in the excitonic excitation range, 56 – 75 nm of wavelength. The thickness of the sample was 1600 and 73 atomic layers. From Arakawaet al(2000).
2.0
1.5
1.0
0.5
0.0
Desorption Yield (atoms/photon)
10 2 3 4 5 6 7 100 2 3 4 5 6 71000 2 3 4 5
Film Thickness (atomic layers) S1
B1 S' B2
Figure 14. Thickness dependence of the desorption yields for solid Ne at the excitation of excitons, S1, B1, S’ and B2. From Arakawaet al(2000).
0.06
0.04
0.02
0.00
Absolute desorption yields (atoms/photon)
6 10 2 3 4 5 6 100 2 3 4 5 6 1000 2 3 4 5
Thickness of Kr film (ML)
1 nm
5 nm
10 nm
50 nm Experiments
Simulation L =
Figure 15. Thickness dependence of the desorption yields for solid Kr at the excitation of B1(3/2) excitons. Open circles: experimental results. Solid lines:
simulation results. Diffusion length Lused for the calculation of each curve is also shown. See text for details. From Adachiet al(2003).