九州大学学術情報リポジトリ
Kyushu University Institutional Repository
Land Use Change and Landslide Susceptibility Assessment Using GIS and Multivariate
Quantitative Predictive Models for Mountainous Disaster Mitigation in South Sulawesi Indonesia
アンダン スルヤナ ソマ
http://hdl.handle.net/2324/1959168
出版情報:九州大学, 2018, 博士(農学), 課程博士 バージョン:
権利関係:
Land Use Change and Landslide Susceptibility Assessment Using GIS and Multivariate Quantitative Predictive Models for Mountainous Disaster Mitigation
in South Sulawesi Indonesia
ANDANG SURYANA SOMA
2018
Land Use Change and Landslide Susceptibility Assessment Using GIS and Multivariate Quantitative Predictive Models for Mountainous Disaster Mitigation
in South Sulawesi Indonesia
A dissertation submitted by
Andang Suryana Soma
In partial fulfillment of the requirements for the degree of Doctor of Agriculture at Department of
Forest and Forest Product Sciences, Graduate School of Bioresources and Bioenvironmental Sciences
Kyushu University Fukuoka, Japan
2018
署名
主査
副査
副査
i
Table of Contents
Chapter 1 Introduction ... 1
1.1 Background ... 1
1.2 Disaster management in Indonesia ... 3
1.3 Landslide susceptibility analysis in developing country: lack of data availability ... 5
1.4 Research Scope and Objectives ... 6
1.5 Thesis Organization ... 7
1.6 References ... 10
Chapter 2 Study Area ... 11
2.1 Introduction ... 11
2.2 Soil and Land Use/Land Cover ... 12
2.3 Geology and General Geomorphology ... 14
2.4 Rainfall condition ... 15
2.5 Socio-economic conditions ... 17
2.6 References ... 18
Chapter 3 Land Use Changes on the Slopes and the Implications for the Landslide Occurrences in Ujung-Loe Watersheds South Sulawesi Indonesia ... 20
3. 1 Introduction ... 20
3. 2 Material and Method ... 21
3. 3 Results and Discussion ... 23
3. 4 Conclusion ... 27
3. 5 References ... 28
Chapter 4 Performance of Land Use Change Causative Factor on Landslide Susceptibility Map in Upper Ujung-Loe Watersheds South Sulawesi Indonesia ... 29
4. 1 Introduction ... 29
4. 2 Data and Methods ... 30
4. 3 Result and Discussion ... 41
4. 3. 1 Frequency ratio ... 41
4. 3. 2 Logistic regression ... 42
4. 3. 3 Validation ... 43
4. 4 Conclusion ... 47
4. 5 References ... 48
ii
Chapter 5 Comparative Study of Land Use Change and Landslide Susceptibility Using Frequency Ratio, Certainty Factor, and Logistic Regression in Upper Area of Ujung-Loe
Watersheds ... 50
5. 1 Introduction ... 50
5. 2 Material and method ... 51
5. 2. 1 Preparation of data ... 52
5.2.1.1 Landslide inventory ... 52
5.2.1.2 Landslide causative factors ... 53
5. 2. 2 Data Analysis ... 57
5. 2. 3 Validation and verification ... 59
5. 3 Results and discussion ... 60
5. 3. 1 Frequency ratio ... 60
5. 3. 2 Certainty Factor ... 63
5. 3. 3 Logistic regression ... 65
5. 3. 4 Validation ... 66
5. 4 Conclusions ... 70
5. 5 References ... 71
Chapter 6 Optimization of Causative Factor Using Logistic Regression and Artificial Neural Network Models for Landslide Susceptibility Assessment in the Mountainous area of Ujung Loe Watershed South Sulawesi Indonesia ... 73
6. 1 Introduction ... 73
6. 2 Data and Methods ... 75
6. 3 Result and Discussion... 85
6. 4 Conclusion ... 97
6. 5 References ... 98
Chapter 7 Conclusions and Future Works ... 102
7. 1 Conclusions ... 102
7. 2 Future works ... 104
Appendices ... 105
Acknowledgments ... 126
iii
List of Tables
Table 1 Distribution of Natural Disasters Based on Indonesian National Disaster
Management Agency in Indonesia (DIBI, 2016) ··· 1
Table 2 Soil (great group) according to land system Sulawesi 1982 in the study area ···· 12
Table 3 Land use/Land cover 2015 in the study area ··· 13
Table 4 Formation of Lithology according to land system Sulawesi 1982 in the study area ··· 14
Table 5 Rain gauge station in the study area ··· 17
Table 6 Population data of in current research location ··· 17
Table 7 Land Use Change from 2004 to 2011 ··· 25
Table 8 Variables in the Equation of Slope and Land Use Change ··· 27
Table 9 The value of Frequency Ratio and Certainty Factor for each landslide causative factors ··· 40
Table 10 Logistic regression coefficient of landslide causative factors using an equal proportion of landslide and a non-landslide pixel with LUC causative factor ··· 42
Table 11 Table 3 Logistic regression coefficient of landslide causative factors using an equal proportion of landslide and non-landslide pixel without LUC causative factor ··· 43
Table 12 Table 4 AUC of ROC curve of success and predictive rate and ratio of landslide validation on landslide susceptibility map using FR, and LR Method ··· 43
Table 13 The characteristic of susceptibility classes on landslide susceptibility map using FR, and LR method with and without LUC causative factor ··· 46
Table 14 The value of Frequency Ratio and Certainty Factor for each landslide causative factors ··· 62
Table 15 Example is illustrating the calculation of certainty factor values for the combination of thematic layers using integration rules. ··· 64
Table 16 Logistic regression coefficient of landslide causative factors using equal proportion of landslide and non-landslide pixel ··· 65
Table 17 Likelihood Ratio Tests using Logistic Regression ··· 66
Table 18 AUC of ROC curve of success and predictive rate and the ratio of landslide validation on landslide susceptibility map using FR, CF and LR Method ··· 66
Table 19 The Characteristic of susceptibility classes on landslide susceptibility map using FR, CF, and LR method ··· 68
Table 20 Landside causative factors and their classes ··· 78
Table 21 The value of Ratio and Normalized of Landslide Occurrences for each landslide causative factors ··· 86
Table 22 Logistic regression coefficient of landslide causative factors using an equal proportion of landslide and non-landslide pixel ··· 87
iv
Table 23 Logistic regression model summary ··· 87 Table 24 The importance value derived from the artificial neural network (ANN) ··· 88 Table 25 Likelihood Ratio Tests using Logistic Regression ··· 92 Table 26 Coefficient of Each Causative Factor and Constant of Optimizing Causative
Factor Using Forward Stepwise (Likelihood Ratio) Logistic Regression··· 92 Table 27 Important value of each causative factor and constant of optimizing causative
factor using Artificial neural network (ANN) ··· 92 Table 28 Important value of each causative factor and constant of optimizing causative
factor using Artificial neural network (ANN) after eliminating causative factor by Forwarding Stepwise Logistic Regression ··· 93 Table 29 Validation data using Area under curve (AUC) values and percentage fall
landslide occurrence on high and very high susceptibility class of the three landslide models for the training and validation dataset ··· 94
v
List of Figure
Figure 1 Flowchart of thesis organization ··· 9
Figure 2 Study Area ··· 11
Figure 3 Soil Map ··· 12
Figure 4 Land use/Land cover 2015 in study area ··· 13
Figure 5 Geology Map ··· 14
Figure 6 Graph of Rainfall by Year and Average Rainfall by Month From 2002 Until 2015 in Three Rain Gauge Station, i.e., Malino, Apparang Hulu, And Bulo-Bulo ··· 15
Figure 7 Rainfall Map with Polygon Thiessen ··· 16
Figure 8 Population Density Map ··· 18
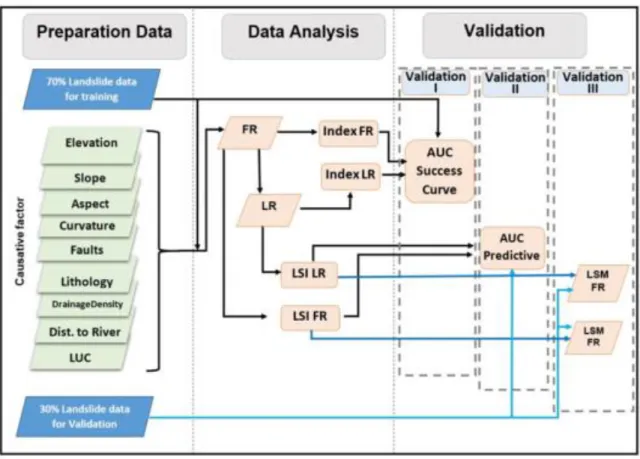
Figure 9 Research framework ··· 22
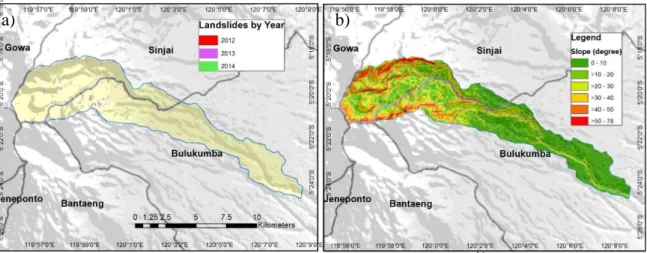
Figure 10 a) Landslide inventory b) Slope study area in degree ··· 23
Figure 11 Landslide photo ··· 23
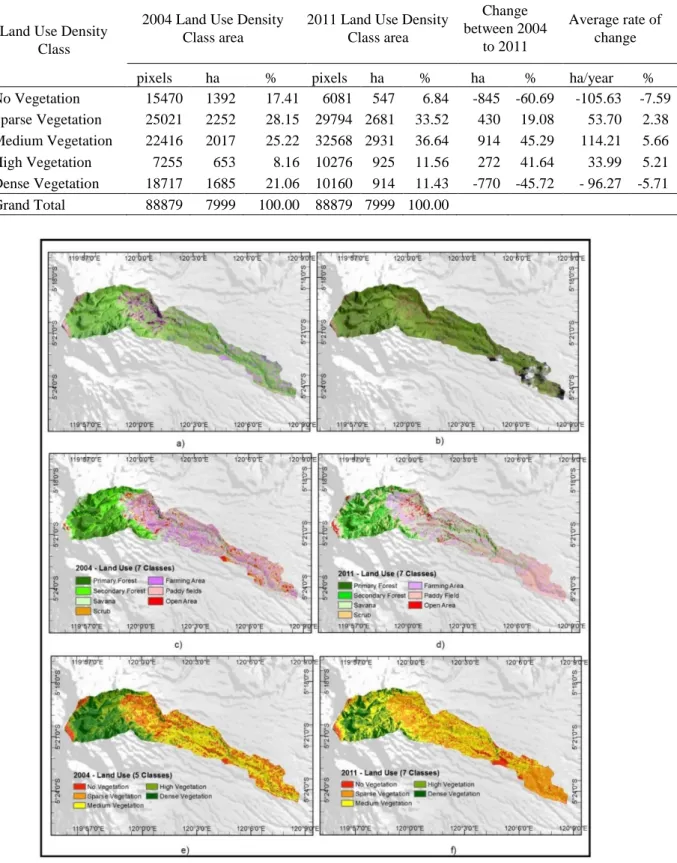
Figure 12 Landsat 5 TM recorded 2004 band 543; b) Landsat 5 TM recorded 2011band 543; c) Land use 2004 (7 classes); d) Land use 2011 (7 classes); e) Land use 2004 (5 classes); and f) Land use 2004 (5 classes) ··· 25
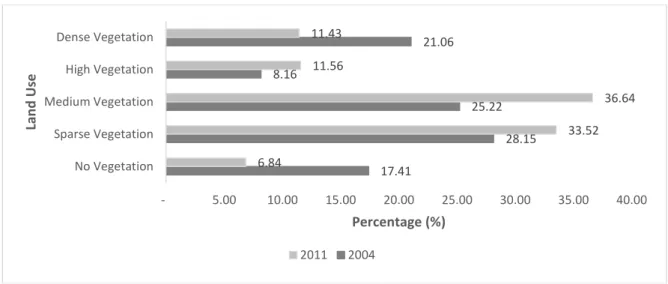
Figure 13 Histogram of Land Use Change from 2004 to 2011 ··· 26
Figure 14 Land Use Change from 2004 to 2011 on Landslide Occurrence ··· 26
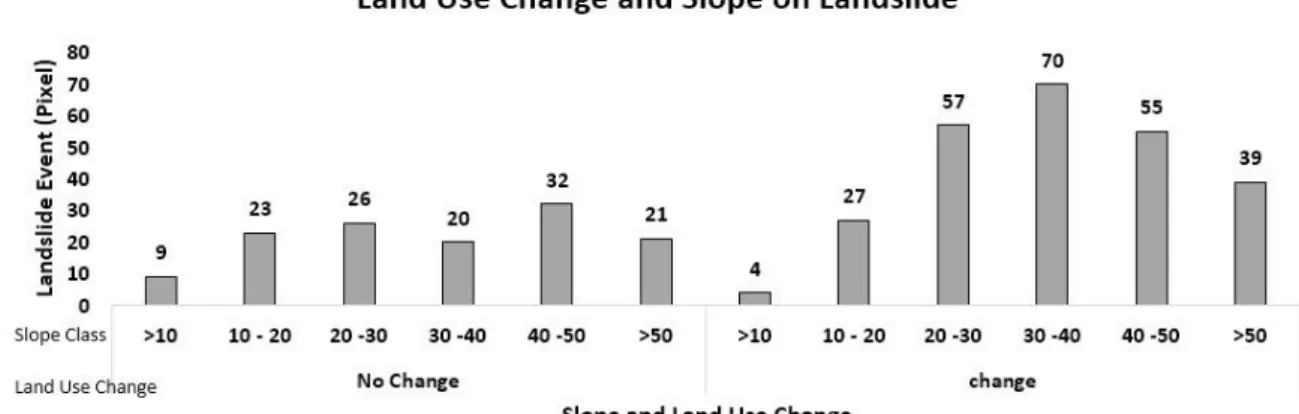
Figure 15 Slope and Land Use Change from 2004 to 2011 on Landslide Occurrence ··· 26
Figure 16 General land use change from 2004 to 2011 on landslide occurrence ··· 27
Figure 17 Research framework ··· 31
Figure 18 Landslide inventory a) old landslide, b) new landslide ··· 32
Figure 19 Map of Landslide Occurrence ··· 33
Figure 20 Eleven causative factor of landslide ··· 35
Figure 21 AUC of ROC of landslide susceptibility with and without LUC causative factor using FR, and LR method; a) success rate and b) predictive rate ··· 43
Figure 22 Landslide susceptibility map of with and without LUC causative factors using FR, and LR method ··· 46
Figure 23 Percentage of landslide susceptibility classes and rate of landslide susceptibility validation on landslide susceptibility of FR, and LR method ··· 47
Figure 24 Research framework ··· 52
Figure 25 Map of Landslide Distribution ··· 53
Figure 26 Landslide inventory a) old landslide, b) new landslide ··· 55
Figure 27 Eleven causative factor of landslide ··· 57
vi
Figure 28 Landslide susceptibility map of FR, CF, and LR method 7th iterations ··· 67
Figure 29 Percentage of landslide susceptibility classes and percentage of landslide susceptibility validation on landslide susceptibility of FR, CF and LR method · 69 Figure 30 Research framework ··· 75
Figure 31 Landslide inventory a) old landslide, b) new landslide ··· 76
Figure 32 Map of Landslide Distribution ··· 77
Figure 33 Eleven causative factors of landslide ··· 78
Figure 34 Architecture of artificial neural network in this research ··· 83
Figure 35 Landslide susceptibility maps (LSM). (a) LSM multivariate logistic on test seventh; (b) LSM artificial neural network (ANN) on sixth test models ··· 88
Figure 36 Validation data using Area under curve (AUC) and percentage of landslide occur falling into each class of landslide susceptibility of the three landslide models for the training and validation dataset. a) Success rate curve, b) Predictive rate curve, c) Percentage landslide occur of training dataset falling into Landslide Susceptibility Class (%) and d) Percentage landslide occur of validation dataset falling into Landslide Susceptibility Class (%). ··· 95
Figure 37 Landslide susceptibility map (LSM) of optimized causative factors using LR, ANN and combination FSLR-ANN. a) LSM LR with ten causative factor; b) LSM LR with nine causative factor; c) LSM LR with eight causative factor; d) LSM ANN with ten causative factor; e) LSM ANN with nine causative factor; f) LSM ANN with eight causative factor; g) LSM Combination FSLR-ANN with ten causative factor; h) LSM Combination FSLR-ANN with nine causative factor; i) LSM Combination FSLR-ANN with eight causative factor ··· 97
vii
“Learn never known the age, time, and place. Moreover, life is a sharing,” My Parent said. The voice still echoes in the mind
1
Chapter 1 Introduction
1.1 Background
A natural disaster is a significant adverse event resulting from natural processes of the Earth, i.e., flooding, landslide, tsunami, earthquake, and drought. As the most Natural disaster in Indonesia based on Indonesian National Disaster Management (BNPB) from 2011 – 2015, there are drought, forest fire, earthquake, flooding, and Landslide. Landslide is the natural hazard which causes a significant number of human lost in Indonesia. Landslide is a significant geological hazard worldwide, accounts for a high number of human casualties and an enormous amount of property loss, and causes severe damage to natural ecosystems and human-built infrastructures. Both environmental and triggering factors control landslide events. The environmental factors comprised of topography (e.g. elevation, slope, aspect, and curvature), geological settings (e.g. rock types, faults, and structural aspects), hydrological regimes (e.g.
proximity to stream and drainage density), geomorphological situation (i.e. physiographic unit, terrain mapping units and geomorphological units) and human (e.g. land use change and distance to road). Eight hundred and fifty events of landslide caused 462 people die (Table 1).
The landslide in Indonesia caused by heavy rainfall, weak material, steep slope and land-use change (change on upland change from forest area to farming area).
Table 1 Distribution of Natural Disasters Based on Indonesian National Disaster Management Agency in Indonesia (DIBI, 2016)
No Natural Disaster Event People die
1 Flooding 1112 343
2 Drought 36 0
3 Landslide 850 462
4 Earthquake 1024 0
5 Forest Fire 81 0
Land use change (LUC) is a process by which human activities transform the landscape.
LUC has been recognized throughout the world as one of the most critical factors influencing the occurrence of rainfall-triggered landslides (Glade, 2003), and LUC can have implication to
2 landslide occurrence on a steep slope (Mugagga et al., 2012). The correlation between intense rainfall and landslide initiation has been examined by many scholars (Crosta et al., 2004;
Hasnawir et al., 2017), and triggering thresholds have been determined. In South Sulawesi Indonesia, LUC has been translated into numerous landslide incidents triggered by the intensity of rainfall compared to other factors such as earthquakes, especially in Ujung-Loe upper watershed. The topography is naturally very steep and mountainous (38.8% class slope >20 degrees) and has a very high level of instability, especially during the rainy season (Rainfall:
2,976 to 7,114 mm/year with average annual rainfall 4,524 mm/year; (Makassar Meteorology, Climatology, and Geophysical Agency, 2016). Moreover, the primary occupation of social community in that area is farming and located in the mountainous area and steep slope. It is hard to avoid this agricultural practices because this has become people's culture for agriculture in mountainous regions and have made it hereditary. This primary characteristic of location makes different from the other location and need to analysis for mitigation disaster especially by introduce LUC as a new causative factor to produce susceptibility map.
Geographic information system (GIS) as a tool used to build a map of landslide inventory and causative factor. Moreover, GIS is used to build landslide susceptibility. Quantitative methods employ mathematical models to estimate the probability of landslide occurrence in a region and thus define hazard zones on a continuous scale. To achieve an accurate estimation of the probability of slope failure, a recent landslide inventory map, and complete information on the past mass movements are necessary. Quantitative methods include bivariate statistical models such as frequency ratio, multivariate statistical techniques such as discriminant analysis, and linear and logistics, as well as expert choices such as certainty factor and non-linear methods such as artificial neural networks.
In this research, we divide the processes into three-steps to compare the performance of LUC as a new causative factor. There three-steps were derivate factor for LUC to landslide occurrence; performance of LUC causative factor on landslide susceptibility map (LSM) by
3 using frequency ratio (FR) and logistics regression (LR) with 9 causative factor, and performance of LUC using FR, LR, and introduce expert choice analysis with certainty factor (CF) with 11 causative factor; and optimization of causative factor using LR and artificial neural network (ANN) method for landslide susceptibility assessment. Furthermore, we also conduct four landslide susceptibility maps from different landslide susceptibility models in GIS environment (FR, LR, CF, and ANN).
1.2 Disaster management in Indonesia
The shift in disaster management paradigm from focusing on disaster response to enhancing disaster risk reduction was started in 2007 by the enactment of Undang-Undang (Law) 24/2007. Scientific society and government awareness drove it after post-tsunami emergency response and subsequent rehabilitation and reconstruction phase. The momentum was also appeared by the experiences of Nabire Earthquake 2004, Nias Earthquake 2005, and Yogyakarta Earthquake 2006 emergency responses. However, the initiative to reform the Disaster Management Law has been started before the earthquake and tsunami of 26 December 2004. There was a discussion forum between BAKORNAS PB (National Disaster Management Coordination and Agency), NGO’s and MPBI (Indonesian Society for Disaster Management) to promote national disaster management. Before the enactment Law 24/2007, the disaster management in Indonesia was focusing on crisis management and disaster response coordinated by BAKORNAS PB.
The Disaster Management Law 24/2007 enforces a systematic approach to disaster risk reduction that contains three phases of the disaster management cycle as follows:
1. pre-disaster planning and preparedness, including disaster risk reduction, mitigation, preparedness, risk assessment and contingency planning
2. emergency response, including evacuation, search and rescue, providing immediate assistance, assessing damage and disaster relief
3. post-disaster management, including rehabilitation and reconstruction.
4 The law also mandates the creation of the “new BAKORNAS PB,” later called as BNPB (National Disaster Management Agency), as a national coordinating agency for disaster management that is responsible for pre-disaster planning, emergency response, and post- disaster management. BNPB must coordinate all contingencies, preparedness, mitigation, prevention, disaster management training, risk assessment and risk zoning. In the emergency response phase, BNPB has a responsibility to coordinate government, NGO’s and international organization during the emergency response phase. BNPB must also coordinate damage and loss assessment and coordinate rehabilitation and reconstruction in the post-disaster phase.
However, with the high responsibility for conducting disaster management, BNPB needs partners to provide all the technical support, to train technical personnel, and to create preventive disaster risk reduction culture in Indonesia. One of the representative partners to provide technical expertise in the full spectrum of disaster-related fields is the university partner.
It is expected to be an intellectual capital, which can provide technical assistance in disaster risk reduction including the research and technology development of early warning systems, damage assessment, and risk analysis.
Risk analysis, as a basis for disaster risk reduction, is an essential issue in the Law 24/2007. Disaster prevention planning should include disaster risk data documentation and risk analysis. Development activities which may have high risk must be equipped with risk analysis.
The implementation of risk analysis is closely related to spatial planning or land use planning.
Two other laws were also enacted in 2007, i.e., Law 26/2007 spatial planning and Law 27/2007 on coastal zone management and small islands. Both have a secure attachment to disaster mitigation. Law 26/2007 dictates that spatial plan documents should be based on the consideration of disaster mitigation measures. Law 27/2007 states that disaster reduction strategy has to be included in the coastal zones and small islands spatial plan. Spatial planning at national, provincial and regency levels is developed for 20 years and can be reviewed once in 5 years. If a disaster happens due to the development in a high-risk area which is not equipped
5 with disaster risk analysis, the responsible parties can be fined for up to US$ 26000 or jailed up to 3 years.
Thus, spatial planning based on disaster risk reduction is one of the primary issues of Indonesia’s national development agenda to promote sustainable development due to the increasing frequency of disasters and continuing environmental degradation. Regarding landslide disaster risk reduction, regional development and disaster mitigation are well approached by landslide susceptibility, hazard and risk zoning.
1.3 Landslide susceptibility analysis in developing country: lack of data availability Landslide risk analysis involves several steps, i.e., scope definition, landslide hazard identification and risk estimation. Scope definition addresses several issues including delineating the study area, elements at risk identification, and methodology selection. Landslide hazard identification addresses several issues on understanding the physical characteristic of study area regarding landslide processes such as understanding geology, geomorphology, hydrogeology, and climate. It also includes collecting landslide data, such as landslide classification, area, volume, travel distance, date occurrence, and elements at risk. Hazard identification activities are mostly related to landslide inventory. Risk estimation deals with consequence analysis and frequency analysis.
Landslide inventory is critical in the landslide risk analysis because it gives information related to the frequency of occurrences, landslide typology, landslide extents and damage of elements at risk. Estimation of spatial probability, temporal, probability and magnitude probability is not possible without landslide inventory containing sufficient data of past landslide events. In Indonesia, especially where this research was undertaken, adequate landslide inventory is not available because the landslide locations were very remote area.
It is a central problem of quantitative landslide risk analysis in Indonesia. Thus, producing landslide inventory maps and developing approaches of using those maps for landslide risk zoning in Indonesia are challenging tasks that this research focuses.
6 1.4 Research Scope and Objectives
Landslide is defined, as general terminology, to describe the movement of rock, debris or soil down a slope due to gravitational process (Fell et al., 2008). However, the terminology of landslide, in this research, is used interchangeably to define shallow and deep-seated slide.
Landslide hazard and risk analysis, as a soft preventive countermeasure, is a vital tool for disaster risk reduction in Indonesia because of the shifting paradigm of its disaster management from focusing on disaster response to enhancing disaster risk reduction. However, the primary drawback of generating landslide risk analysis is the unavailability of landslide inventory data, which makes difficulties in estimating the spatial probability, temporal probability, and magnitude probabilities.
The landslide in Indonesia caused by heavy rainfall, weak material, steep slope and LUC (change on upland change from forest area to farming area). LUC has been recognized throughout the world as one of the most critical factors influencing the occurrence of rainfall- triggered landslides (Thomas Glade, 2003), and LUC can have implication to landslide occurrence on a steep slope (Mugagga et al., 2012). The correlation between intense rainfall and landslide initiation has been examined by many scholars (Hasnawir et al., 2017; Kubota, 2010), and triggering thresholds have been determined. In South Sulawesi Indonesia, LUC has translated into numerous landslide incidents triggered by the intensity of rainfall compared to other factors such as earthquakes, especially in Ujung-Loe upper watershed. The topography is naturally very steep and mountainous (38.8% class slope >20 degrees) and has a very high level of instability, especially during the rainy season (Rainfall: 1,436 to 5,052 mm/year with average annual rainfall 3,739 mm/year on Apparang Hulu rain gauge (Agency for Meteorology, 2016).
Moreover, the primary occupation of social community in that area is farming and located in the mountainous area and steep slope. It is hard to avoid this agricultural practices because this has become people's culture for agriculture in mountainous regions and have made it hereditary.
Based on this primary characteristic of location make different from the other location and need
7 to analysis for mitigation disaster especially by introducing LUC as a new causative factor to produce susceptibility map.
This research will distinguish its analysis based on the availability of landslide causative factors. Thus, the objectives of this research are:
(1) To examining to quantify the LUC in the study area during 2004 to 2011 and establish the relationship between LUC, topographic parameters (slope) and landslide occurrence.
(2) To examining the performance of land use change as a causative factor to produce landslide susceptibility map using frequency ratio, and logistic regression and comparing with 9 causative factor
(3) To examining the effect of land use change to produce landslide susceptibility map using frequency ratio, logistic regression, and certainty factor method and comparing with 11 causative factor
(4) To optimize causative factors by using logistic regression and artificial neural network (ANN) and combination to produce landslide susceptibility map.
1.5 Thesis Organization
The thesis comprises of the following 7 chapters (Figure 1). Chapter 1 is an introduction; chapter 2 is study area. Chapter 3 is preliminary analysis to see the relationship between land use change and landslide occurrence. Chapter 4 and 5 are a central body to see the performance of land use change to produce landslide susceptibility map (LSM). Chapter 6 is an optimized causative factor to produce LSM. Chapter 7 is a summary and conclusion.
Chapter 1 introduces (1) The important of land use change causative factor for analysis for landslide susceptibility map in Ujung-Loe Watershed, South Sulawesi Indonesia, (2) the shifting disaster mitigation policy in Indonesia, (3) the problems in landslide risk
8 zoning in Indonesia, (4) the scope and objectives of this study, and (5) the organization of the thesis.
Chapter 2 introduces the condition of the study area, i.e., soil and land use/land cover, geology and geomorphology, rainfall condition and socio-economic conditions.
Chapter 3 consist of preliminary analysis to see the relationship between land use change and landslide events and slope factor in Ujung-Loe Watersheds, South Sulawesi, Indonesia.
Chapter 4 consists of analysis the performance of land use change causative factor to produce landslide susceptibility map in comparason with two different landslide susceptibility analysis using bivariate frequency ratio, and multivariate logistic regression with using 9 causative factors (elevation, slope, aspect, curvature, lithology, distance to faults, distance to river, drainage density and land use change). Landslide data were separated into training data (70%) and validation data (30%). In an analysis to produce landslide susceptibility map, we use causative factors with and without LUC to see the performance. The produced landslide susceptibility maps were compared to evaluate the accuracy of each map in the study area of Ujung-Loe Watersheds, South Sulawesi, Indonesia.
Chapter 5 consists of analysis performance of land use change causative factor to produce landslide susceptibility map in comparison with three different landslide susceptibility analysis using bivariate frequency ratio, multivariate logistic regression and introduce expert choice analysis with certainty factor (CF) with 11 causative factors (elevation, slope, aspect, curvature, lithology, distance to faults, distance to river, drainage density, land use change, precipitation and distance to road). Landslide data were separated into training data (70%) and validation data (30%). The produced landslide susceptibility maps were compared to evaluate the accuracy of each map in the study area of Ujung-Loe Watersheds, South Sulawesi, Indonesia
9 Chapter 6 consists of optimized landslide causative factors (input data) to increase the accuracy of the landslide susceptibility map in Ujung-Loe Watershed, South Sulawesi, Indonesia by using logistic regression and artificial neural network approach. There is 3 type of optimized, i.e., optimized by logistic regression (forward stepwise), artificial neural network (ANN) and combination between logistic regression (forward stepwise) and ANN.
Chapter 7 summarizes and concludes the results and achievements of the study.
Problems are also highlighted for future studies.
Figure 1 Flowchart of thesis organization
10 1.6 References
Agency for Meteorology, C. and G., 2016. Rain fall Data from 2002 until 2015. Indonesian Agency for Meteorology, Climatology and Geophysics, Makassar.
Anonym. 2007. Undang-Undang Nomor 24 Tahun 2007 tentang Penanggulangan Bencana, Lembaran Negara Republik Indonesia tahun 2007 nomor 66, Jakarta.
Anonym. 2007. Undang-Undang Nomor 26 Tahun 2007 tentang Penataan Ruang, Lembaran Negara Republik Indonesia tahun 2007 nomor 68, Jakarta.
Anonym. 2007. Undang-Undang Nomor 27 Tahun 2007 tentang Pengelolaan Wilayah Pesisir dan Pulau-pulau Kecil, Lembaran Negara Republik Indonesia tahun 2007 nomor 84, Jakarta.
DIBI. 2016. Indonesian Landslide Disaster Database 2011 - 2015. Accessed on August 2016 from http://dibi.bnpb.go.id/DesInventar/dashboard.jsp
Ayalew, L., Yamagishi, H., 2005. The application of GIS-based logistic regression for landslide susceptibility mapping in the Kakuda-Yahiko Mountains, Central Japan 65, 15–31.
doi:10.1016/j.geomorph.2004.06.010
Chauhan, S., Sharma, M., Arora, M.K., Gupta, N.K., 2010. Landslide susceptibility zonation through ratings derived from the artificial neural network. Int. J. Appl. Earth Obs. Geoinf. 12, 340–350.
doi:10.1016/j.jag.2010.04.006
Crosta, G.B., Chen, H., Lee, C.F., 2004. Replay of the 1987 Val Pola Landslide, Italian Alps.
Geomorphology 60, 127–146. doi:10.1016/j.geomorph.2003.07.015
Dou, J., Bui, D.T., Yunus, A.P., Jia, K., Song, X., Revhaug, I., Xia, H., Zhu, Z., 2015. Optimization of causative factors for landslide susceptibility evaluation using remote sensing and GIS data in parts of Niigata, Japan. PLoS One 10. doi:10.1371/journal.pone.0133262
Fell, R., Corominas, J., Bonnard, C., Cascini, L., Leroi, E., Savage, W.Z., 2008. Guidelines for landslide susceptibility, hazard and risk zoning for land use planning. Eng. Geol. 102, 85–98.
doi:10.1016/j.enggeo.2008.03.022
Glade, T., 2003. Landslide occurrence as a response to land use change: A review of evidence from New Zealand. Catena 51, 297–314. doi:10.1016/S0341-8162(02)00170-4
Hasnawir, Kubota, T., Sanchez-Castillo, L., Soma, A.S., 2017. The Influence of Land use change and rainfall on shallow landslide in Tanralili Sub-watwrshed, Indonesia. J. Fac. Agric. Kyushu Univ.
62, 171–176.
Kubota, T., 2010. Shallow Landslides Distribution and Rainfall Threshold in Kelara Watershed, Indonesia 1–8.
Mugagga, F., Kakembo, V., Buyinza, M., 2012. Land use changes on the slopes of Mount Elgon and the implications for the occurrence of landslides. Catena 90, 39–46.
doi:10.1016/j.catena.2011.11.004 .
11
Chapter 2 Study Area
2.1 Introduction
Upper of Ujung-Loe Watersheds was a mountainous area and located in Bulukumba and Sinjai Regency, South Sulawesi Province, Indonesia (figure 2). It opposites with Jeneberang watershed with the big caldera of bawakaraeng. This location provides a fertile land but frequently suffers from landslide disasters. Landslide disasters occur almost every year, especially during the rainy season, which induces flash floods and debris flows in the upstream.
The upper of Ujung-Loe Watersheds is located at 119° 55' 42.34"E to 120° 8' 43.12"E and 5° 18' 19.07" S to 5° 24' 43.33" S with the altitude of 255 – 2,860 meters above sea level with areas of 79.79 km2. It provided forests covering and area of cultivation and farming.
Some areas are, particularly in the upstream part. The slope is around 38.8% with slope class
>20 degrees including a particular area at the upstream with very steep (>40 degrees).
Figure 2 Study Area
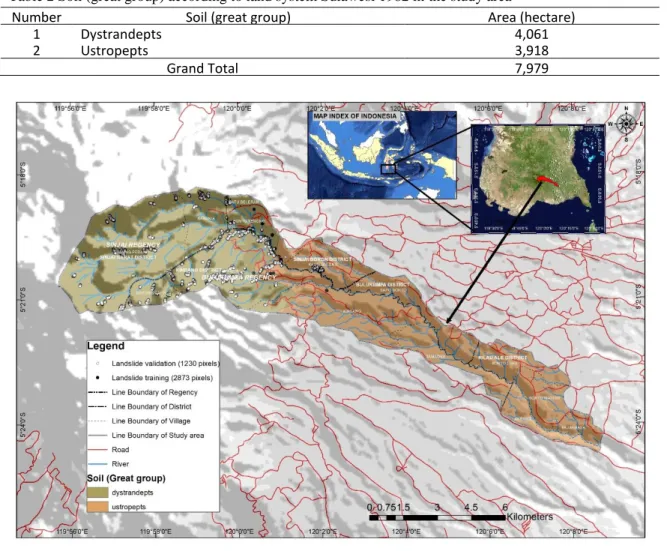
12 2.2 Soil and Land Use/Land Cover
According to map land system from Departemen Transmigrasi Indonesia (1987), soil type of the study area is dystrandepts and ustropepts (Table 2 and Figure 3).
Dystrandepts and ustropepts is an inceptisol soil. Inceptisols commonly occur on landscapes that are relatively active, such as mountain slopes, where erosional processes are actively exposing unweathered materials, and river valleys, where relatively unweathered sediments are being deposited. The different is Dystrandept with andepts formed chiefly in volcanic ash or regoliths with high componence of ash and ustropets with tropepts formed an ustic moisture regime and receive dominantly summer precipitation, or they have an isomesic, hyperthermic, or warmer temperature regime. They formed mostly in Pleistocene or Holocene
Table 2 Soil (great group) according to land system Sulawesi 1982 in the study area
Number Soil (great group) Area (hectare)
1 Dystrandepts 4,061
2 Ustropepts 3,918
Grand Total 7,979
Figure 3 Soil Map
13 deposits. Some of the soils that have steep slopes formed in older deposits (Resources and Service, 1999)
Table 3 Land use/Land cover 2015 in the study area
Number Land use/Land cover Area (hectare) Percentage
1 Primary Forest 2,527 31.67
2 Secondary Forest 2,176 27.27
3 Savanna 1,342 16.82
4 Scrub 87 1.09
5 Farming Area 1,410 17.67
6 Open Area/Paddy Field include settlement 159 1.99
7 Open Area/Paddy Field 251 3.15
8 Open Area 28 0.35
Total 7,979
Source: interpretation of Landsat 8 image recorded 2015
.
Concerning to the type of land use/land cover in the current research, 31,67% of the land surface has a primary forest cover, and 27.27 % has a secondary forest in the upper to the middle of watersheds. Moreover, land surface has a cover by savanna, farming area, paddy field and open area with 41.07% from upper to downstream of watersheds (Table 3 and Figure 4).
Figure 4 Land use/Land cover 2015 in study area
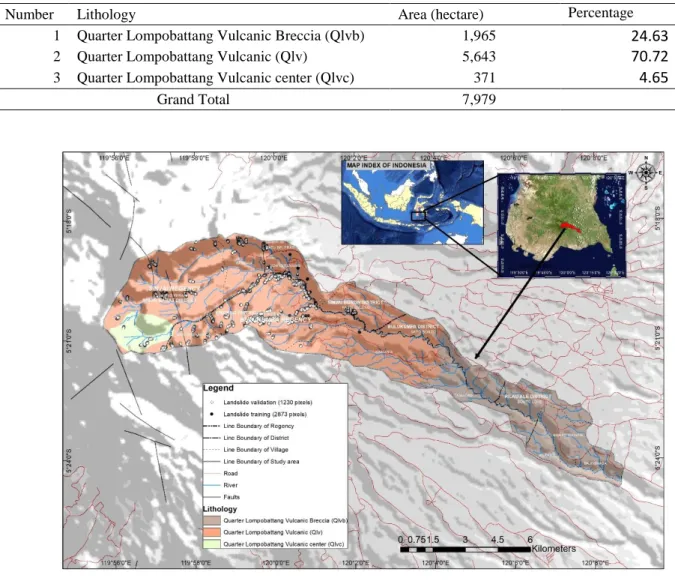
14 2.3 Geology and General Geomorphology
High relief characterizes the morphology of Upper Ujung-Loe Watershed, extreme slope (Figure 5), a high degree of weathering as well as erosion activities as soil movement and landslides. The base map on the location according to geological maps of Sulawesi consists of Quarter Lompobattang Vulcanic (Qlv), Lompobattang Vulcanic center (Qlvc), and Quarter Lompobattang Vulcanic Breccia (Qlvb)(Sukamto and S. Supriatna, 1982).
The formation of lithology in current research was dominated by Quarter Lompobattang Vulcanic (Qlv) with 70.72%, then Quarter Lompobattang Vulcanic Breccia (Qlvb) and Quarter Lompobattang Vulcanic center (Qlvc) with 24.63% and 4.65% respectively (Table 4 and Figure
Table 4 Formation of Lithology according to land system Sulawesi 1982 in the study area
Number Lithology Area (hectare) Percentage
1 Quarter Lompobattang Vulcanic Breccia (Qlvb) 1,965 24.63
2 Quarter Lompobattang Vulcanic (Qlv) 5,643 70.72
3 Quarter Lompobattang Vulcanic center (Qlvc) 371 4.65
Grand Total 7,979
Figure 5 Geology Map
15 5). The Qlv and Qlvc consist of extrusive, mafic, and polymict, which form a broad stratovolcano and quarter lompobattang volcanic were estimated starting from the last of Pliocene to early Pleistocene of volcanic rock. Qlvb consists of extrusive, mafic, and polymict, and are estimated to start from first Pleistocene to early Holocene of volcanic rock (Sukamto and S. Supriatna, 1982).
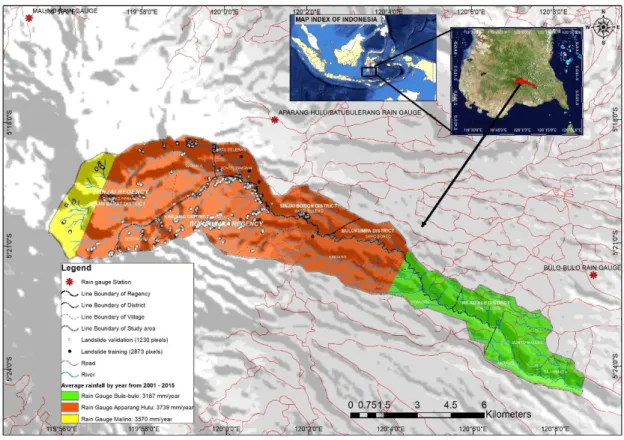
2.4 Rainfall condition
In the current research, there are three rain gauge stations, i.e., Bulo-bulo, Apparang Hulu and Malino. In Malino rain gauge station, the monthly rainfall ranges from 41 mm in August to 772 in December with period 2002 until 2015. The intense rainfall usually occurs from November to June (rainy season). There are two distinct seasons, i.e., dry and rainy. The dry season from July to October. The yearly rainfall ranges from 319 mm in 2012 to 5474 mm in
Figure 6 Graph of Rainfall by Year and Average Rainfall by Month From 2002 Until 2015 in Three Rain Gauge Station, i.e., Malino, Apparang Hulu, And Bulo-Bulo
16 2013 with average 3570 mm/year. Its annual rainfall tends to be stable in the period 2002 to 2015. In Apparang Hulu rain gauge station, the monthly rainfall ranges from 117 mm in August to 528 in December with period 2002 until 2015. The intense rainfall usually occurs from October to August (rainy season). The dry season is only in September. The yearly rainfall ranges from 1436 mm in 2004 to 5052 mm in 2013 with average 3739 mm/year. Its annual rainfall tends to increase in the period 2002 to 2015. In Bulo-bulo rain gauge station, the monthly rainfall ranges from 51 mm in September to 417 in June with period 2002 until 2015.
The intense rainfall usually occurs from November to July (rainy season). The dry season from August to October. The yearly rainfall ranges from 2010 mm in 2012 to 5711 mm in 2010 with average 3187 mm/year. Its annual rainfall tends to be stable in the period 2002 to 2015. Its annual rainfall tends to increase in the period 2002 to 2015 (Figure 6) (Agency for Meteorology, 2016).
According to polygon Thiessen analysis, Apparang Hulu station covered area 68.81% area, Bulo-bulo station covered 23.14%, and Malino station covered 7.75% (Table 5 and Figure 8).
Figure 7 Rainfall Map with Polygon Thiessen
Figure 2. 1 Population Density MapFigure 2. 7 Rainfall Map with Polygon Thiessen
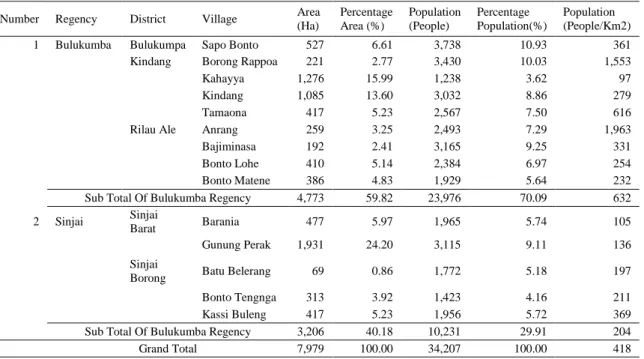
17 2.5 Socio-economic conditions
The study area is located in Bulukumba, and Sinjai regency, South Sulawesi Province, Indonesia. Socio-economic of intermediate status comparing to nearby city and regency including Makassar, Bantaeng, and Gowa. Bulukumba regency with three districts (Bulukumpa, Kindang, and Rilau Ale district) with five villages. Sinjai regency with two districts (Sinjai Barat and Sinjai borong district) with five villages. In this current research area, the highest population located in Anrang village (1,963 people/km2) and Borong Rappoa village (1,553 people/km2) (Table 6 and Figure 8). There is 70.09% of the total population located in Bulukumba regency and only 29.91% in Sinjai regency (Badan Pusat Statistik, 2016a, 2016b).
Table 5 Rain gauge station in the study area
Number Rain Gauge Station Area (hectare) Percentage
1 Bulo-bulo 1,870 23.44%
2 Apparang Hulu 5,490 68.81%
3 Malino 619 7.75%
Grand Total 7,979
Table 6 Population data of in current research location
Number Regency District Village Area
(Ha)
Percentage Area (%)
Population (People)
Percentage Population(%)
Population (People/Km2)
1 Bulukumba Bulukumpa Sapo Bonto 527 6.61 3,738 10.93 361
Kindang Borong Rappoa 221 2.77 3,430 10.03 1,553
Kahayya 1,276 15.99 1,238 3.62 97
Kindang 1,085 13.60 3,032 8.86 279
Tamaona 417 5.23 2,567 7.50 616
Rilau Ale Anrang 259 3.25 2,493 7.29 1,963
Bajiminasa 192 2.41 3,165 9.25 331
Bonto Lohe 410 5.14 2,384 6.97 254
Bonto Matene 386 4.83 1,929 5.64 232
Sub Total Of Bulukumba Regency 4,773 59.82 23,976 70.09 632
2 Sinjai Sinjai
Barat Barania 477 5.97 1,965 5.74 105
Gunung Perak 1,931 24.20 3,115 9.11 136
Sinjai
Borong Batu Belerang 69 0.86 1,772 5.18 197
Bonto Tengnga 313 3.92 1,423 4.16 211
Kassi Buleng 417 5.23 1,956 5.72 369
Sub Total Of Bulukumba Regency 3,206 40.18 10,231 29.91 204
Grand Total 7,979 100.00 34,207 100.00 418
18 The topography of the disaster-prone area in the upstream of Ujung-loe watershed is mountainous. Paddy and corn fields are limited only along the river and in terrace area.
Plantations of coffee, coconut, cacao, clove, candlenut, cashew, vanilla, pepper as well as paddy and corn fields dominate the village industry. The vegetable is grown mostly for self- consumption. They also raise cow, horses, and goats (Badan Pusat Statistik, 2016a, 2016b) 2.6 References
Agency for Meteorology, C. and G., 2016. Rain fall Data from 2002 until 2015. Indonesian Agency for Meteorology, Climatology and Geophysics, Makassar.
Ayalew, L., Yamagishi, H., 2005. The application of GIS-based logistic regression for landslide susceptibility mapping in the Kakuda-Yahiko Mountains , Central Japan 65, 15–31.
doi:10.1016/j.geomorph.2004.06.010
Badan Pusat Statistik, 2016a. Sinjai dalam Angka. Badan Pusat Statistik Kabupaten Sinjai, Sinjai.
Badan Pusat Statistik, 2016b. Bulukumba dalam Angka. Badan Pusat Statistik Kabupaten Bulukumba, Bulukumba.
Chauhan, S., Sharma, M., Arora, M.K., Gupta, N.K., 2010. Landslide susceptibility zonation through ratings derived from artificial neural network. Int. J. Appl. Earth Obs. Geoinf. 12, 340–350.
doi:10.1016/j.jag.2010.04.006
Crosta, G.B., Chen, H., Lee, C.F., 2004. Replay of the 1987 Val Pola Landslide, Italian Alps.
Geomorphology 60, 127–146. doi:10.1016/j.geomorph.2003.07.015
Dou, J., Bui, D.T., Yunus, A.P., Jia, K., Song, X., Revhaug, I., Xia, H., Zhu, Z., 2015. Optimization of causative factors for landslide susceptibility evaluation using remote sensing and GIS data in parts of Niigata, Japan. PLoS One 10. doi:10.1371/journal.pone.0133262
Fell, R., Corominas, J., Bonnard, C., Cascini, L., Leroi, E., Savage, W.Z., 2008. Guidelines for landslide Figure 8 Population Density Map
19 susceptibility, hazard and risk zoning for land use planning. Eng. Geol. 102, 85–98.
doi:10.1016/j.enggeo.2008.03.022
Glade, T., 2003. Landslide occurrence as a response to land use change: A review of evidence from New Zealand. Catena 51, 297–314. doi:10.1016/S0341-8162(02)00170-4
Hasnawir, Kubota, T., Sanchez-Castillo, L., Soma, A.S., 2017. The Influence of Land use change and rainfall on shallow landslide in Tanralili Sub-watwrshed, Indonesia. J. Fac. Agric. Kyushu Univ.
62, 171–176.
Kubota, T., 2010. Shallow Landslides Distribution and Rainfall Threshold in Kelara Watershed , Indonesia 1–8.
Mugagga, F., Kakembo, V., Buyinza, M., 2012. Land use changes on the slopes of Mount Elgon and the implications for the occurrence of landslides. Catena 90, 39–46.
doi:10.1016/j.catena.2011.11.004
Resources, N., Service, C., 1999. Soil Taxonomy. doi:10.1017/S0016756800045489
Soma, A.S., Kubota, T., 2017. The performance of Land Use Change Causative Factor on Landslide Susceptibility Map In Ujung-Loe Watersheds South Sulawesi Indonesia. Geoplanning J.
Geomatics Plan. 4.
Sukamto, R., S. Supriatna, 1982. Geologic Map of The Ujungpandang, Benteng and Sinjai Quadrangles, Sulawesi. Bandung, Indonesia. Geological Research and Development Centre, Bandung, Indonesia.
20
Chapter 3 Land Use Changes on the Slopes and the Implications for the Landslide Occurrences in Ujung-Loe Watersheds South Sulawesi Indonesia
3. 1 Introduction
Land use change (LUC) is a process by which human activities transform the landscape.
LUC has been recognized throughout the world as one of the most critical factors influencing the occurrence of rainfall-triggered landslides (Thomas Glade, 2003), and LUC can have implication to landslide occurrence on a steep slope (Mugagga et al., 2012). The correlation between intense rainfall and landslide initiation has been examined by many scholars (Bacchini and Zannoni, 2003; Crosta and Frattini, 2003), and triggering thresholds have determined.
In South Sulawesi Indonesia, LUC has been translated into numerous landslide incidents triggered by the intensity of rainfall compared to other factors such as earthquakes, especially in Ujung-Loe upper watershed. The topography is naturally very steep and mountainous (38.8%
class slope >20 degrees) and has a very high level of instability, especially during the rainy season (annual rainfall 1436 mm/year – 5052 mm/year period 2002 to 2015 at Apparang Hulu rain gauge (Meteorology, climatology and geophysics Makassar, 2016)). The primary occupation of social community in that area is farming and located in the mountainous area. It is hard to avoid this agricultural practices because this has be become people's culture for agriculture in mountainous regions and have made it hereditary. Rudiarto and Doppler (2013) said that in Indonesia, where many upland areas can found, land use/cover change for the extension of agriculture activity commonly occurs.
The objectives of the study are examining to quantify the LUC in the study area during 2004 to 2011 and establish the relationship between LUC, topographic parameters (slope) and landslide occurrence.
21 3. 2 Material and Method
This study utilized Landsat satellite images on scene path 114 row 064 of 2004 and 2011.
Landsat 5 TM (date recorded September, 21th 2004) and Landsat 7 ETM+ (date recorded October, 11th 2011) images, each with a 30 m resolution, and Aster DEM 30m, are collected from United States Geological Survey (USGS) at website http://earthexplorer.usgs.gov/.
Resolution of pixel was 30 x 30 meter with total pixel 88,879 and 383 pixels for a landslide.
Landsat images have been registered and geo-corrected from the source. The atmospheric correction has been conducted with the use of vegetation delineation function was through to the ArcGIS software package version 10.3. Also, the radiometric correction has been carried out by using the Landsat calibration function within the tools of Arc GIS 10.3 software.
Remote sensing and GIS (RSGIS) techniques have shown great potential in land use mapping and monitoring due to its advantages over traditional procedures regarding cost- effectiveness and timeliness in the availability of information over larger areas (Armentaras et al.,2003; Franklin, 2001). RSGIS techniques were employed to classify land use. The unsupervised classification method is applied to classify land use. The unsupervised classification consists of three step: (1) Creation of N spectral-class maps using Iterative Self- Organizing Data Analysis Technique Algorithm; (2) development of Land use (LU) maps with assistance of reference data; and (3) accuracy assessments of all the LU maps using independent reference data and selection of one LU map with the highest accuracy (Ruili et. al., 2008). This method is applied to classify land use into seven classes, i.e., open area, paddy field, farming area, scrub, savanna, secondary forest and primary forest. The certified maps, which were generated, classified and validated by using ground control points method in the same year of Landsat images and google earth pro imagery map, were used to measure the accuracy assessment. Overall accuracy values of 86%, 90% and Kappa values of 0.83, 0.88 were achieved for the unsupervised classified maps of 2004 and 2011, respectively. In this research, land use was analysis by unsupervised classification and classify in five classes. The five class
22 were no vegetation (open area), sparse vegetation (paddy field), medium vegetation (farming area and shrub, savana), high vegetation (secondary forest) and dense vegetation (primary forest) is conducted. Slope was divided into 6 clases i.e. 0 -10, 10-20, 20-30, 30-40, 40-50 and
>50 degrees by analysis in software ArcGIS 10.3 (Fig. 3b). Historical landslide inventory was delineated in google earth pro with high-resolution image time series from 2012 to 2014 (Figure 10 and Figure 11). Moreover, the framework of this research follows Figure 9. To see the correlation between the LUC, slope and landslide occurrence was conducted by statistical analysis (binary logistic regression). Categorical data were arbitrarily coded to convert it to nominal data. Binary logistic regression formula is Equation 3.1;
𝑃 = 1
1+exp−∑βi x ij (3.1) where P is Probability, β is regression coefficients, and ij is variable at observation (LUC and slope).
Figure 9 Research framework
Land Use Change on the slope to landslide occurance Atmospheric and radiometric
corrections
Landsat Image 5 TM 2004 and Landsat 7 ETM+
(2011) (Gap and Fill)
Analyze Unsupervised classification of Landsat 5 TM recorded 2004, and Landsat 7 TM record
2011 Composite Band 543
Accuracy assessment
Historical Landslide Distribution
Delineating Landslide by high resolition Image Satellite
from 2012 to above
Generating Land Use Change map and Statistics of 2004 and 2011 Slope
2004 2011
2012 and above Land use change 2004 to 2011
Landslide Occurence Selected
23 3. 3 Results and Discussion
Based on GIS and remote sensing analysis, it is found that the highest increasing land use change (LUC) was medium-vegetation with 45.29% from 2004 to 2011, follow by high vegetation and sparse vegetation, with increasing 41.64% and 19.08 respectively. Moreover, the highest decreasing was no vegetation with 60.69%. Then dense vegetation with 45.72% is declining (see Table 7, Figure 12). The significant trend of increasing average rate of LUC
a) b)
Figure. 3. a) Landslide inventory b) Slope study area in degree
Figure 10 a) Landslide inventory b) Slope study area in degree
Figure 11 Landslide photo
24 were medium vegetation and high vegetation with the mean rate of change 5.66% and 5.21%
respectively. Moreover, the significant trend of decreasing average rate of LUC was no vegetation and dense vegetation with the mean rate of change -7.59% and -5.71% respectively.
LUC confirmed the growth of the medium-vegetation class from 25.22% from total area in 2004 to 36.64% in 2011 with the highest change from high vegetation; it happened because of the increased rates of farming areas (Figure 13). This rising rate can attribute to the growing population in need of agricultural land in the study area. Moreover, the increasing population rate was 1.15%, primarily by farm workers and people with education below junior high school (Central Bureau of Statistics of South Sulawesi Indonesia, 2013). On the other hand, the class of dense vegetation decreased from 1,685 ha in 2004 to 914 ha in 2011 or decreased 96.27 ha per year because of open land for farming and illegal logging in dense forest areas. Perceived susceptibility and severity of land degradation strongly influence farmers’ awareness of and attitude toward environmental problems (Bayard et. Al., 2006).
Landslides have occurred 128 times in 2012 to 2014. The highest landslides were in 2013 with 93 times. They were happening with rainfall with 5,052 mm/year and intensity 27.8 mm/day in 2013 (Meteorology, climatology and geophysics Makassar, 2016). The significant derivate factor of land use/cover change to landslides in the study area was shown in Figure 14.
Results of the land use/cover to landslides occurrence analysis confirmed the highest of LUC from high vegetation to medium vegetation on the slope >30 degrees with 82 landslides occurrence with the high intensity of rainfall, particularly in 2013. It happens because the decrease in the vegetation can make adverse influence to the stability slope as Kubota et al.
(2007) said that land with forest by the root system would reinforce the soil strength and stabilize the slope. Moreover, the probability of landslide occurrence, particularly shallow landslides increases and is very sensitive to short-lasting high intensive rainfall (Hasnawir and Kubota, 2012; Aditian and Kubota, 2017).
25 Table 7 Land Use Change from 2004 to 2011
Land Use Density Class
2004 Land Use Density Class area
2011 Land Use Density Class area
Change between 2004
to 2011
Average rate of change
pixels ha % pixels ha % ha % ha/year %
No Vegetation 15470 1392 17.41 6081 547 6.84 -845 -60.69 -105.63 -7.59 Sparse Vegetation 25021 2252 28.15 29794 2681 33.52 430 19.08 53.70 2.38 Medium Vegetation 22416 2017 25.22 32568 2931 36.64 914 45.29 114.21 5.66 High Vegetation 7255 653 8.16 10276 925 11.56 272 41.64 33.99 5.21 Dense Vegetation 18717 1685 21.06 10160 914 11.43 -770 -45.72 - 96.27 -5.71 Grand Total 88879 7999 100.00 88879 7999 100.00
Figure 12 Landsat 5 TM recorded 2004 band 543; b) Landsat 5 TM recorded 2011band 543; c) Land use 2004 (7 classes); d) Land use 2011 (7 classes); e) Land use 2004 (5 classes); and f) Land use 2004 (5 classes)
26 Figure 13 Histogram of Land Use Change from 2004 to 2011
Figure 14 Land Use Change from 2004 to 2011 on Landslide Occurrence
Figure 15 Slope and Land Use Change from 2004 to 2011 on Landslide Occurrence
17.41
28.15 25.22 8.16
21.06
6.84
33.52 36.64 11.56
11.43
- 5.00 10.00 15.00 20.00 25.00 30.00 35.00 40.00 No Vegetation
Sparse Vegetation Medium Vegetation High Vegetation Dense Vegetation
Percentage (%)
Land Use
2011 2004
27 Figure 16 General land use change from 2004 to 2011 on landslide occurrence
Table 8 Variables in the Equation of Slope and Land Use Change
B S.E. Wald df Sig. Exp(B)
Step 1a slope .662 .034 384.242 1 .000 1.939
Land use change .312 .108 8.327 1 .004 1.367
Constant -7.729 .160 2319.998 1 .000 .000
a. Variable(s) entered on step 1: slope, land use change.
Logistic regression analysis indicates that LUC (from the dense vegetation to high vegetation, high vegetation to medium vegetation respectively, and so on) has influences on landslide occurrences. Further statistical analysis showed that in term of influence to landslide occurrences, slope showed greater influence (B-intercept: 0.662) compared to individual LUC (B-intercept: 0.312) (Table 8 and Figure 16). It was like as Bergueria and Santiago (2005) that LUC affects with the landslide occurrences.
3. 4 Conclusion
Based on the obtained results and subsequent discussions, the following conclusions are presented:
1. The significant decrease of land use change (LUC) in 2004 to 2011 was observed at Ujung-Loe watersheds in no vegetation (-7.59%), and dense vegetation class (-5.7%) while the increased LUC was found in the class of medium vegetation (5.66%) and high vegetation (5.21%).
28 2. Landslides have occurred most dominantly in the one with the LUC from high
vegetation to medium vegetation on slope 30 – 40 degrees.
In general, LUC in Ujung-Loe watershed indicates a significant effect on landslides occurrence and slope instability.
3. 5 References
Aditian, Aril, and Kubota, Tetsuya, 2017. The influence of Increasing Rainfall Intensity on Forest Slope Stability in Aso Volcanic Area, Japan. International Journal of Ecology and Development vol.
32 number 1 page 66-74
Armentaras, D., Gast, F., Villareal, H., 2003. Andean forest fragmentation and the representativeness of protected areas in the Eastern Andes, Colombia. Biological Conservation 113, page 245–256.
Bacchini, M., Zannoni, A., 2003. Relations between rainfall and triggering of debris flows: case study of Cancia (Dolomites, north-eastern Italy). Natural Hazards and Earth System Sciences 3, page 71–79.
Bergueria, Santiago, 2005. Changes in land cover and shallow landslide activity: A case study in the Spanish Pyrenees. Elsevier: Geomorphology 74, page 196– 206.
Buddy Bayard, Curtis M. Jolly, Dennis A. Shannon, Alejandro A. Lazarte, 2006. Low-income Farmers’
Behavior Toward Land Degradation: The Effects of Perceptions, Awareness, Attitude, and Land Use. International Journal of Ecological Economics and Statistics, vol. 6 number 3 page 56-63.
Central Bureau of Statistics of South Sulawesi Indonesia, 2013. Sulawesi Selatan 2013 in Figures.
Badan Pusat Statistik Provinsi Sulawesi Selatan, Makassar.
Crosta, G.B., Frattini, P., 2003. Distributed modeling of shallow landslides triggered by intense rainfall.
Natural Hazards and Earth System Sciences 3, 81–93.
Franklin, S., 2001. Remote sensing for forest management. Lewis, FL.
Hasnawir and Tetsuya Kubota, 2012. Rainfall threshold for shallow landslide in Kelara Watersheds, Indonesia. Internasional Journal of Japan Erosion Control Engineering Technical Note 5(No.1):86-92
Agency of Meteorology, climatology and geophysics Makassar, Indonesia, 2016. Rainfall data from 2002 to 2016. BMKG, Makassar, Indonesia
Mugagga, F., Kakembo, V., Buyinza, M., 2012. Land use changes on the slopes of Mount Elgon and the implications for the occurrence of landslides. Catena 90, page 39-46.
Rudiarto I, Doppler W.,2013. Impact of land use change in accelerating soil erosion in Indonesian upland area: A case of Dieng Plateau, Central Java – Indonesia. International Journal of AgriScience Vol. 3(7): 558-576.
Ruili Lang, Guofan Shao, Bryan C. Pijanowski, Richard L. Farnsworth, 2008. Optimizing unsupervised classifications of remotely sensed imagery with a data-assisted labeling approach. Computer and Geoscience vol 34 page 1877-1885.
Tetsuya Kubota, Omura, H., and Devkota, B.D., 2007. Influence of The Forest on Slope Stability with Different Forest felling Condition. EGU General Assembly 2007 Vienna.
Thomas Glade, 2003. Landslide occurrence as a response to land use change: a review of evidence from New Zealand. Catena vol 51 page 297 – 314.
29
Chapter 4 Performance of Land Use Change Causative Factor on Landslide Susceptibility Map in Upper Ujung-Loe Watersheds South Sulawesi Indonesia
4. 1 Introduction
Land use changes (LUC) has increased the level of vulnerability to landslides, especially in mountainous regions. It is recognized throughout the world as one of the most critical factors influencing the occurrence of rainfall-triggered landslides (Glade, 2003). It implies to landslide occurrence on a steep slope (Mugagga et al., 2012).
In South Sulawesi Indonesia, especially in Ujung-Loe upper watershed, LUC has been translated into numerous landslide incidents triggered by the intensity of rainfall compared to other factors such as earthquakes. The topography is extremely steep and naturally mountainous (38.8% class slope >20 degrees). It has a very high level of instability, especially during the rainy season. The annual rainfall can reach 1,436 to 5052 mm/year with average annual rainfall of 3,739 mm/year. The main occupation of social community in that area is farmer. Most of them live and do their activity in mountainous area. Avoiding this agricultural practice is hard.
It has become people's culture for agriculture in mountainous regions, and they have made it hereditary (Soma and Kubota, 2017).
Landslide susceptibility was defined as quantitative or qualitative assessment classification, volume (or area), and the spatial distribution of landslides or potentially may occur in the zone. Susceptibility can also include a description of the speed and intensity of existing or potential landslides (Fell et al., 2008). Using scientific analysis of landslides, we can assess and predict landslide susceptibility and decrease landslide damage through proper preparation (Lee et al., 2002).
A few studies have evaluated land use change (LUC) that contributed to landslide occurrence (García-Ruiz et al., 2010; Glade, 2003; Mugagga et al., 2012; Soma and Kubota,