Mergers and Acquisitions in a Transition Economy : Recent Experiences of China and India
著者 NAGANO Mamoru, YUAN Yuan
出版者 Institute of Comparative Economic Studies, Hosei University
journal or
publication title
比較経済研究所ワーキングペーパー
volume 132
page range 1‑21
year 2007‑10‑12
URL http://hdl.handle.net/10114/3981
Mergers and Acquisitions in a Transition Economy: Recent Experiences of China and India
Mamoru Nagano† Yuan Yuan‡
ABSTRACT
This paper examines the causes and consequences of mergers and acquisitions in a transition economy using the 1998-2005 deal data for targeted Chinese and Indian firms. Our empirical analysis resulted in three important findings. First, firms with high cash reserve ratio are likely to be targeted in the recent cross-border acquisition trends in China and India. Second, cross-border acquisitions brought higher shareholders’ values than those made by domestic acquirers. Third, own industry acquisitions also brought higher shareholders’ values in these countries.
JEL Classification: O21, O25, G34
Keywords: Transition Economy, Mergers and Acquisition
I. Introduction
There is a vast literature on corporate acquisitions including several empirical studies on the causes and consequences of mergers and acquisitions. Some suggested technological innovations, industrial deregulations and changes in demographic structures as the major causes. Others reported that acquisitions brought about both positive and negative impacts in the post-acquisition period. Most of the literature used datasets of U.S. firms, but the number of studies using data from other countries
purchasing power of foreign acquirers following the currency devaluation and stock price fall in the region. Other triggers mentioned included the widespread privatization of state-owned enterprises and deregulation of capital transactions.
However, ten years have passed since the crisis and the number of corporate acquisitions has been increasing still, especially in emerging countries. Remarkably, transition economies that did not experience currency crisis recorded even larger number of mergers and acquisitions. One possible reason for this dramatic increase is that foreign firms have become more aggressive purchases of the released shares of state-owned enterprises, at the same time that governments in transition economies have been promoting inward investments by deregulating the existing legislations.
According to United Nations Conference on Trade and Development, total international direct investment exceeded US$ 900 billion in 2005 with a significant increase contributed by the emerging countries. In fact, cross-border corporate acquisitions accounted for forty two percent of international direct investment flow in the same year. The Chinese Eleventh Five-year plan of 2006 explains how the government regards the recent acquisition trend and the purpose of inward investment promotion policy. Specifically, the government expects incoming cross-border acquisition to bring with it advanced technology, stronger managerial discipline, and wider international delivery channels in addition to larger private equity funds. This background suggests that merger waves would hit both industrialized and emerging countries more frequently, resulting in higher international direct investments. For emerging transition economies, governments are more likely to take this approach to activate stagnating firms.
A series of literature using U.S. sample firms pointed out three factors that encourage acquisition to contribute to corporate value maximization. First, an acquisition enables the acquirer to obtain new technology and higher productivity1. Second, the acquirer expects the corporate acquisition to improve the managerial discipline of the targeted firm as noted by Jensen (1986) and Bhagat et al.. (2005).
Third, shareholders’ potential rights to eliminate nonperforming managers contribute to an increase in corporate value regardless of the turnover by acquisition2. While, the number of existing literature on mergers and acquisitions focusing on China and India is very small, the above implications from existing literature can be used to explain the recent acquisition trend in transition economies. It is possible that the Chinese and the Indian governments let privatized state-owned firms to obtain the synergy effect and managerial discipline by promoting corporate acquisition. In the case of cross-border acquisitions, the expected return from a transfer of new technology, management know-how, and more international delivery channels seem
1 See Bradley, et.al (1988) , Andrade et.al.(2001) and Mitchell and Mulherin(1996), for example.
2 Morck et.al.(1998) and Lang. et.al.(1989) discussed this matter in the existing literatures.
to be attractive enough to increase the productivity of state-owned firms in China and India.
Based on the above background, this paper will examine three propositions. The first is to verify common characteristics of target firms that acquirers prefer. We will empirically test what determinants influence the acquirer’s investment decision by looking at the type of deals. The second is to find out how the capital market evaluates the announcement of acquisition. In particular, the types of acquisition that bring larger shareholder’s value will be examined. The third is to verify and evaluate universal common characteristics of acquirers that bring larger shareholder’s value.
By using acquisition deal data matched with firms’ financial statements, this paper derives conclusions of causes and consequences of the above in China and India.
II. Data
The empirical data are obtained from Bloomberg’s “M&A League Table”. The data set covers all the announced data of the world including deals with low percentage of stock targeting ratio and those in emerging countries. We used sample data of deals announced from January 1, 1998 – December 31, 2005. Sample targeted firms refer to both listed and unlisted firms in China and India. We extracted announced deals with more than fifty percent of targeted stock holding ratio.
Differing from existing studies focusing on target firms in the industrialized countries, we did not set any lower bound for the total amount of deal value. The acquirers refer to all domestic and foreign listed firms, except firms in the financial sector and utilities. We also excluded in the sample those acquirers with more than two deals within five business operating days because it is difficult to specify which deal influenced an increase in the acquirer’s stock price. Information on type of payment in China and India are not covered by Bloomberg’s database and difficult to obtain from any other databases, and are also excluded in this study3.
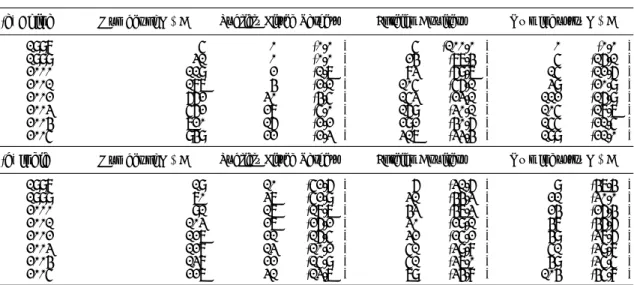
Table 1 suggests that the number of acquisitions in China and India dramatically increased since 2002. In China, the number grew from 187 in 2001 to 949
targeted by foreign acquirers for both countries at more than thirty percent of total deals.
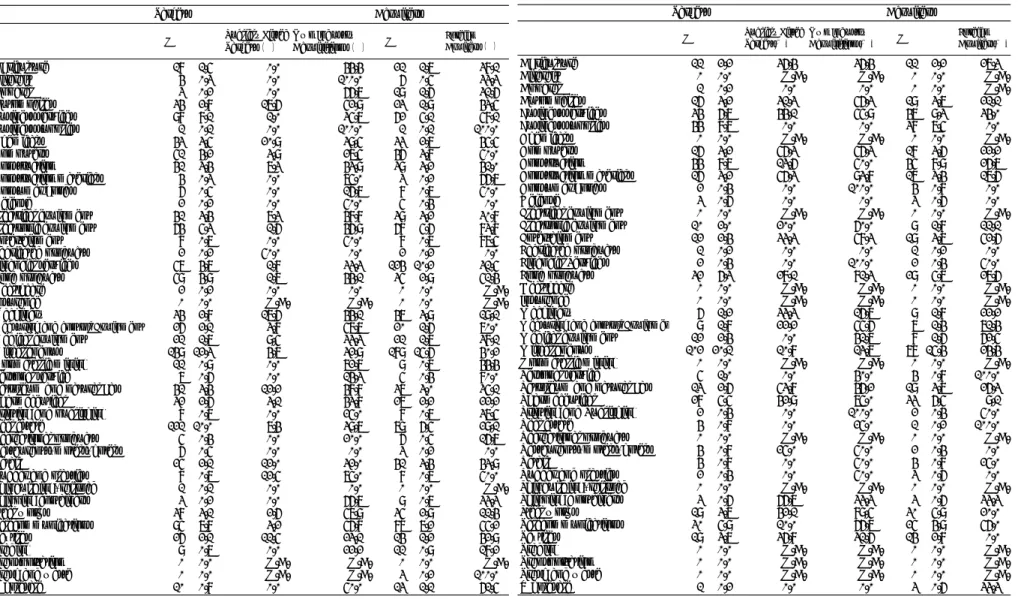
In terms of targeted industrial group, Table 2 shows a large number of targeted firms in real estate business and construction, reflecting the recent domestic construction boom in Chinese and Indian metropolitan areas. The number of firms in telecommunications is also large in China which can be attributed to the recent progress of deregulation in this sector since China joined WTO in 2001. The number in financial services is also large in China and in the pharmaceutical industry in India.
These data point to the common trend of an increasing number in targeted firms in the recently deregulated industrial group. However, country specific factors also exist as shown in Chinese financial business and Indian pharmaceutical industry.
This paper employs three approaches in examining the causes and consequences of acquisitions in China and India. The first approach examines if determinants of targets influencing an acquirer’s decision differ between domestic deals and cross-border deals. The second approach is to verify what types of deals recorded high cumulative abnormal returns by using event study. This approach adopts the methodology of Brown&Warners (1985) and examines if there are
differences between domestic and cross-border deals. Third, is to examine what type of acquirer’s character brings about high abnormal returns for both domestic and cross-border deals. Taking into consideration the acquisition boom during the period, the sample period for the first approach covers 2001-2005. The second and third approaches employ data from 1998 to 2005 and from 2000 to 2005, respectively.
Table 1 Number of Mergers and Acquisitions in China and India
(a) China Number of M&A
1998 5 0 (0.0%) 5 (100.0%) 0 (0.0%)
1999 31 0 (0.0%) 24 (77.4%) 5 (16.1%)
2000 119 2 (1.7%) 83 (69.7%) 15 (12.6%)
2001 187 4 (2.1%) 105 (56.1%) 39 (20.9%)
2002 662 30 (4.5%) 153 (23.1%) 112 (16.9%)
2003 562 28 (5.0%) 169 (30.1%) 105 (18.7%)
2004 720 16 (2.2%) 292 (40.6%) 155 (21.5%)
2005 949 22 (2.3%) 317 (33.4%) 199 (21.0%)
(b) India Number of M&A
1998 19 10 (52.6%) 6 (31.6%) 9 (47.4%)
1999 70 37 (52.9%) 31 (44.3%) 21 (30.0%)
2000 91 17 (18.7%) 43 (47.3%) 24 (26.4%)
2001 103 27 (26.2%) 30 (29.1%) 48 (46.6%)
2002 127 21 (16.5%) 32 (25.2%) 49 (38.6%)
2003 128 13 (10.2%) 51 (39.8%) 51 (39.8%)
2004 138 22 (15.9%) 51 (37.0%) 49 (35.5%)
2005 227 31 (13.7%) 79 (34.8%) 104 (45.8%)
Publicly Listed Targets Foreign Aquirers Own Industry M&A Publicly Listed Targets Foreign Aquirers Own Industry M&A
Source: Authors’ Calculation Based on Bloomberg
Note: The sample contains all completed mergers and acquisitions in China and India between 1998 and 2005. Targets are comprised of public, private, and subsidiary firms. Acquirers include both foreign and domestic firms. Samples are the announced deals with more than fifty percent of targeted stock holding ratio. No lower bound for the total amount of deal value is set. The acquirers are all domestic and foreign
listed firms except firms in the financial sector and utilities. Deals with more than twice within five business operating days are excluded from the samples.
Table 2. The Number of Takeover Activity in China and India (1998-2005)
(a) China (b) India
N % Publicly Listed
Targets (%) Own Industry
Acquisitions (%) N % Foreign Aquirers (%)
Agriculture 18 1.5% 0.0% 44.4% 21 1.7% 38.1%
Aircraft 4 0.3% 0.0% 100.0% 6 0.5% 33.3%
Apparel 3 0.2% 0.0% 66.7% 19 1.6% 31.6%
Automobiles 34 2.8% 17.6% 52.9% 23 1.9% 43.5%
Business services 98 8.1% 1.0% 35.7% 62 5.1% 58.1%
Business supplies 1 0.1% 0.0% 100.0% 1 0.1% 100.0%
Chemicals 43 3.5% 20.9% 39.5% 33 2.7% 45.5%
Computers 51 4.2% 3.9% 27.5% 46 3.8% 50.0%
Construction 41 3.4% 7.3% 43.9% 39 3.2% 41.0%
Construction materials 4 0.3% 0.0% 75.0% 3 0.2% 66.7%
Consumer goods 6 0.5% 0.0% 16.7% 8 0.7% 50.0%
Defense 2 0.2% 0.0% 50.0% 5 0.4% 0.0%
Electrical equipment 41 3.4% 7.3% 48.8% 39 3.2% 30.8%
Electronic equipment 64 5.3% 1.6% 46.9% 68 5.6% 83.8%
Entertainment 8 0.7% 0.0% 50.0% 8 0.7% 87.5%
Fabricated products 2 0.2% 50.0% 0.0% 2 0.2% 0.0%
Financial services 57 4.7% 1.8% 33.3% 124 10.2% 31.5%
Food products 59 4.9% 1.7% 44.1% 35 2.9% 51.4%
Healthcare 2 0.2% 0.0% 0.0% 0 0.0% N.A.
Insurance 0 0.0% N.A. N.A. 0 0.0% N.A.
Machinery 34 2.8% 17.6% 44.1% 47 3.9% 19.1%
Measuring and control Equipment 26 2.1% 3.8% 57.7% 20 1.6% 70.0%
Medical equipment 21 1.7% 9.5% 33.3% 21 1.7% 38.1%
Miscellaneous 149 12.3% 4.7% 32.9% 189 15.6% 40.2%
Nonmetallic mining 11 0.9% 0.0% 72.7% 9 0.7% 44.4%
Personal service 7 0.6% 0.0% 14.3% 5 0.4% 80.0%
Petroleum and natural gas 41 3.4% 12.2% 48.8% 37 3.0% 35.1%
Pharmaceutical 32 2.6% 3.1% 43.8% 27 2.2% 22.2%
Printing and publishing 8 0.7% 0.0% 25.0% 8 0.7% 37.5%
Real estate 121 10.0% 7.4% 39.7% 79 6.5% 29.1%
Recreational products 5 0.4% 0.0% 20.0% 6 0.5% 16.7%
Restaurants, motels, hotels 6 0.5% 0.0% 0.0% 3 0.2% 0.0%
Retail 25 2.1% 12.0% 32.0% 41 3.4% 43.9%
Rubber and plastics 8 0.7% 12.5% 75.0% 8 0.7% 50.0%
Shipbuilding, railroad 1 0.1% 0.0% 0.0% 0 0.0% N.A.
Shipping containers 3 0.2% 0.0% 66.7% 9 0.7% 33.3%
Steel works 38 3.1% 2.6% 57.9% 35 2.9% 11.4%
Telecommunications 95 7.8% 3.2% 56.8% 87 7.2% 55.2%
Textiles 26 2.1% 11.5% 23.1% 14 1.2% 42.9%
Trading 9 0.7% 0.0% 22.2% 11 0.9% 18.2%
Transportation 0 0.0% N.A. N.A. 0 0.0% N.A.
Trash and waste 0 0.0% N.A. N.A. 3 0.2% 100.0%
Wholesale 10 0.8% 0.0% 50.0% 13 1.1% 61.5%
Targets Acquirers
N % Publicly Listed Targets(%)
Own Industry
Acquisitions(%) N % Foreign Aquirers(%)
Agriculture 11 2.2% 36.4% 36.4% 11 2.2% 27.3%
Aircraft 0 0.0% N.A. N.A. 0 0.0% N.A.
Apparel 1 0.2% 0.0% 0.0% 0 0.0% N.A.
Automobiles 16 3.2% 31.3% 56.3% 19 3.7% 21.1%
Business services 34 6.7% 44.1% 55.9% 47 9.3% 34.0%
Business supplies 44 8.7% 0.0% 0.0% 38 7.5% 0.0%
Chemicals 0 0.0% N.A. N.A. 0 0.0% N.A.
Computers 16 3.2% 56.3% 56.3% 18 3.6% 22.2%
Construction 44 8.7% 13.6% 50.0% 45 8.9% 26.7%
Construction materials 16 3.2% 56.3% 93.8% 17 3.4% 17.6%
Consumer goods 2 0.4% 0.0% 100.0% 4 0.8% 0.0%
Defense 3 0.6% 0.0% 0.0% 3 0.6% 0.0%
Electrical equipment 0 0.0% N.A. N.A. 0 0.0% N.A.
Electronic equipment 10 2.0% 20.0% 60.0% 9 1.8% 11.1%
Entertainment 12 2.4% 33.3% 58.3% 19 3.7% 52.6%
Fabricated products 1 0.2% 0.0% 0.0% 1 0.2% 0.0%
Financial Services 2 0.4% 0.0% 100.0% 2 0.4% 50.0%
Food products 32 6.3% 28.1% 81.3% 29 5.7% 27.6%
Healthcare 0 0.0% N.A. N.A. 0 0.0% N.A.
Insurance 0 0.0% N.A. N.A. 0 0.0% N.A.
Machinery 6 1.2% 33.3% 16.7% 9 1.8% 22.2%
Measuring and control Equipmen 9 1.8% 22.2% 55.6% 7 1.4% 71.4%
Medical equipment 12 2.4% 0.0% 41.7% 8 1.6% 62.5%
Miscellaneous 102 20.1% 10.8% 13.7% 78 15.4% 24.4%
Nonmetallic mining 0 0.0% N.A. N.A. 0 0.0% N.A.
Personal service 5 1.0% 0.0% 40.0% 4 0.8% 100.0%
Petroleum and natural gas 13 2.6% 53.8% 46.2% 19 3.7% 26.3%
Pharmaceutical 28 5.5% 42.9% 75.0% 33 6.5% 9.1%
Printing and Publishing 2 0.4% 0.0% 100.0% 2 0.4% 50.0%
Real estate 4 0.8% 0.0% 25.0% 1 0.2% 100.0%
Recreational products 0 0.0% N.A. N.A. 0 0.0% N.A.
Restaurants, motels, hotels 4 0.8% 25.0% 50.0% 2 0.4% 0.0%
Retail 4 0.8% 0.0% 50.0% 4 0.8% 25.0%
Rubber and plastics 2 0.4% 0.0% 50.0% 3 0.6% 0.0%
Shipbuilding, railroad 0 0.0% N.A. N.A. 0 0.0% N.A.
Shipping Containers 3 0.6% 66.7% 33.3% 3 0.6% 33.3%
Steel works 19 3.7% 42.1% 89.5% 30 5.9% 20.0%
Telecommunications 30 5.9% 10.0% 66.7% 25 4.9% 56.0%
Textiles 19 3.7% 36.8% 31.6% 14 2.8% 0.0%
Trading 0 0.0% N.A. N.A. 0 0.0% N.A.
Transportation 0 0.0% N.A. N.A. 0 0.0% N.A.
Trash and waste 0 0.0% N.A. N.A. 0 0.0% N.A.
Wholesale 1 0.2% 0.0% 0.0% 3 0.6% 33.3%
Targets Acquirers
Source: Authors’ Calculation Based on Bloomberg
Note: this table reports, by industry, the fraction of sample firms that were acquired in 1998-2005. Targets are comprised of public, private, and subsidiary firms. Industry data are organized using Fama and French (1997) industry classifications. Column 3 and 7 report the number and percentage of acquirers and targets, respectively, in a particular industry. Column 4 and 5 report percentage of targets publicly listed and acquired by in their own industry, respectively.
III. Common Characteristics of the Chinese and Indian Targets
This section addresses the characteristics of targets that influence an investment decision of domestic and foreign acquirers. There are several studies that focused on this issue. By examining the free-cash flow problem and using it as a proxy for non-working internal control mechanisms of the firm, Hanson (1992) and Smith and Kim (1994) suggested that cash-rich firms are likely to be targeted. Using another approach, Hasbrouck (1985) and Morck et al.(1988) have shown that firms with high growth opportunities are less likely to be targeted because such firms do not need any external intervention. Existing literature generally focus on the relationship between characteristics of targets and efficiency of internal management mechanisms as suggested by Palepu(1986), Song and Walkling(1993) and Harford (1999). Our study also employs the same variables since firms in a transition economy need more external intervention.
Our study uses the acquisition’s deal data and financial data of the listed targets in China and India from 1999 to 2005, and extracts deals with more than 50 percent targeting share of stock acquisition. Reflecting the above literature together with the Chinese and Indian country specific backgrounds, our first hypothesis is that the volume of internal cash reserve influences an investment decision of acquirer for both China and India. This is because there is stronger intervention in the internal corporate mechanism of cash-rich state-owned firms under a share releasing plan by the government. Our second hypothesis is that firms with high growth opportunities are likely to be targeted, contrary to the findings of existing literature. We consider foreign acquirers to have much larger purchasing power and incentives to maximize returns when the target shows good growth opportunity.
Our empirical model as shown in equations (1.1) and (1.2) employs 1 as a dependent variable when the firm is the target of an acquisition attempt and others are 0 in year t. The independent variable is the three-year averaged financial data.
Therefore, the dependent variables are virtually the announced deals in 2001-2005.
Seven industrial dummy and four year dummy variables are added to the equations.
it i t it it
it it
it it
it const SIZE DER CASH FIXED ROA MBR d u v
y1 = +α1 +α2 +α3 +α4 +α5 +α5 + + +
(1.1)
' ' ' 5
5 4
3 2
1 ' 2
it i t it it
it it
it it
it const SIZE DER CASH FIXED ROA MBR d u v
y = +β +β +β +β +β +β + + +
(1.2)
y1: “=1 “when the firm is the target of a domestic acquisition attempt in year t, “=0” when the firm is not the target of neither domestic nor cross-border acquisition attempt in year t, y2 : “=1 “ when the firm is the target of a cross-border acquisition attempt in year t, “=0” when the firm is not the target of neither
domestic nor cross-border acquisition attempt in year t, SIZE: Logarithm of Total Assets, DER: Total Liability/Market Valued Capital, CASH: Cash Reserves/ Total Assets, FIXED: Fixed Assets/Total Assets, ROA: Return on Assets, , MBR: (Book Value of Total Liability + Market Value of Capital )/ Book Value of Total Assets
Our empirical analysis showed that in the case of acquisitions between domestic acquirers and targets in China, parameters of firm size, cash reserve ratio and fixed assets ratio are significant with the firm size negative and those of cash reserve ratio and fixed assets positive. In India, parameters of firm size and debt to equity ratio of firms are both negatively significant. For cross-border acquisitions, parameters of cash reserve ratio and market to book ratio are positively significant in China, while cash reserve ratio and fixed assets ratio are both positively significant in case of Indian firms.
These results confirm our first hypothesis that firms with ample cash are likely to be targeted, at least for Chinese firms. The same is true for cross-border acquisition in India. This variable is a proxy if there is intervention in the management of firms.
Therefore, our empirical results suggest that the cash rich Chinese and Indian firms would need acquirers’ intervention for them to operate efficiently.
On the other hand, it is difficult to confirm our second hypothesis. The parameter of market to book ratio in the case of cross-border acquisitions in China is positively significant and supports the hypothesis. However, those in other three equations are insignificant. The parameter firm size is negatively significant for both Chinese and Indian domestic acquisitions. Mikkelson and Partch (1989) and Song and Walkling (1993) also reported that size negatively relates to target incidence. Our study also found a similar trend in this variable. Parameters of several industrial dummy variables are significant. These suggest that industrial effects are also important factors in acquirers’ decision making.
Table 3. The Empirical Results of Determinants of a Target (A)China
(a) Domestic Acquisitions (b) Cross-border Acquisitions
Coefficient Z-Value Coefficient Z-Value SIZE ▲ 0.090 ** ▲ 2.380 SIZE 0.209 0.950
DER 0.014 1.560 DER 0.000 0.000
CASH 0.756 *** 3.130 CASH 9.318 *** 5.570
FIXED 0.049 *** 2.790 FIXED 0.071 1.510
MBR 0.060 1.220 MBR 0.777 *** 4.490
SECTOR_1 0.134 1.190 SECTOR_1 ▲ 0.882 ▲ 1.330
SECTOR_2 0.086 0.740 SECTOR_2 0.375 0.860
SECTOR_3 0.149 1.190 SECTOR_3 0.200 0.380
SECTOR_4 ▲ 0.117 ▲ 0.520 SECTOR_4 0.211 0.400
SECTOR_5 ▲ 0.471 ▲ 1.050 SECTOR_5 ▲ 5.340 ▲ 0.001
SECTOR_6 ▲ 0.041 ▲ 0.170 SECTOR_6 ▲ 6.091 ▲ 0.001
SECTOR_7 0.445 ** 2.230 SECTOR_7 0.320 0.380
Year_1 0.019 0.140 Year_1 0.249 0.440
Year_2 0.044 0.340 Year_2 ▲ 0.070 ▲ 0.120
Year_3 0.100 0.800 Year_3 ▲ 0.344 ▲ 0.600
Year_4 ▲ 6.096 ▲ 0.001 Year_4 0.264 0.48
Constant ▲ 1.800 *** ▲ 4.670 Constant ▲ 13.281 *** ▲ 5.390
Wald chi2 37.890 Wald chi2 53.850
rho 0.820 rho 0.220
Likelihood-Ratio Test of
rho=0 1.630 Likelihood-Ratio Test of
rho=0 1.580
Number of Firms 1,113 Number of Firms 1,113
Observations 3,650 Observations 3,650
(b) India
(a) Domestic Acquisitions (b) Cross-border Acquisitions
Coefficient Z-Value Coefficient Z-Value
SIZE ▲ 0.097 * ▲ 1.760 SIZE ▲ 0.094 ▲ 0.990 DER ▲ 0.133 * ▲ 1.950 DER ▲ 0.065 ▲ 0.620 CASH ▲ 0.420 ▲ 1.190 CASH 3.028 *** 3.570
FIXED 0.009 0.790 FIXED 0.000 0.010
MBR 0.023 0.660 MBR 0.211 *** 5.050
SECTOR_1 ▲ 0.042 ▲ 0.220 SECTOR_1 ▲ 0.111 ▲ 0.330
SECTOR_2 ▲ 0.541 ** ▲ 2.150 SECTOR_2 ▲ 0.795 ▲ 1.610
SECTOR_3 ▲ 0.475 * ▲ 1.870 SECTOR_3 ▲ 0.711 ▲ 1.510
SECTOR_4 0.993 ** 2.570 SECTOR_4 ▲ 5.782 ▲ 0.001
SECTOR_5 ▲ 0.359 ▲ 1.380 SECTOR_5 ▲ 0.433 ▲ 1.010
SECTOR_6 ▲ 0.454 ▲ 1.210 SECTOR_6 ▲ 5.916 ▲ 0.001
SECTOR_7 ▲ 6.017 ▲ 0.001 SECTOR_7 ▲ 5.974 ▲ 0.001
Year_1 0.844 *** 4.110 Year_1 0.852 ** 1.990
Year_2 ▲ 0.484 ▲ 1.670 Year_2 0.491 1.080
Year_3 ▲ 6.155 ▲ 0.001 Year_3 0.134 0.270
Year_4 ▲ 6.187 ▲ 0.001 Year_4 0.235 0.550
Constant ▲ 0.949 ** ▲ 2.010 Constant ▲ 4.228 *** ▲ 3.590
Wald chi2 32.090 Wald chi2 30.970
rho 0.018 rho 0.209
Likelihood-Ratio Test of
rho=0 0.010 Likelihood-Ratio Test of
rho=0 0.970
Number of Firms 695 Number of Firms 695
Observations 2,853 Observations 2,853
Note 1: This table represents the results of a panel probit that predicts which firms will be targeted in a given year. The empirical model employs 1 as a dependent variable when the firm is the target of an acquisition attempt and others are 0 in year t. The independent variable is the three-year averaged financial data. Therefore, the dependent variables are virtually the announced deals in 2001-2005. SIZE is the natural logarithm of total assets, DER is the total Liability divided by market valued capital, CASH is cash reserves divided by total assets, FIXED is fixed assets divided by total assets, ROA is return on assets,, MBRis book value of total liability plus market valued capital divided by book value of total assets.
Note 2: ***, ** and ` denotes significance at 1, 5 and 10 percent level, respectively
Note 3: In this estimation, seven categories of industrial dummy variables are added based on a definition of Bloomberg’s “Industrial Sector Level I”. The definition is different from that of table 2.
IV. What type of acquisitions increases shareholder’s value?
The purpose of this section is to verify the consequences resulting from the recent acquisitions in China and India. Focusing on shareholders’ gains from acquisitions, we examined if acquisitions contributed to an increase in shareholders‘ values in transition economies. We chose event study as a methodology to verify the above because we considered stock price as reflecting the future result of the acquisition. In other words, stock price right after the announcement reflects expected economic value added obtained by acquisitions. We followed a standard event study methodology to calculate abnormal returns originally developed by Brown and Warner (1985). We estimated the abnormal returns over three-day event window (-1, 1) around the announcement date using market model benchmark returns. We calculated abnormal returns and discussed the sources, causes and origins of the differences. The parameters for the market model are estimated over the (-256,-6) interval.
m i
i r r
AR = −
Here, ri is the return on firm i and rm is the value-weighted market index return. By using the above three-day cumulative abnormal returns, this paper investigates the following three hypotheses. The first hypothesis is that foreign acquirers, i.e., cross-border acquisitions, brought larger shareholders’ value than domestic acquirers. This hypothesis comes from the observation that foreign shareholders of the industrialized countries enhance monitoring of the corporate managers resulting in managerial discipline. Jensen (1986, 1988), Shleifer and Vishny (1986, 1998) emphasized the importance of shareholder’s monitoring citing as an
Lott (1996) examined returns from private acquisition targets. The former suggested that unlisted firms have less concentrated ownership structure. Although Fuller et al (2002) questioned the above conclusions, our analysis showed that in a transition economy, acquisition of private firms leads to effective monitoring regardless of ownership concentration. Hansen and Lott (1996) pointed out the same view, but from another hypothesis. Their contention is that acquisition of a private firm leads to maximization of shareholder’s portfolio, even though it did not maximize shareholder’s value. We assume that the latter is also plausible in case of cross-border acquisition, particularly in emerging markets where international inward portfolio investment has been recently increasing.
The third hypothesis is that vertical acquisition, i.e., industrial sectors of acquirer and target are close, improves productivity in the industry and brings higher shareholder’s value as a result. In the United States, Berger and Ofek (1995) reported that stock price of diversified firm is undervalued because investors regard that the firm misallocate the corporate resources and inefficiency exists inside. Morck et al.
(1990) and Bhagat et al. (2005) also reported that stock price of the firm is higher when the industrial sectors of acquirer and target are close. Although some literature such as Agrawal et al. (1992) and Sirower (1997) reported that stock price of the horizontal acquisition brought higher stock price in their empirical results, we assume vertical acquisition brings better efficiency in resource allocation between acquirer and target.
This section examines a sample using several criteria. The first criterion refers to deals between both listed and private targets and publicly listed acquirers announced from 1 January 1998 to 31 December 2005. Deals with more than 50%
announced acquisitions and completed as of May 31, 2007 are extracted from the sample. Banks, securities firms, insurance firms and other financial firms are excluded as an acquirer from the sample. Other deals that the same acquirer announced in five operating days are also excluded.
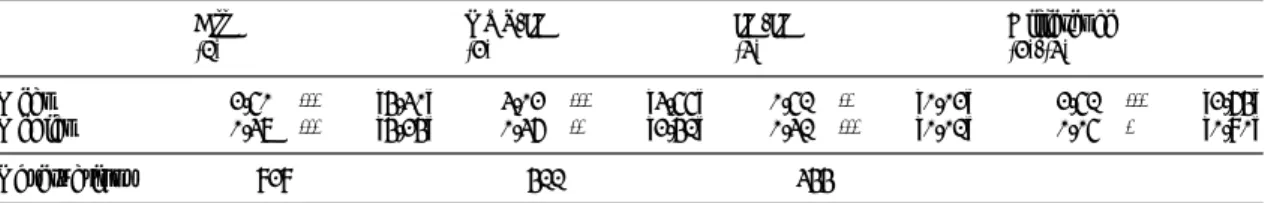
Table 4. shows the three-day cumulative abnormal returns classified by type of deals. In table 4.A., cumulative abnormal return of full sample is significantly positive in China. However, when we differentiate the returns on the basis of whether the acquirer is a foreign firm or Chinese firm, we find that the return is significantly positive for foreign acquirers. As for the cumulative abnormal returns on the basis of whether the target is a publicly listed firm or not, we find that the return is significantly higher when the target is unlisted firm. These results are common for both cross-border and domestic acquisitions in China. The cumulative abnormal return is also significantly high when the foreign acquirer and domestic target belong to the same industry. However, it is insignificant when the acquirer is a domestic firm.
To summarize, the above empirical results suggest that a foreign acquirer belonging to the same industrial group as an unlisted target provides the most significant positive additional shareholder’s value in China.
Table 4.B shows the empirical results of acquisitions in India. The results of the tests for all samples suggest that cumulative abnormal return of acquirer’s shareholder is significantly positive in India as a whole. The returns of both cross-border and domestic acquisitions are also significantly positive, but the cross-border acquisition is significantly higher than the domestic. In testing for the difference of cumulative abnormal returns between the listed and unlisted target, we find that the returns is significantly higher when the target is unlisted in case of cross-border acquisition. The result of the test is insignificant when acquirer is domestic firm. In India, empirical results suggest that the cumulative abnormal return of own-industry acquisition is significantly higher in case of cross-border acquisitions. When the acquirer is a domestic firm, the difference of the return between own industry and non-own industry acquisition is insignificant. The above results suggest that cross-border acquisition also brings more significant additional shareholder’s value in India and the returns are higher when the target is an unlisted firm and belongs to the same industrial group.
Table 4. Cumulative Abnormal Returns of Acquirers by Type of M&A
A. China
(a) Cumulative Abnormal Returns of Acquirers of Cross-border and Domestic M&A
Mean 2.50%*** [4.30] 3.02%*** [3.55] 0.51%** [0.02] 2.51%*** [2.64]
Median 0.37%*** [4.24] 0.36%** [2.41] 0.31%*** [0.01] 0.05%* [0.80]
Observations 828 411 344
(1) (2) (3) (2)-(3)
All OUT-IN IN-IN Difference
(b) Cumulative Abnormal Returns of Acquirers by Type of Targets
All Piblic Private Difference
OUT-IN Mean 3.91%*** [4.01] 1.85%* [1.58] 5.07%*** [3.69] -3.22%* [1.59]
Median 0.43%*** [3.47] 2.13% [1.11] 0.47%*** [3.51] 1.66% [0.23]
Observations 485 310 175
(1) (2) (3) (2)-(3)
All Own-Industry Non-Own Industry
OUT-IN Mean 3.91%*** [4.01] 5.39%** [1.79] 3.50%*** [3.77] 1.89%*** [2.44]
Median 0.43%*** [3.47] 0.75%* [1.75] 0.38%*** [2.97] 0.37% [0.43]
Observations 485 380 105
IN-IN Mean 0.20%*** [2.50] 4.12% [1.24] 1.61%** [2.33] 2.51% [1.22]
Median 0.44%*** [3.76] 0.60% [1.64] 0.40%*** [3.40] 0.20% [0.15]
Observations 416 73 343
(1) (2) (3) (2)-(3)
Note 1: Cumulative abnormal returns for acquirers are calculated for the three days (-1, 1) around the announcement of a takeover. Abnormal returns are estimated using a below model:
m i
i r r
AR = −
The parameters for the market model are estimated over the (-256,-6) interval. Here, ri is the return on firm i and rm is the value-weighted market index return. All acquirers are publicly traded listed on the domestic/foreign stock exchange.
Note 2: *** denotes significance at 1 percent level, ** denotes significance at 5 percent level and ***denotes significance at 10 percent level
B. India
(a) Cumulative Abnormal Returns of Acquirers of Cross-border and Domestic M&A
Mean 1.18%*** [2.88] 1.94%** [2.05] 0.93%*** [2.89] 1.02%*** [2.88]
Median 0.15%* [1.70] 0.36%* [1.69] 0.08%** [2.13] 0.28%*** [0.99]
Observations 489 220 349
All OUT-IN IN-IN Difference
(1) (2) (3) (2)-(3)
(b) Cumulative Abnormal Returns of Acquirers by Type of Targets
All Piblic Private Difference
OUT-IN Mean 0.64%* [1.58] 0.94%** [2.05] 1.16% [0.31] -0.22%** [-2.23]
Median 0.36%** [2.09] 0.34%* [1.69] 0.36% [1.41] -0.02%*** [-0.91]
Observations 306 220 158
IN-IN Mean 1.18%*** [2.88] 1.02%* [1.59] 1.40%*** [3.59] -0.38% [-0.46]
Median 0.08%* [1.70] 0.08% [0.33] 0.11%*** [2.22] -0.03% [-0.62]
Observations 489 287 202
(1) (2) (3) (2)-(3)
(c) Cumulative Abnormal Returns of Acquirers by Type of Industrial Sector
All Own-Industry Non-Own Industry
OUT-IN Mean 0.64%* [1.58] 1.13% [0.15] 0.94%** [2.05] 0.18%** [2.05]
Median 0.36%* [2.09] 0.96% [1.15] 0.18%* [1.69] 0.78%* [1.69]
Observations 489 86 403
IN-IN Mean 0.12%*** [2.88] 1.80%* [1.52] 0.93%*** [2.89] 0.87% [0.96]
Median 0.08%* [1.70] -0.26% [-0.33] 0.16%** [2.13] -0.42% [-0.62]
Observations 489 140 349
(1) (2) (3) (2)-(3)
Note 1: Cumulative abnormal returns for acquirers are calculated for the three days (-1, 1) around the announcement of a takeover. Abnormal returns are estimated using a below model:
m i
i r r
AR = −
The parameters for the market model are estimated over the (-256,-6) interval. Here, ri is the return on firm i and rm is the value-weighted market index return. All acquirers are publicly traded listed on the domestic/foreign stock exchange.
Note 2: Each industrial sector of the sample deal is defined based on Table 2.
Note 3: *** denotes significance at 1 percent level, ** denotes significance at 5 percent level and ***denotes significance at 10 percent level.
V. What types of acquirers contribute to a good acquisition?
The third empirical analysis focuses on types of acquirers that bring high cumulative abnormal returns. The four datasets are prepared to examine this, i.e., two datasets for domestic acquisitions and the two others for cross-border acquisitions in China and India, respectively. The sample period covers 2000 to 2005. We matched financial data of acquirers to the CARs estimated in the previous section. The criterion used to extract sample data of the acquisition is the same as in sections III and IV.
Existing literature on this issue is also ample. Moeller et al. (2004) , Dong et al.
(2002) and Malmendier and Tate (2002) pointed out that acquirer’s firm size is important in determining shareholders’ return based on their research on U.S.
acquisitions. The above literature mentioned various reasons, but we do not share their view on overpayment by large firms. But we do agree that a small acquirer obtains relatively larger synergy effect than large firms and uses the same hypothesis it in this paper.
Lang et al. (1989) pointed out that acquirers with high market to book ratio resulted in high cumulative abnormal returns in eleven days after the announcement.
This is because the acquirer with high market to book ratio is regarded to bring better efficiency in management for the target. Servaes (1991) supported the above view and the study suggests that the target has a room for efficiency improvement from an acquirer with high market to book ratio. Although Rau and Vermaelen (1998)
is an unlisted firm. We also thought this reflected shareholder’s value in a market.
i i
i i
i i
i i i
i
OWN
PUBLIC GROWTH
ROA FIXED
CASH MBR
SIZE const
Z
ι χ
χ χ
χ χ
χ χ
χ + +
+ +
+ +
+ +
+
=
7
6 5
5 4
3 2
1 1
1 (1.1)
i i
i i
i i
i i i
i
OWN
PUBLIC GROWTH
ROA FIXED
CASH MBR
SIZE const
Z
ι δ
δ δ
δ δ
δ δ
δ + +
+ +
+ +
+ +
+
=
7
6 5
5 4
3 2
2 1 2
(1.2)
Z1: Cumulative Abnormal Return of Domestic Acquirer, Z2: Cumulative Abnormal Return of Foreign Acquirer, SIZE1: Logarithm of Total Assets in terms of local currency, SIZE2: Logarithm of Total Assets in terms of US dollar, MBR: Book Value of Total Liability plus Market Value of Capital divided by Total Assets, CASH: Cash Reserve divided by Total Assets, FIXED: Fixed Assts divided by Total Assets, ROA:
Return on Asset, GROWTH: Growth Rate of Sales, PUBLIC: Dummy variable with a value of 1 if the targets are listed, or 0 otherwise, OWN: A Dummy Variable with a value of 1 if the Targets are in same industrial group, or 0 otherwise.
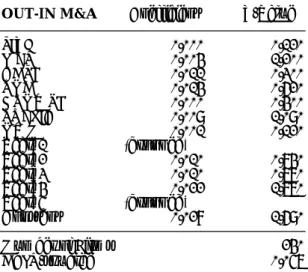
Our empirical results suggest that parameters of MBR, CASH and GROWTH are significant in case of acquisitions by domestic acquirer in China. Here, the sign of the parameters MBR and GROWTH are positive, that of CASH is negative. This means that cumulative abnormal return is statistically high when acquirer is a domestic firm with high MBR and GROWTH. On the other hand, these parameters are insignificant when acquirer is foreigner and does not contribute to an increase in the shareholder’s value. In India, the shareholder’s value increases when the acquirer is domestic, the target is unlisted and the two belong to one industrial group. For Indian firms, cumulative abnormal return is high when the acquirer is a domestic, the target is unlisted and these two belong to a close industrial group. However, only the parameter of ROA is significantly positive and all the others are insignificant.
Table 5. The Empirical Results of Determinants of CAR by Type of Merger (a)China
IN-IN M&A Coefficient Z-Value OUT-IN M&A Coefficient Z-Value
SIZE 0.007 * 1.620 SIZE ▲ 0.000 ▲ 0.120
MBR 0.009 *** 2.720 MBR ▲ 0.004 ▲ 1.200
CASH ▲ 0.063 ** ▲ 2.310 CASH 0.011 0.300
ROA 0.063 1.060 ROA 0.014 0.620
GROWTH 0.002 *** 5.860 GROWTH ▲ 0.000 ▲ 0.400
PUBLIC ▲ 0.001 ▲ 0.140 PUBLIC 0.009 1.090
OWN ▲ 0.006 ▲ 0.820 OWN 0.001 0.120
Year_1 (dropped) Year_1 (dropped)
Year_2 0.005 0.330 Year_2 ▲ 0.010 ▲ 0.840
Year_3 0.024 1.640 Year_3 ▲ 0.010 ▲ 0.780
Year_4 0.015 1.060 Year_4 ▲ 0.022 ▲ 1.770
Year_5 (dropped) Year_5 (dropped)
Constant ▲ 0.059 * ▲ 1.770 Constant 0.028 1.690
Number of Firms 206 Number of Firms
Adj R-squared 0.169 Adj R-squared 240
0.057
Note 1: Ordinary least squares regression of the acquirer’s three day cumulative abnormal return on the on the following variables. SIZE1 and SIZE2 are the logarithm of total assets in terms of local currency and US dollar, respectively. MBR is book value of total liability plus market value of capital divided by total assets. CASH is cash reserve divided by total assets. FIXED is fixed assets divided by total assets. ROA is return on asset. GROWTH is growth rate of sales. PUBLIC is the dummy variable with a value of 1 if the targets are listed, or 0 otherwise and OWN is dummy variable with a value of 1 if the targets are in same industrial group or 0 otherwise.
Note 2: Each industrial sector of the sample deal is defined based on Table 2.
Note 3: *** denotes significance at 1 percent level, ** denotes significance at 5 percent level and ***denotes significance at 10 percent level.
(b)India
IN-IN M&A Coefficient Z-Value OUT-IN M&A Coefficient Z-Value
SIZE 0.000 0.000 SIZE 0.002 0.640
MBR 0.001 1.210 MBR 0.003 0.760
CASH ▲ 0.003 ▲ 0.010 CASH ▲ 0.011 ▲ 0.200 ROA ▲ 0.066 ▲ 0.780 ROA 0.114 * 2.050
GROWTH ▲ 0.009 ▲ 0.540 GROWTH ▲ 0.024 ▲ 1.190
PUBLIC ▲ 0.023 ** ▲ 2.240 PUBLIC 0.007 0.620
OWN 0.020 * 1.780 OWN 0.002 0.150
Year_1 (dropped) Year_1 (dropped)
Year_2 ▲ 0.020 ▲ 1.350 Year_2 ▲ 0.018 ▲ 0.930
Year_3 ▲ 0.004 ▲ 0.250 Year_3 0.002 0.100
Year_4 ▲ 0.022 ▲ 1.260 Year_4 ▲ 0.007 ▲ 0.440
Year_5 0.001 0.090 Year_5 ▲ 0.002 ▲ 0.150
Constant 0.046 * 1.830 Constant ▲ 0.012 ▲ 0.410
Number of Firms 163 Number of Firms
Adj R-squared 0.007 Adj R-squared 99
0.069 Note 1: Ordinary least squares regression of the acquirer’s three day cumulative abnormal return on the on the following variables. SIZE1 and SIZE2 are the logarithm of total assets in terms of local currency and US dollar, respectively. MBR is book value of total liability plus market value of capital divided by total assets. CASH is cash reserve divided by total assets. FIXED is fixed assets divided by total assets. ROA is return on asset. GROWTH is growth rate of sales. PUBLIC is the dummy variable with a value of 1 if the targets are listed, or 0 otherwise and OWN is dummy variable with a value of 1 if the targets are in same industrial group or 0 otherwise.
Note 2: *** denotes significance at 1 percent level, ** denotes significance at 5 percent level and ***denotes significance at 10 percent level
VI. Discussion
growth opportunity.
We used cash reserves to total assets as a proxy of firm’s internal fund in our first empirical study. This variable implies that when the ratio is high, the target has a room to improve productivity by acquisition. As confirmed in several literatures, this variable significantly influences an acquirer’s decision. We found this empirical result more remarkable in China and India because both countries experienced approximately ten percent economic growth and state-owned firms also recorded high growth rate of their profits in recent years. Under the process of market oriented economic reforms, we found large number of firms are with ample internal funds and have rooms for reforms. Therefore, the government’s recent pronouncement promoting acquisition is most likely to contribute to an improvement in the economic efficiency. Our empirical results also suggest that not only foreign investors, but domestic investors as well contributed to the improvement in cost efficiency in the industrial organization of China and India.
The second empirical analysis also supports the government’s recent promotion of incoming investment policy. Contrary to acquisitions in the industrialized countries, there are still plenty of restrictions in purchasing and holding private equity in China and India. In addition, in both countries, government still holds majority of publicly listed shares. This study suggests that future deregulation of private equity transaction by foreigners will contribute to an improvement in industrial efficiency and enlarge the shareholder’s value. On the other hand, the results also suggest that it would be difficult to improve the productivity of listed firms as long as governments remain the largest shareholders.
The third empirical analysis suggests that for China, domestic firms with high growth opportunity are good acquirers. This result has several implications. An acquisition by a firm with high growth opportunity implies that management of the targeted firm is influenced by managers of acquirers. Since an acquiring firm with high growth opportunity has better cost efficiency than the target, the acquisition can also contribute to an improvement of inefficient in China.
In the late 1990s, the dramatic increase in short-term investment in emerging countries triggered the financial crisis. Based on an analysis of the firm’s micro deal data, however, our study reveals that the recent dramatic increase in acquisitions in transition economies does not worsen economic welfare .
VII. Concluding Remarks
Focusing on China and India, this paper examined the causes and consequences of acquisitions in a transition economy. We found evidence that cash- rich inefficient firms are targeted more frequently as similarly observed in the industrialized countries. Our analysis also showed that cross-border and other types
of acquisition contributed to an increase in shareholder’s value. Based on the assumption that an increase in shareholder’s value soon after the deal announcement reflects future overall corporate value, our results confirmed that the recent increase in acquisition contributed to an improvement in economic efficiency as the two countries pursue market oriented economic reforms.
This paper also verified the determinants of acquisitions and its effects on shareholder’s value in a transition economy. Although our empirical analysis focused only on China and India, our findings have important implications on the other emerging countries in transition around the world. Future study needs to examine if countries with high growth rate, large amount of natural resources and energy exhibit similar characteristics as we found in our study of China and India. These studies must reflect how future inward investment promotional policy by acquisitions could increase efficiency.
References:
Agrawal, A., J. F. Jaffe, and G. N. Mandelker (1992), “The post-merger performance of acquiring firms: A re-examination of an anomaly,” Journal of Finance 47 (4), pp.1605-1621.
Andrade, G. and E. Stafford (1999) , “Investigating the economic role of mergers,”
Harvard University working paper.
Andrade, G., M. Mitchell, and E. Stafford (2001) , “New evidence and perspectives on mergers,” Journal of Economic Perspectives 15(2), pp.103-120.
Berger, P. G. and E. Ofek (1995), “Diversification’s effect on firm value,” Journal of Financial Economics 37 (1), pp.39-65.
Bhagat, S., M. Dong, D. Hirshleifer, and R. Noah (2005), “Do tender offers create value? New methods and evidence,” Journal of Financial Economics 76 (1), pp.61-98.
Bradley, M., A. Desai, and E. H. Kim (1988) , “Synergistic gain from corporate acquisitions and their division between the stockholders of target and acquiring firms,” Journal of Financial Economics 21(1) , pp.61-98.