Wideband low‑noise optical beam deflection sensor with photothermal excitation for liquid‑environment atomic force microscopy
著者 Fukuma Takeshi
journal or
publication title
Review of Scientific Instruments
volume 80
number 2
page range 023707
year 2009‑01‑01
URL http://hdl.handle.net/2297/27192
doi: 10.1063/1.3086418
Wideband low-noise optical beam deflection sensor with photothermal excitation for liquid-environment atomic force microscopy
Takeshi Fukuma1,2,a兲
1Frontier Science Organization, Kanazawa University, Kakuma-machi, 920-1192 Kanazawa, Japan
2PRESTO, Japan Science and Technology Agency, Honcho 4-1-9, Kawaguchi, Japan
共Received 7 October 2008; accepted 1 February 2009; published online 24 February 2009兲 I developed a wideband low-noise optical beam deflection sensor with a photothermal cantilever excitation system for liquid-environment atomic force microscopy. The developed sensor has a 10 MHz bandwidth and 4.7 fm/冑Hz deflection noise density in water. The theoretically limited noise performance共i.e., the noise level limited only by the photodiode shot noise兲has been achieved in liquid for the first time. Owing to the wide bandwidth and the replaceable focus lens design, the sensor is applicable to cantilevers with various dimensions. The deflection noise densities of less than 7.8 fm/冑Hz have been achieved in water for cantilevers with lengths from 35 to 125 m. The ideal amplitude and phase versus frequency curves without distortion are obtained with the developed photothermal excitation system. The excitation system is applicable to relatively stiff cantilevers 共⬎20 N/m兲 in liquid, making it possible to obtain true atomic-resolution images in liquid. True atomic-resolution imaging of mica in water is demonstrated using the developed deflection sensor and the photothermal excitation system. © 2009 American Institute of Physics.
关DOI:10.1063/1.3086418兴
I. INTRODUCTION
The cantilever deflection sensor is one of the most im- portant elements of the atomic force microscope 共AFM兲.1 The bandwidth of the sensor determines the frequency range of the cantilever resonance共f0兲available in the AFM experi- ments. The noise from the deflection sensor can limit the force sensitivity in AFM imaging and spectroscopy. The noise performance can also influence the stability of the cantilever self-oscillation in frequency modulation AFM 共FM-AFM兲.2
Among the methods proposed for detecting cantilever deflection,1,3–9 the optical beam deflection 共OBD兲 method5 has been the most widely used owing to the simple experi- mental setup and easy optical beam alignment. Until re- cently, however, the noise performance of the OBD sensors has been inferior to that of the interferometers. The power spectral density 共PSD兲 of the deflection noise arising from the deflection sensor共nzs兲was typically 100– 1000 fm/冑Hz for an OBD sensor,10 while that for an interferometer was typically 10– 100 fm/冑Hz.
The situation was dramatically changed in 2005. The OBD sensor withnzs of 17 fm/冑Hz in air and 40 fm/冑Hz in water was developed by introducing the radio-frequency 共rf兲laser power modulation technique and refining the opti- cal design.11The reduction ofnzsenabled the oscillation of a stiff cantilever 共k⬎20 N/m兲 with small oscillation ampli- tude 共A⬍0.5 nm兲 and thereby true atomic resolution FM- AFM in liquid.12 These results highlighted the grave impact ofnzson AFM performance.
In 2006, an OBD sensor with improved nzs values of
5.7 fm/冑Hz in air and 7.3 fm/冑Hz in water was developed using a small diameter laser beam source and replaceable objective lenses.13Combined with a liquid-environment FM- AFM, the OBD sensor made it possible to visualize hydra- tion layers14 and mobile ions15 at the interface between a model biological membrane and physiological solution with Ångstrom resolution. The biomolecular assemblies, amyloid fibrils, are also imaged in liquid, showing the arrangements of individual -strands at Ångstrom resolution.16 These re- sults demonstrated the applicability of low-noise FM-AFM to molecular-scale investigations of biological systems.
After those previous works, the present study is aimed at resolving the remaining design issues. First, thenzsvalue of the OBD sensor should ultimately be limited by the photo- diode shot noise.11 However, the OBD sensors reported so far have not reached the shot-noise-limited performance in liquid,13although it has been possible in air.11,13Second, the low-noise共i.e.,nzs⬍50 fm/冑Hz in liquid兲OBD sensors re- ported so far have the detection bandwidth共B兲of less than 1 MHz.11 This is not necessarily high enough to use the smallest cantilevers available today. Finally, in the liquid- environment FM-AFM using the low-noise OBD sensors re- ported so far, a piezoactuator has been used for cantilever excitation.11Thus, the amplitude and phase responses to can- tilever excitation have been heavily distorted, which has of- ten prevented the stable self-oscillation and quantitative force measurements in FM-AFM.
In this study, I developed a wideband low-noise OBD sensor with a photothermal cantilever excitation system.
The developed OBD sensor has a 10 MHz bandwidth and 4.7 fm/冑Hz deflection PSD in water, demonstrating the shot-noise-limited performance in liquid for the first time.
Clean amplitude and phase versus frequency curves without
a兲Electronic mail: [email protected].
共 兲
0034-6748/2009/80共2兲/023707/8/$25.00 80, 023707-1 © 2009 American Institute of Physics
distortion have been obtained with photothermal excitation.
The wide bandwidth and the replaceable objective lenses al- low the detection of the deflection of the small cantilevers 共length of ᐉc= 35 m兲 with the nzs value of 5.5 fm/冑Hz.
True atomic-resolution FM-AFM images of mica in liquid have been obtained with the developed deflection sensor using photothermal excitation.
II. BASIC PRINCIPLE AND SETUP
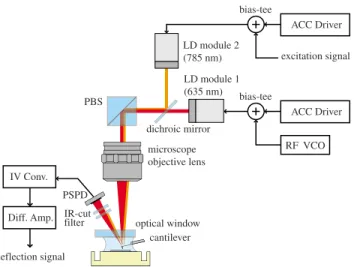
Figure 1 shows the overall experimental setup for the developed OBD sensor with the photothermal cantilever ex- citation system. In the OBD method, a focused laser beam is irradiated onto the back of the cantilever. The reflected laser beam is detected with a position-sensitive photodetector 共PSPD兲, which is typically a four-divided silicon photodiode array. The photoinduced current at each element is converted to a voltage signal by the current-to-voltage converter 共IV Conv.兲. The converted voltage signals are fed into a differ- ential amplifier共Diff. Amp.兲, which outputs a signal propor- tional to the difference between the input signals.
As the cantilever deflects, the laser spot on the PSPD is displaced. This gives rise to the difference between the photoinduced currents at the photodiode elements. Therefore, the output from the Diff. Amp. changes in proportion to the cantilever deflection and is referred to as the “deflection signal.”
III. WIDEBAND PHOTODETECTOR
The use of higher resonance frequency gives a faster time response and a better sensitivity in dynamic force microscopy.2,3 The use of torsional resonances17 and higher flexural modes18have been explored for visualizing various surface properties other than topography. The higher flexural modes are also used for oscillating a cantilever with very small amplitude.19The higher harmonics of the fundamental resonance have been investigated in order to understand the nonlinear cantilever dynamics20 and enhance the spatial resolution.21,22 These examples of recent research illustrate the growing demand for wideband cantilever deflection sensors.
However, enhancing the bandwidth without compromis- ing the noise performance has been a great challenge. In fact, the bandwidth of the previously reported low-noise OBD sensors has been limited to less than 1 MHz.11In this study, I developed a low-noise OBD sensor with a bandwidth of 10 MHz without deteriorating the noise performance. The detection bandwidth of the OBD sensor is determined by the bandwidth of theIVConv. and the Diff. Amp. In this section, the detailed design and performance of these two compo- nents are described.
A. IV converter
Figure2共a兲shows the equivalent circuit of theIV Conv.
connected to the photodiode. The IV Conv. consists of the feedback resistorRIV and capacitor CF, and the operational amplifier共OPAMP兲. The⫺3 dB bandwidth of the IV Conv.
共BIV兲is given by BIV=
冑
2GBPRIVCS, 共1兲
where GBP is the gain bandwidth product 共GBP兲 of the OPAMP and CS is the source capacitance, that is, the total capacitance to the ground on the inverting input of the OPAMP. The capacitance is the sum of the common-mode and differential-mode input capacitances共CCMandCDIFF, re- spectively兲, the photodiode capacitance 共CPD兲 and the para- sitic capacitance of the circuit pattern and the wiring 共CWIRE兲,
CS=CCM+CDIFF+CPD+CWIRE. 共2兲 Equations共1兲and共2兲show that an OPAMP with higher GBP is desirable for obtaining wider bandwidth. However, such a high-speed OPAMP tends to dissipate large power, leading to a temperature drift of the PSPD and its supporting mechanics. It is desirable to place theIVConv. far from the PSPD to ensure thermal stability, while the wire connecting the PSPD and theIVConv. should be minimized for a small CWIRE.
One of the effective ways of reducing the power con- sumption is to use a power supply voltage as low as possible.
Thus, a high-speed OPAMP that can be operated with a low supply voltage is desirable. In the developed OBD sensor, OPA4354共Texas Instruments兲was used with a power supply
LD module 1 (635 nm) LD module 2 (785 nm)
optical window cantilever deflection signal
PBS
PSPD IR-cut filter
microscope objective lens dichroic mirror
ACC Driver
RF VCO bias-tee
ACC Driver bias-tee
excitation signal
IV Conv.
Diff. Amp.
FIG. 1.共Color online兲Schematic of the experimental setup for the devel- oped OBD sensor with the photothermal cantilever excitation system.
10k 100k 1M 10M
Frequency [Hz]
NormalizedGain[dB]
(b) (a)
0 5
-5 -10 -15 Vr
VIV
RIV
CF
CDIFF
CPD
CCM
CWIRE
FIG. 2.共Color online兲 共a兲Equivalent circuit of theIVConv. connected to the photodiode.共b兲Frequency response of the normalized gain of theIV Conv.共Vr= 15 V兲.
023707-2 Takeshi Fukuma Rev. Sci. Instrum.80, 023707共2009兲
voltage of⫾2.5 V. The OPAMP typically has a GBP of 100 MHz. The output voltage of the IV Conv. 共VIV兲 measured with a static cantilever is given by13
VIV=RIV␣ P0
NPD, 共3兲
where␣,,P0, andNPDare laser power attenuation factor in the optical path from the focus lens to the PSPD, the effi- ciency of photocurrent conversion at the PSPD, the laser power measured underneath the focus lens, and the number of photodiode elements in the PSPD, respectively. In the present design, RIV= 10 k⍀,= 0.43, P0= 2 mW, and NPD
= 4.␣is 0.8 for a gold-coated cantilever and less than that for other cantilevers. From Eq.共3兲,VIVis less than 1.72 V. The output swing of OPA4354 is⫾2 V when the power supply voltage is ⫾2.5 V. This low power consumption of the OPAMP allows us to place it close to the PSPD without deteriorating the thermal stability.
Equations共1兲and共2兲show that a PSPD with smallCPD is desirable for a wideBIV.CPDdepends on the reverse bias voltage Vr as well as on the material and structure of the photodiode. The application ofVrresults in an expansion of the depletion layer in the photodiode and hence a reduction inCPD.
In the developed OBD sensor, a four-divided Si p-i-n photodiode array 共S6695–01: Hamamatsu Photonics兲 was used as the PSPD. Thep-i-n structure of the diode and the small detection area共2⫻2 mm2兲provide a smallCPD: 3 pF atVr= 15 V. OPA4354 typically hasCCM= 2 pF and CDIFF
= 2 pF. The other parasitic capacitance,CWIRE, is estimated to be approximately 8 pF in the present design. From Eq.共2兲, the total source capacitanceCSis 15 pF.BIVcalculated using Eq. 共1兲 with the parameters mentioned above is 10.6 MHz.
Figure2共b兲shows the frequency response of the normalized gain of theIV Conv. developed in this study.BIV, estimated from the profile is 10 MHz, which shows good agreement with the calculated value.
The feedback capacitanceCF is necessary for suppress- ing the gain peak in the frequency response of theIV Conv.
For the maximally flat second-order Butterworth frequency response,CF should be set to
CF=
冑
RIVCGBPS . 共4兲 On the basis of Eq. 共4兲 and the parameters described above, CF should be set to 2.2 pF in the developed OBD sensor. In the actualIV Conv.,CF was set to 2.0 pF, taking the stray capacitance into account. The profile in Fig. 2共b兲 shows a small peak at around 8 MHz. This is because either the actual CS is larger than 15 pF or CF is smaller than 2.2 pF.B. Differential amplifier
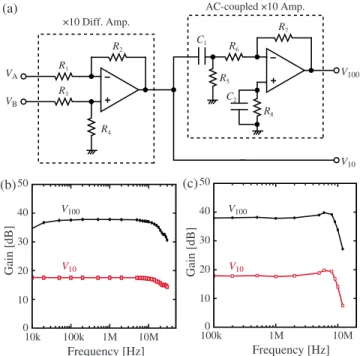
Figure3共a兲shows the simplified circuit of the developed Diff. Amp. Note that the input, output, and summing stages, and the power supply lines with the decoupling capacitors are omitted. The current signals from the four photodiode elements are converted to the voltage signals at theIVConv.
The four voltage signals output from the IV Conv. are fed into the Diff. Amp. At the input stage of the Diff. Amp., the voltage signals from the upper and lower two elements are respectively summed to generate two voltage signals共VAand VB兲. These two signals are input to the⫻10 Diff. Amp. stage which outputs the difference between VA and VB 共V10兲.
WhileV10is output from the Diff. Amp. as the ⫻10 deflec- tion signal, it is also routed to the ac-coupled ⫻10 Amp.
stage to produce the⫻100 deflection signal共V100兲.
The deflection sensitivitySzof the OBD sensor is given by13
Sz= 6␣nmRIVAdiffP0ᐉf
a0ᐉc
. 共5兲
is the correction factor for the Gaussian laser beam,nmis the refraction index for the medium of the operating environ- ment,Adiffis the gain of the Diff. Amp.,ᐉfis the focal length of the focus lens, and ᐉc is the cantilever length. In the present design,Adiff is 17.5 dB共⫻7.5兲for V10 and 37.5 dB 共⫻75兲 for V100 because of the ⫺2.5 dB gain of the input stage. The values for the other parameters are = 1.13, ᐉf
= 40 mm, a0= 1.1 mm, and ᐉc= 125 m. In air 共nm= 1.0兲, V10 is mainly used and Sz for V10 is 102 mV/nm. In liquid 共nm= 1.33 for water兲, V100is mainly used and Szfor V100is 1.35 V/nm.
The cantilever oscillation amplitude 共A兲 is typically 1–20 nm in air while that in liquid is 0.1–2 nm. The large amplitude in air is necessary for preventing the tip adhesion caused by the large electrostatic and van der Waals forces.
These long-range attractive forces are greatly reduced in liq- uid, making it possible to oscillate the cantilever with small amplitude. The small-amplitude operation is proven to be
50 40 30 20 10 0
Gain[dB]
100k 1M 10M
Frequency [Hz]
50 40 30 20 10 0
Gain[dB]
10k 100k 1M 10M Frequency [Hz]
(b) (c) (a)
R2
R1
R3
R4
C1
V100
V100 VA
VB
R7
R6
R5
R8
V10
V10 V100
V10
C2
×10 Diff. Amp.
AC-coupled ×10 Amp.
FIG. 3. 共Color online兲 共a兲Simplified circuit of the Diff. Amp. The input, output, and summing stages, and the power supply lines with the decoupling capacitors are omitted.共b兲Frequency response of the gain of the Diff. Amp.
共c兲 Frequency response of the gain of the Diff. Amp. multiplied by the normalized gain of theIVConv. shown in Fig.2共b兲.
effective for enhancing the sensitivity to the short-range in- teraction force,23 thereby obtaining high spatial resolution.24 For a reasonable immunity to the electronic circuit noise, the amplitude of the deflection signal should be larger than 100 mV, while the amplitude should be kept lower than a few volts to avoid the harmonic distortions caused by the insuf- ficient slew rate of the OPAMP at high frequencies. Thus, it is very difficult to cover the amplitude range from 0.1 to 20 nm with a single deflection output. In the present design, two deflection outputs with different gains are used;V10and V100.V10output is mainly used for applications in air in both dynamic and static modes while the ac-coupledV100output is mainly used for applications in liquid only in the dynamic mode.
The⫻10 Diff. Amp. stage typically consists of four re- sistors and an OPAMP. The circuit can be implemented by a single-chip instrumentation amplifier with integrated resis- tors. This eliminates the need for precise matching of the four resistor values for a high common-mode rejection ratio 共CMRR兲. The high CMRR is important for suppressing the common-mode noise arising from the laser power fluctua- tion. However, commercially available low-noise instrumen- tation amplifiers are not fast enough to constitute the⫻10 Diff. Amp. with a bandwidth higher than 10 MHz. Thus, in this study, a high-speed OPAMP, OPA820 共Texas Instru- ments兲, and four well-matched external resistors are used to construct the Diff. Amp. stage.
The Diff. Amp. should have a wide bandwidth as well as a high dc stability for operating the AFM in both dynamic and static modes. Low input voltage noise in the frequency range from dc to a few tens of megahertz is required. Al- though current feedback OPAMPs are faster than those with voltage feedback, they generally have large input current noise and bias offset current. Reducing the resistor values could partially compensate such effects but increase the power consumption and hence deteriorate thermal stability.
Moreover, a high-speed OPAMP generally dissipates large power, which can deteriorate the dc stability of the circuit.
OPA820 is a voltage feedback amplifier having a high dc precision and stability. The GBP of OPA820 is typically 280 MHz, which is high enough for obtaining a bandwidth over 10 MHz. The input voltage noise density is less than 2.5 nV/冑Hz for a frequency higher than 100 kHz and less than 15 nV/冑Hz even at 10 Hz. The OPAMP is operated with a ⫾5 V power supply voltage, giving a ⫾4 V output swing. From the Sz values described above, the amplitude ranges in air and water corresponding to 0.1–4 V are V10
= 1 – 40 nm and V100= 0.074– 3 nm, respectively. These ranges cover the typical amplitude ranges used in air and liquid.
Figure3共b兲shows the frequency response of the gain of the developed Diff. Amp. The profiles show the⫺3 dB band- width of the Diff. Amp. 共BDIFF兲 is 30 MHz for V10 and 20 MHz for V100. The decrease in the V100 gain in the low- frequency range reflects the influence of ac coupling with an 8 kHz cutoff frequency. The frequency response of the total gain of the preamplifier 共i.e., IV Conv. and Diff. Amp.兲 is plotted in Fig.3共c兲. The profiles show that the⫺3 dB band-
width of the deflection sensor is about 10 MHz for both outputs.
IV. SHOT-NOISE-LIMITED NOISE PERFORMANCE The noise performance of the OBD sensor is ultimately limited by the photodiode shot noise. The deflection PSD arising from the photodiode shot noise共nzp兲is given by13
nzp= a0ᐉc
6nmᐉf
冑
␣2eP0. 共6兲However, the noise performance of the actual OBD sensor is often limited by other noise sources such as laser mode hop- ping and interference, Johnson noise atRIV, and other elec- tronics noise. Thus, the reduction in such noise to attain the shot-noise-limited noise performance is essential for devel- oping the low-noise OBD sensor.
In previous reports,11,13 the shot-noise-limited noise per- formance was obtained only in air, while the performance in liquid has been limited by other factors. In this section, what limits the noise performance in liquid is described and a way of achieving the shot-noise-limited performance even in liq- uid is presented.
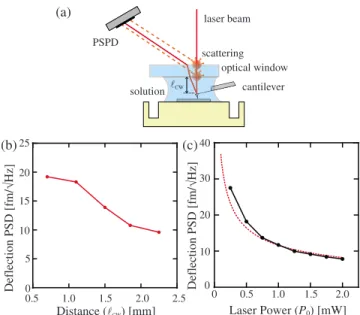
A. Optical window
The major difference between the OBD sensors in air and that in liquid is the existence of the air/glass and glass/
liquid interfaces in the optical path of the laser beam, as shown in Fig.4共a兲. The reflection and scattering at the inter- faces can lead to a large increase in deflection noise. Some of the reflected laser beam returns to the laser diode and induces laser mode hopping, which is referred to as optical feedback noise. Some of the scattered laser beam is directed to the PSPD and interferes with the laser beam reflected at the back of the cantilever. This also increases the deflection noise and is referred to as optical interference noise.
optical window laser beam
scattering
cantilever solution
PSPD
(a)
(b) (c)
lCW
DeflectionPSD[fm/√Hz]
0 0.5 1.0
Distance (lcw) [mm]
1.5 2.0 2.5
5 10 15 20 25
Laser Power (P0) [mW]
DeflectionPSD[fm/√Hz]
00 10 20 30 40
0.5 1.0 1.5 2.0
FIG. 4. 共Color online兲 共a兲Schematic of the OBD sensor showing the laser beam interference at the PSPD surface caused by scattering at the air/glass and glass/liquid interfaces.共b兲 ᐉcwdependence ofnzs. 共c兲P0dependence ofnzs.
023707-4 Takeshi Fukuma Rev. Sci. Instrum.80, 023707共2009兲
In the previous report,11the laser power modulation with a rf signal共300–500 MHz兲was employed to reduce the op- tical noise. The rf modulation changes the laser oscillation mode from single mode to multimode. Since mode hopping originates from the competition between the possible laser oscillation modes, the multimode laser inherently has less mode hopping than the single-mode laser. Therefore, the op- tical feedback noise is greatly reduced. Moreover, the multi- mode laser has a shorter coherence length共ᐉch兲and, hence, the interference at the PSPD surface is also reduced by rf modulation.
Although rf modulation is effective, it cannot completely eliminate optical noise. Thus, it is important to prevent that the laser beam partially returns to the laser diode or is di- rected to the PSPD. In the present design, I introduced the antireflection 共AR兲-coated optical window for reducing the laser reflection and scattering at the interfaces. The distance from the back of the cantilever to the optical window共ᐉcw兲is also an important factor. The difference in the optical path length between the laser beams scattered at one of the inter- faces and reflected at the back of the cantilever 共⌬ᐉ兲 in- creases with increasingᐉcw, as shown in Fig.4共a兲. In order to prevent the laser beam interference at the PSPD surface,⌬ᐉ should be longer thanᐉch.
Figure4共b兲shows theᐉcwdependence ofnzsmeasured in water. The result shows thatnzs decreases by 50% with in- creasing ᐉcw from 0.7 to 2.3 mm. From Fig. 4共a兲, ⌬ᐉ is approximately 2ᐉcw共or 2ᐉcw+tow兲for scattering at the glass/
water共or air/glass兲interface.towis the thickness of the opti- cal window and is 2 mm in the present design. Since nzs
decreases with increasingᐉcw up to ⬃2 mm,ᐉch of the rf- modulated laser beam used in this experiment should be ap- proximately 4–6 mm.
Figure4共c兲shows theP0dependence ofnzsmeasured in water. The experimentally measured values共solid line兲show good agreement with the values theoretically calculated with Eq.共6兲共dotted line兲. This demonstrates thatnzsof the devel- oped sensor is predominantly limited by the photodiode shot noise, even in liquid. The results show that the shot-noise- limited noise performance can be achieved by employing rf laser power modulation and placing the AR-coated optical window sufficiently far from the cantilever.
B. Small cantilevers
In order to detect the deflection of small cantilevers with low nzs, the laser spot size at the back of the cantilever should be small enough to prevent the severe reduction in␣ owing to laser power loss. For a small laser spot size, the focus lens should have a large numerical aperture 共NA兲.
Such a high-NA lens generally has a short ᐉf, leading to a largenzs关Eq.共6兲兴. Therefore, the optimum focus lens differs for cantilevers with different dimensions.
In the previous report,13 replaceable microscope objec- tive lenses were introduced to satisfy the above require- ments. The⫻5 objective lens withᐉf= 40 mm was used for long cantilevers, while the ⫻20 objective lens with ᐉf
= 10 mm was used for short cantilevers. However,nzs mea- sured with the ⫻5 objective lens showed lower nzs values than those obtained with the⫻20 objective lens, even with
the smallest cantilever used in the experiment, and the merit of using replaceable objective lenses could not be proven.
In the present design, I introduced a⫻10 objective lens withᐉf= 10 mm in addition to the⫻5 and⫻20 lenses. The nzs values measured with these three lenses in water are shown in Fig.5共a兲. Three types of cantilevers with different ᐉc were used: NCH 共ᐉc= 125 m兲, NCVH 共ᐉc= 50 m兲, and UHF共ᐉc= 35 m兲. The solid lines show experimentally measured values while the dotted lines show the theoretically calculated values using Eq.共6兲.
The experimentally measured values 共solid lines兲 show good agreement with the calculated values共dotted lines兲, ex- cept for the value measured with the UHF cantilever and the
⫻5 objective lens. This deviation is due to the excess laser spot size共about 30 m in diameter兲compared with the can- tilever dimensions. The⫻5 lens gives the lowestnzs values 共7.8 and 4.7 fm/冑Hz, respectively兲for the NCH and NCVH cantilevers. For the UHF cantilever, the⫻10 lens gives the lowest nzs value 共5.5 fm/冑Hz兲. The ⫻20 lens yields the largestnzs values for all the cantilevers used in this experi- ment. However, the good agreement between the experimen- tal values and the theoretical calculation suggests that the
⫻20 lens should give rise to the best performance for canti- levers shorter than 10 m.
The deflection PSD spectra measured under the best con- ditions for the three cantilever types are shown in Figs.
5共b兲–5共d兲, respectively. The experimentally measured spectra DeflectionPSD[fm/√Hz]
Frequency [kHz]
Frequency [kHz]
040 60 80 100 120 140 160
400 500 600 700 800 Frequency [kHz]
150 200 250 300 350 100
40 80 120
(b) NCH, ×5 objective lens
DeflectionPSD[fm/√Hz]
0 40 80 120
(d) UHF, ×10 objective lens
DeflectionPSD[fm/√Hz]
0 40 80 120
(c) NCVH, ×5 objective lens Cantilever Length [µm]
DeflectionPSD[fm/√Hz]
0 10
0 50 100 150
20 30 40 50
(a)
×20
×5
×10
nzs= 7.8 fm/√Hz
nzs= 4.7 fm/√Hz nzs= 5.5 fm/√Hz
FIG. 5.共Color online兲 共a兲ᐉcdependence ofnzsmeasured with the⫻5,⫻10, and⫻20 objective lenses. The solid lines show the experimentally measured values while the dotted lines show the theoretically calculated values using Eq.共6兲.ᐉf= 10, 20, and 40 mm for⫻20,⫻10, and⫻5 objective lenses, respectively.关共b兲–共d兲兴 The solid lines show the experimentally measured deflection PSD with different cantilevers in water while the dotted lines show the thermally induced deflection PSD calculated using Eq.共7兲.共b兲 NCH cantilever 共ᐉc= 125 m兲, ⫻5 objective lens. 共c兲 NCVH cantilever 共ᐉc= 50 m兲, ⫻5 objective lens.共d兲 UHF cantilever 共ᐉc= 35 m兲, ⫻10 objective lens.
共solid lines兲show good agreement with the values calculated 共dotted lines兲using the following equation for the PSD of the cantilever thermal Brownian motion共nzB兲:
nzB=
冑
2kf0BkQT1
关1 −共f/f0兲2兴2+关f/共f0Q兲兴2, 共7兲 where kB, T, Q, and k are Boltzmann’s constant, absolute temperature,Qfactor, and spring constant of the cantilever, respectively. The results show that the influence ofnzson the deflection PSD is negligible compared with that ofnzBfor all the cantilever dimensions. Thus, the deflection sensor pro- vides the maximum performance such that it is limited only by the thermal cantilever vibration in dynamic-mode AFM.
V. PHOTOTHERMAL EXCITATION
In applications in air or vacuum, it is common to use a piezoactuator to excite the cantilever vibration. However, in the case of liquid environments, the amplitude and phase versus frequency curves obtained with piezoexcitation are heavily distorted by the acoustic resonances of the liquid cell.11This problem is particularly serious in FM-AFM. The distortion often prevents stable self-oscillation of the cantile- ver, particularly during coarse approach of the tip. It also hinders quantitative measurements of the conservative and dissipative forces in FM-AFM.
In order to solve these problems, other cantilever excita- tion methods have been proposed. Among the most common is the magnetic excitation method.25In this method, a canti- lever with a magnetic bead or a thin film is excited with an ac magnetic field generated by the coil under or above the cantilever. The method eliminates the spurious resonances in the phase and amplitude curves. However, the magnetic ma- terials, typically containing transient metals such as Co or Ni, are not necessarily passive in typical solutions used in AFM experiments or biological research and hence may pro- duce ionic contaminations.26,27Attaching a magnetic bead on the back of the cantilever is becoming more and more diffi- cult as the cantilever dimensions are reduced. Driving the coil at high frequency requires high driving voltage and also produces large heat dissipation. Thus, it is highly difficult to drive a stiff共k⬎20 N/m兲 cantilever at a frequency higher than 1 MHz by magnetic excitation.
Another method of avoiding distortions in the amplitude and phase curves is photothermal excitation.28 In this method, a laser beam with modulated power is irradiated onto the thin gold film on the back of the cantilever. Because of the thermal expansion of the Si cantilever and the gold film, cantilever oscillation synchronized with the laser power modulation is induced. The gold film is stable in most of the solutions used in AFM experiments. In addition, the gold coating enhances the reflectivity of the back of the cantilever.
It is easy to drive a stiff cantilever at a frequency higher than 10 MHz by photothermal excitation owing to the fast time response of the laser power to the driving current.
In the present design, I employed photothermal excita- tion for a better applicability to small cantilevers with high resonance frequencies. The major difficulty in the design was
the addition of optical components without deteriorating the low-noise characteristics. In this section, the design guideline for resolving this issue is described.
A. Filter and mirror
The experimental setup for photothermal excitation is shown in Fig.1. In this design, the 635 nm red laser beam is used for detecting the cantilever deflection. In order to sepa- rate the excitation laser beam from the detection laser beam, an infrared共IR兲laser beam with the wavelength of 785 nm was used. The red and IR laser diodes are driven by the automatic current constant共ACC兲driver with a power modu- lation function. The power of the red laser is modulated at 300 MHz to reduce the laser coherence,11 while that of the IR laser is modulated at the cantilever resonance frequency.
The red and IR laser beams are directed to the dichroic mirror with an incident angle of 45°. At the dichroic mirror, the IR laser beam is reflected and the red laser beam is trans- mitted, as shown in Fig.1. The transmission spectrum of the dichroic mirror is shown in Fig.6共a兲. The two laser beams are reflected by the polarizing beam splitter and focused with the objective lens. While the red laser beam is focused on the free end of the cantilever for the best deflection sensitivity, the IR laser beam is focused on the fixed end of the cantile- ver to provide the best excitation efficiency.29
The reflected laser beams are directed to the double IR- cut filters. The red laser beam passes through the filter while the IR laser beam is blocked by the filter, as shown in Fig.
6共b兲. Note that Fig.6共b兲shows the transmission characteris- tics for the “single” IR-cut filter. The selectivity of the single filter is high enough for the applications in air共A⬎1 nm兲, even with a stiff cantilever 共k⬎20 N/m兲, because of the high Q factor. For liquid environments, soft cantilevers should be used 共k⬍20 N/m兲 if the single IR-cut filter is used. In order to use a stiff cantilever共k⬎20 N/m兲in liq- uid, I used two IR-cut filters in series, as shown in Fig. 1.
This configuration provides sufficient selectivity even with stiff cantilevers in liquid.
B. Amplitude and phase curves
Figure7共a兲shows the amplitude versus frequency curve measured with photothermal excitation. The deflection PSD measured without cantilever excitation is also displayed in the same figure. The thermal PSD spectrum shows good
20
6000 700 800
Transmission[%]
Wavelength [nm]
Wavelength [nm]
Transmission[%]
900 40
60 80 100
20
5500 650 750 850
40 60 80
100 (b) IR-cut filter
(a) Dichroich mirror
FIG. 6.共Color online兲The transmission spectra of共a兲the dichroic mirror and共b兲the IR-cut filter.
023707-6 Takeshi Fukuma Rev. Sci. Instrum.80, 023707共2009兲
agreement with the driven amplitude curve around f0. The slight deviation of the driven amplitude curve from the ther- mal spectrum is due to the influence of nzs. Including this influence, the overall deflection PSD共nz兲is given by
nz=冑nzs2 +nzB2 . 共8兲 By fitting the thermal spectrum with this equation and Eq.
共7兲,Q= 8.7 and f0= 157.079 kHz are obtained
Figure 7共b兲 shows the phase versus frequency curve measured with photothermal excitation. The phase versus frequency curve of a driven cantilever is given by
共f兲= tan−1
再
Q共f0/f1−f/f0兲冎
. 共9兲With this equation and theQandf0values obtained from the thermal spectrum, the theoretically expected phase curve is calculated, as indicated by the dotted line in Fig.7共b兲. The calculated phase curve shows excellent agreement with the experimental result indicated by the solid line. The results show that the developed photothermal excitation system is capable of driving a cantilever without exciting spurious resonances. This enables accurate quantitative force mea- surements as well as stable FM-AFM imaging.
C. Thermal stability
Figure 8共a兲 shows the laser power dependence of the cantilever oscillation amplitude induced by photothermal ex- citation. The excitation laser has the maximum power rating
of 20 mW. The average laser powerP0was set at 5 mW and the laser power modulation amplitudePmwas varied from 1 to 5 mW. The cantilever oscillation amplitude A shows a linear dependence on Pm. The maximum value of A at P0
= 5 mW was 0.44 nm in this particular experiment. This excitation efficiency is sufficient for the small-amplitude op- eration of FM-AFM, where A is usually set at 0.1–0.3 nm.
This result demonstrates that the developed photothermal excitation system is compatible with stiff cantilevers 共k⬎20 N/m兲 in liquid.
The average laser power of 5 mW is relatively high.
Thus, we examined whether the laser beam irradiation could increase the liquid temperature. Figure8共b兲 shows the tem- perature variation of the water 共150 ᐉ兲 in the liquid cell measured with photothermal excitation turned on 共P0
= 5 mW and Pm= 5 mW兲. The temperature was measured using a thermocouple sensor with a small sensor head. The sensor head is coated with a Teflon thin film and immersed in the liquid. The laser was turned on at t= 0 on the x-axis.
However, no significant temperature variation was observed during the measurement period共up tot= 90 min兲. The result shows that the heating effect of the IR laser beam is negli- gible for most applications.
We measured the reflected and transmitted laser beam power by irradiating the IR laser beam at the midpoint of the cantilever and obtained 80% and 10% for the reflection and transmission coefficients, respectively. The rest of the power 共10%兲 is expected to be dissipated at the back of the canti- lever and rapidly diffused to the cantilever support metal.
Thus, if any heating effect exists, it should be due to the 10%
transmitted beam. In the actual experiment, the IR laser beam is irradiated at the fixed end of the cantilever so that the transmission coefficient is further decreased. This ac- counts for the observed small heating effect of the IR laser beam.
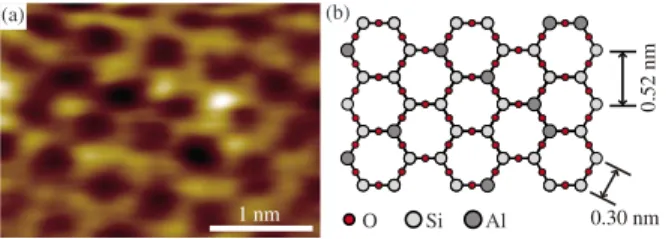
VI. ATOMIC-RESOLUTION IMAGING
The developed OBD sensor was integrated into the FM- AFM instrument reported previously.13 Figure 9 shows the FM-AFM image of mica taken in a phosphate buffer saline solution using the developed system. The tip-sample distance was regulated in the constant frequency-shift mode using the Nanonis SPM controller 共RC-4兲. A high-voltage amplifier 共ENP-4014B: Echo Electronics兲 was used to drive the
080 120 160 200
0.1 0.2 0.3
0 20 40 60
Frequency [kHz]
Amplitude[nm] DeflectionPSD[fm/√Hz]
(a)
80 120 160 200
Frequency [kHz]
(b)
driven
thermal
Phase[deg.]
-90 -45
-135
-180 0
experiment calculated
FIG. 7. 共Color online兲 共a兲Amplitude and共b兲phase vs frequency curves measured with photothermal excitation in water. The deflection PSD spec- trum measured without cantilever excitation is superposed on the driven amplitude curve in共a兲.Qandf0obtained by fitting the thermal PSD spec- trum with Eq.共8兲are 8.7 and 157.079 kHz, respectively. The dotted line in 共b兲is calculated with these parameters in Eq.共9兲, while the solid line shows the experimentally measured values.
0 0 20 40 60 80 100
10 20 30
Time [min]
Temperature[deg.]
00 0.1 0.2 0.3 0.4 0.5
1 2 3 4 5 6
Modulation Amplitude (Pm) [mW]
VibrationAmplitude(A)[nm]
(a) (b)
FIG. 8. 共Color online兲 共a兲Pmdependence ofAinduced by photothermal excitation.共b兲The temperature variation of water共150 ᐉ兲in the liquid cell. The excitation laser was turned on at timet= 0. The cantilever used was NCH共Nanoworld兲with a Au/Ti coating共k= 27 N/m,Q= 8.7兲.
custom-built piezotube scanner. A Si cantilever共NCH: Nano- world兲was driven in the constant-amplitude mode using the developed photothermal excitation system and the digital phase-locked loop共PLL兲system共OC-4: Nanonis兲. The PLL was also used for frequency-shift detection.
The image shows the honeycomblike pattern character- istic of the cleaved mica surface 关Fig. 9共b兲兴. Atomic-scale bright spots are observed on some of the honeycomb pat- terns. In the previous report,12these bright spots were tenta- tively attributed to the aluminum ions constituting the alumi- nosilicate mesh of the mica surface. The result demonstrates the applicability of the developed OBD sensor to true atomic-resolution imaging in liquid.
ACKNOWLEDGMENTS
This research was supported by PRESTO, Japan Science and Technology Agency.
1G. Binnig, C. F. Quate, and C. Gerber,Phys. Rev. Lett.56, 930共1986兲.
2T. R. Albrecht, P. Grütter, D. Horne, and D. Ruger,J. Appl. Phys.69, 668 共1991兲.
3Y. Martin, C. C. Williams, and H. K. Wickramasinghe,J. Appl. Phys.61, 4723共1987兲.
4G. M. McClelland, R. Erlandsson, and S. Chiang,Review of Progress in
Quantitative Non-Destructive Evaluation共Plenum, New York, 1988兲, Vol.
6B, pp. 1307–1314.
5G. Meyer and N. M. Am,Appl. Phys. Lett.53, 1045共1988兲.
6C. Schönenberger and S. F. Alvarado,Rev. Sci. Instrum.60, 3131共1989兲.
7G. Neubauer, S. R. Cohen, G. M. McClelland, D. Horne, and C. M. Mate, Rev. Sci. Instrum.61, 2296共1990兲.
8M. Tortonese, H. Yamada, R. C. Barrett, and C. F. Quate,The Proceedings of Transducers, 1991, Publication No. 91 CH2817–5共IEEE, Pennington, NJ, 1991兲, pp. 448–451.
9T. Itoh and T. Suga,Nanotechnology4, 218共1993兲.
10F. J. Giessibl, Noncontact Atomic Force Microscopy (Nanoscience and Technology)共Springer, Berlin, 2002兲, Chap. 2.
11T. Fukuma, M. Kimura, K. Kobayashi, K. Matsushige, and H. Yamada, Rev. Sci. Instrum.76, 053704共2005兲.
12T. Fukuma, K. Kobayashi, K. Matsushige, and H. Yamada,Appl. Phys.
Lett.87, 034101共2005兲.
13T. Fukuma and S. P. Jarvis,Rev. Sci. Instrum.77, 043701共2006兲.
14T. Fukuma, M. J. Higgins, and S. P. Jarvis,Biophys. J.92, 3603共2007兲.
15T. Fukuma, M. J. Higgins, and S. P. Jarvis,Phys. Rev. Lett.98, 106101 共2007兲.
16T. Fukuma, A. S. Mostaert, and S. P. Jarvis, Nanotechnology19, 384010 共2008兲.
17M. Reinstädtler, T. Kasai, U. Rabe, B. Bhushan, and W. Arnold,J. Phys. D 38, R269共2005兲.
18N. F. Martinez, S. Patil, J. R. Lozano, and R. Garcia,Appl. Phys. Lett.89, 153115共2006兲.
19S. Kawai, S. Kitamura, D. Kobayashi, S. Meguro, and H. Kawakatsu, Appl. Phys. Lett.86, 193107共2005兲.
20A. Raman, J. Melcher, and R. Tung, Nanotoday3, 20共2008兲.
21S. Hembacher, F. J. Giessibl, and J. Mannhart,Science305, 380共2004兲.
22J. Preiner, J. Tang, V. Pastushenko, and P. Hinterdorfer,Phys. Rev. Lett.
99, 046102共2007兲.
23F. J. Giessibl, H. Bielefeldt, S. Hembacher, and J. Mannhart,Appl. Surf.
Sci.140, 352共1999兲.
24F. J. Giessibl, S. Hembacher, H. Bielefeldt, and J. Mannhart,Science289, 422共2000兲.
25S. P. Jarvis, A. Oral, T. P. Weihs, and J. B. Pethica,Rev. Sci. Instrum.64, 3515共1993兲.
26I. Revenko and R. Proksch,J. Appl. Phys.87, 526共2000兲.
27B. Rogers, D. York, N. Whisman, M. Jones, K. Murray, and J. D. Adams, Rev. Sci. Instrum.73, 3242共2002兲.
28N. Umeda, S. Ishizaki, and H. Uwai, J. Vac. Sci. Technol. B9, 1318 共1991兲.
29D. Ramos, J. Tamayo, J. Mertens, and M. Calleja, Appl. Phys. Lett.99, 124904共2006兲.
1 nm O Si Al
0.52nm
0.30 nm
(a) (b)
FIG. 9. 共Color online兲 共a兲FM-AFM image of mica in phosphate buffer solution共⌬f= + 500 Hz,A= 0.098 nm, tip velocity: 117 nm/s兲. The cantile- ver used was NCH 共Nanoworld兲 with a Au/Ti coating 共k= 19.4 N/m, f0= 104.4 kHz兲. The cantilever vibration was excited with the developed photothermal excitation system.共b兲Atomic-scale model of the cleaved mica surface.
023707-8 Takeshi Fukuma Rev. Sci. Instrum.80, 023707共2009兲