body mass index in 11‑ and 12‑ year‑old New Zealand and Japanese school children
著者 Sugiyama Koji, Hamlin Michael J.
journal or
publication title
Studies in Subject Development
volume 1
page range 195‑206
year 2013‑06
出版者 Graduate School of Education, Cooperative
Doctoral CourseAichi University of Education &
Shizuoka University
URL http://hdl.handle.net/10297/7406
【 論文 】
Relationships between physical fitness and body mass index in 11- and 12- year-old New Zealand and Japanese school children
Koji Sugiyama
1, Michael J. Hamlin
21Faculty of Education, Shizuoka University, Japan;
2Environment Society and Design Division, Lincoln University, New Zealand
ABSTRACT
The present study examined differences in scatter plots and correlations between physical fitness factors and body mass index (BMI) for New Zealand and Japanese school children. Subjects were 11- and 12-year-old students living in Hamamatsu City, Japan and Christchurch, New Zealand. Physical fitness tests were performed in each country. For Japanese children, these included a 20-m shuttle run, standing jump, sit and reach, slide steps and sit-up tests. Tests for New Zealand children comprised a 550-m run, standing long jump, sit and reach, agility test, and sit-ups. Comparing physical fitness of children in each country, each test was classified into 5 fitness factors. Correlations of each physical fitness test with BMI for New Zealand and Japanese children were calculated without an underweight group. Prevalence of overweight and obesity were significantly higher in New Zealand children than in Japanese (boys, p<0.05; girls, p<0.001). Prevalence of underweight was higher in Japanese girls than in New Zealand girls (p<0.001). Some fitness factors showed significant negative correlations, but this was not strong.
Despite the different cultures and ethnicities, relationships between BMI and each physical fitness factor were thus similar in both countries. Important problems are the number of lower-fitness children within the normal group in both countries. These findings suggest that relationships between BMI and various fitness factors can be estimated for Japanese children as in Western countries, and development of motor fitness for children of both countries appears warranted regardless of BMI. These regions should share ideas and strategies in the schools and society of both countries to prevent decreasing physical fitness and increasing weight on children.
Keywords
BMI, Physical fitness, New Zealand children, Japanese children
1. INTRODUCTION
Recently, an increase in the number of overweight and inactive children has been observed in developed countries. This problem is one of the most important problems for these countries. Negative associations between physical fitness and body mass index (BMI) have been demonstrated in epidemiological studies (Armstrong and Welsman, 2006, Guerra et al, 2002, Hussey et al., 2007, Japan Ministry of Education Culture, Sports, Science and Technology, Japan, 1998, Mota et al., 2006, Sacchetti et al., 2012, Tokmakidis et al., 2006). Although these studies have revealed relationships between physical fitness levels and BMI
or %fat among children and adolescents, not all physical fitness factors necessarily correlate with BMI. These results suggest the importance not only of study the effects of reducing the prevalence of overweight children and adolescents, but also of considering strategies for helping children and adolescents to grow up healthy.
In Japan, a gradual decline in the fitness level of children and adolescents has been observed (Japan Ministry of Education Culture, Sports, Science and Technology, Japan, 2011) and the number of overweight children has grown over the last 25 years (Japan Ministry of Education Culture, Sports,
Science and Technology, Japan, 1998). However, the prevalence of overweight children in Japan remains much lower than that of Western countries (De Vito et al., 1999, Thorpe et al., 2004, Tokmakidis et al., 2006). The declining level of fitness in children and adolescents may not depend on increasing proportions of overweight individuals. In light of this situation, correlations between physical fitness and BMI may well be unclear because of the small number of overweight children in Japan.
In contrast, the problem of inactive and overweight children is much more apparent in New Zealand, which shows a lifestyle typical of Western countries (Calvert et al., 2000, Dawson et al., 2001, Turnbull et al., 2004). According to a recent study, the prevalence of overweight children was 33.6% among 11 to 14 year olds (Hohepa et al., 2004). Data on relationships between physical fitness and BMI among children in New Zealand could thus provide valuable insights for Japan. In addition, when considering strategies for improving physical fitness and reducing the number of overweight children and adolescents, comparing data from countries with different cultures is very important.
On the other hand, in spite of the lower prevalence of overweight children in Japan, we also have to note that the fitness level of children and adolescents is declining. It is thought that many factors had influence to the decline of a Japanese child's physical fitness, and overweight is only one of the factors.
Thus, comparing scatter plots to BMI for physical fitness factors with New Zealand and Japanese children could thus provide a valuable perspective on the distribution of fitness for Japanese children, and provide an opportunity to consider what should be
done to decrease childhood obesity and increase levels of physical fitness in children. This research is useful to plan gymnastics classes in the elementary schools.
However, no studies have compared scatter plots of physical fitness for normal and overweight groups of children from countries with different cultures.
The aim of the present study was therefore to investigate differences in scatter plots and correlations between physical fitness factors and BMI among children in both New Zealand and Japan.
2. METHODS 2.1. Subjects
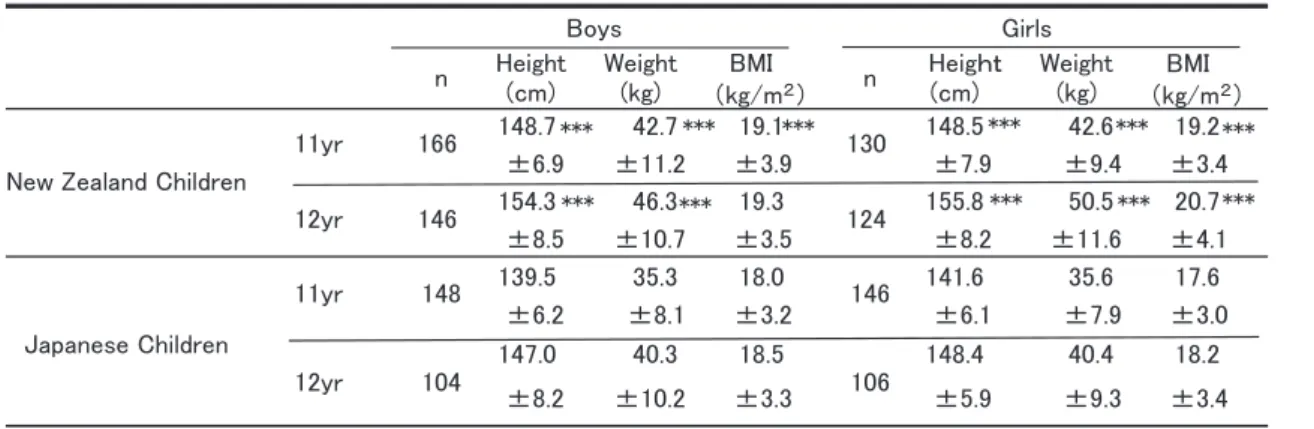
Subjects comprised 11- and 12-year-old students living in Hamamatsu City, Japan and Christchurch, New Zealand. Table 1 shows the number and characteristics of the various gender and age groups.
Japanese age groups corresponded to 5th grade (11 years old) and 6th grade (12 years old) in elementary school. Since physical fitness testing was performed in September, age could have ranged from 10 years 6 months to 11 years 6 months in 5th grade and from 11 years 6 months to 12 years 6 months in 6th grade, respectively. All subjects were Japanese and all tests were performed in 2004 and 2005. Informed consent was obtained from each parent and the principal of the school prior to starting the study.
Conversely, New Zealand children were divided into two age groups (11 years and 12 years) based on the birthday reported on the day of measurement.
The ethnic make-up of the New Zealand sample resembled that of New Zealand as a whole, with approximately 85% European, 10% Maori and 5%
Asian. Collection of New Zealand data was approved by the Canterbury Ethics Committee, New Zealand.
Table 1: Subject characteristics.
n Height (cm)
Weight (kg)
BMI
(kg/m2) n Height (cm)
Weight (kg)
148.7 42.7 19.1 148.5 42.6 19.2
±6.9 ±11.2 ±3.9 ±7.9 ±9.4 ±3.4
154.3 46.3 19.3 155.8 50.5 20.7
±8.5 ±10.7 ±3.5 ±8.2 ±11.6 ±4.1
139.5 35.3 18.0 141.6 35.6 17.6
±6.2 ±8.1 ±3.2 ±6.1 ±7.9 ±3.0
147.0 40.3 18.5 148.4 40.4 18.2
±8.2 ±10.2 ±3.3 ±5.9 ±9.3 ±3.4
***
Boys
146 106
Girls
148 104
166 130
146 124
Japanese Children New Zealand Children
11yr 12yr 11yr 12yr
***
***
***
*** ***
***
***
***
***
***
BMI
(kg/m2)
***Significant difference (p<0.001) between New Zealand and Japanese children in the same sex and age group.
Table 2: Fitness factors and physical fitness tests in both countries. Tests were the Trial Revision Fitness Activities in New Zealand children and the Japan New Physical fitness tests for Japanese children.
New Zealand Japan
Sit and reach Sit and Reach
Reaching as far as possible from sitting position. Reaching as far as possible from sitting position in 90 degree of lower back joint(Japan method)
Standing long jump Standing long jump
Jumping for distance from a standing start. Jumping for distance from a standing start.
Bent knee curl up Sit ups
The number of curl ups but maximum cur-ups is up to 50. The
subjects perform curl up continuously without rest. Maximum number of sit ups achieved in 30 seconds.
Agility and Speed tests Side step test
The time is record that the subjects run quickly 2 times shuttle between 9.14m.
Maximum number of side steps achieved in 20 seconds. The subjects repeat side steps between three lines for 20seconds as quick as they possible..
550m Run 20m multistage shuttle run test
The subjects run 550m at their own best pace Standard test of cardiorespiratory fitness test Cardiorespiratory fitness
Flexibility
Explosive strength
Endurance of abdominal muscles
Speed & Agility
Tests were performed in November, February or March in 2000 and 2003. For Christchurch in New Zealand, the month of November is in spring, and February and March are in autumn.
Informed consent was obtained from the principal of each involved school in Japan, as the dataset was the outcome of a physical fitness test scheduled as an annual event at these schools. Informed consent was obtained from each parent and participant in the New Zealand study prior to participation.
2.2. BMI and cut-off point
Height (±0.1 cm) and weight (±0.1 kg) of subjects were measured with shoes removed and thin light clothes. BMI for each subject was calculated by dividing weight by height squared (kg/m2). Each group divided according to country, sex and age was further divided into four groups: underweight (Under); normal weight (Normal); overweight (Over);
and Obese groups. In the current study, the 5th percentile for BMI was used as a cut-off point for defining underweight (Must et al., 1991). This point is recommended by the Centers for Disease Control and Prevention (CDC), as well as for international use with adolescents aged 10-19 years (World Health Organization, 1995). Overweight and obesity were defined as >85th and >95th percentile of BMI. These cut-off points referred to International Obesity Task Force values (Cole et al., 2000).
2.3. Physical fitness test
Physical fitness tests that are well known in each country were used to maximize subject ability as far as possible. The 5 tests for Japanese children used in this study were thus the 20-m shuttle run, standing
jump, sit and reach, slide steps, and sit-up tests.
These tests followed the manual new physical fitness tests made by the Ministry of Science and Education in Japan (Ministry of Education Culture, Sports, Science and Technology, Japan, 1998). Height and weight of all students with light clothing were measured within a month after the physical fitness test at each school. Conversely, tests for New Zealand children were the 550-m run, standing long jump, sit and reach, agility test, and sit-ups. These tests were described in the Trial Revision Fitness Activities (Department of Education, New Zealand, 1984).
Height and weight were measured as for Japanese children. On these tests, only standing long jump was a common test in both countries.
Comparing physical fitness levels might be difficult, but calculating T-score for each country, age and sex with each physical fitness tests would enable comparison of these data as fitness factors.
Comparing physical fitness of both countries, each test was classified into 5 fitness factors on the basis of main ability assessed in each test: aerobic power;
agility; anaerobic power; flexibility; and strength (Table 2).
2.4. Analysis of physical fitness test
Mean and SD of physical fitness tests were calculated for a Normal group in each country, sex and age. T-score of each fitness test was then calculated in each age and sex and country using the mean and SD. Correlations of each physical fitness test with BMI for New Zealand and Japanese children were calculated without an Under group.
Linear regressions were also conducted without underweight children. The scatter graphs between
BMI and T-score of each fitness factor in both countries were illustrated to reveal distributions. To observe the scatter plots in each range of BMI, the vertical dotted lines were drawn at each cut-off point.
The border lines were shown as three vertical dotted lines because the border values for the children in this study are very close.
2.5. Statistics
Mean and SD of each physical data was expressed in mean ±SD, compared between the two countries in the same age and sex using unpaired Student’s t-test.
The 2 test was used to compare prevalences of underweight, overweight and obese children between both countries. Linear regression analysis and Pearson correlation coefficient were calculated to assess relationships between BMI and T-score for each physical fitness factor with data from normal to obese children. In all analyses, a 5% significance level was used.
3. RESULTS
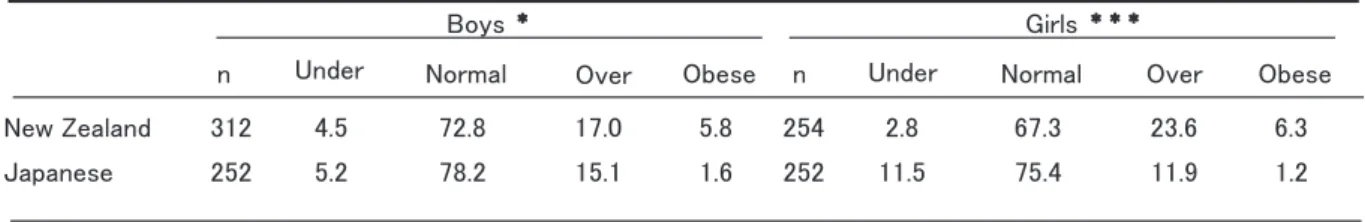
Total prevalences of overweight and obesity were 22.8% in boys and 29.9% in girls for New Zealand, and 16.7% in boys and 13.1% in girls for Japan, respectively. The percentage of underweight children was 4.5% for New Zealand boys, 2.8% for New Zealand girls, 5.2% for Japanese boys and 11.5% for Japanese girls (Table 3). Prevalences of overweight and obesity were significantly higher in New Zealand than in Japan (boys, p<0.05; girls, p<0.001).
Prevalence of underweight was significantly higher in Japanese girls than in New Zealand girls (p<0.001).
Correlation coefficients for each fitness factor are shown in Table 4. Almost all factors showed significant negative correlations except for endurance of abdominal muscles in New Zealand boys, flexibility in Japanese boys and New Zealand girls and flexibility, endurance of abdominal muscles and speed
and agility for Japanese girls. The fitness factor displaying the highest correlation was cardiorespiratory fitness in all groups: r=-0.473 in New Zealand boys; r=-0.470 in Japanese boys; -0.552 in New Zealand girls; and -0.378 in Japanese girls.
The correlation to flexibility was positive for Japanese boys (p<0.01), but was very weak, r=0.193.
Figures 1-5 show scatter plots and linear regressions between BMI and each fitness factor in each country. Some New Zealand children in the range of Normal group displayed extremely high T-scores, >80, on flexibility (Fig. 1). In addition, some girls showed very lower T-score, <30, in the Over group in New Zealand. In contrast, on scatter graphs for Japanese children, subjects with BMI >30 kg/m2 scored between 60 and 70 in T-score. Some children in the normal group scored <30 in T-score for flexibility.
Figure 2 shows the relationship between explosive power and BMI. This relationship was very similar in each sex between both countries. T-score ranged between 10 and 80 and slope to BMI of linear regression was from -0.8 to -1.2. The upper limit, 50 repetitions, on the sit-up test (abdominal muscle endurance) in New Zealand children corresponded to a score of 70 for girls and 60 for boys. Many boys achieved the upper limit. Scatter plots of abdominal muscle endurance for New Zealand clearly revealed upper and lower score groups (Fig. 3). In Japanese children, scatter plots of this factor showed individual differences in the Normal group. Speed and agility of both countries tended to decrease with increasing BMI (Fig. 4). However, some children showed extremely low T-score, <20 in both group areas. A negative correlation was observed between cardiorespiratory fitness and BMI in both countries and both sexes (Fig. 5). The graph for New Zealand children indicated the existence of children with extremely low T-scores within normal and overweight groups.
Table 3: Prevalence of Under group, Normal group, Over group and Obese group in both countries.
(%)
n Normal Over Obese n Under Normal Over Obese
New Zealand 312 4.5 72.8 17.0 5.8 254 2.8 67.3 23.6 6.3
Japanese 252 5.2 78.2 15.1 1.6 252 11.5 75.4 11.9 1.2
Girls ***
Boys * Under
*p<0.05, ***p<0.001 between New Zealand and Japanese children
Table 4: Correlation between BMI and physical fitness tests for each sex and country.
n n n n
Flexibility -0.169 ** 241 0.193 ** 236 -0.119 209 0.0911 220
Explosive strength -0.313 *** 267 -0.393 *** 236 -0.302*** 233 -0.2743 220 Endurance of abdominal muscles -0.080 114 -0.206 ** 235 -0.278** 105 -0.0612 219 Speed & Agility -0.354 *** 125 -0.316 *** 236 -0.180 120
***
-0.0767 220
Cardiorespiratory fitness -0.473 *** 266 -0.470 *** 236 -0.552 209 -0.3767*** 219
Fitness factor r r r r
Boys Girls
NZ Japan NZ Japan
*
***
*p<0.05; **p<0.01; ***p<0.001.
4. DISCUSSION
The aim of the present study was to clarify differences in scatter plots and correlations between physical fitness factors and BMI for children in New Zealand and Japan. First, since the children sampled in this study lived in cities in both countries, we must consider whether the physiques identified reflect the general distributions for children in New Zealand and Japan. Next, height and weight (mean SD) and prevalence of each weight group (Under, Normal, Over and Obese) were compared with reported values from both countries (Japanese surveys in 2006 and
New Zealand surveys (Hohepa et al, 2004)). Subjects were sampled from a part of Japan and a part of New Zealand. Sample data on physique were at similar levels to other reports from each country. Japanese surveys do not use BMI for assessment of overweight children, but instead use standard body weight determined according to Hibi’s monogram (Hibi, 1968). Japanese data in this study were therefore assessed according to that monogram. The data set of this study resembled the report of Japanese surveys in 2006. Subjects in this study were considered typical of findings from each country.
Figure 1:
Flexibility
Figure 1: Scatter plots comparing BMI and T-score of flexibility. Lower, Japanese and upper, New Zealand. Solid lines are linear regression slope for boys. The vertical dotted lines are showed border of four groups in all children.
The calculated border is different from age and sex, but the border lines are shown as three vertical dotted lines because the border values for the children in this study are very close.
New Zealand Children
1020 3040 5060 7080 10090
10 12 14 16 18 20 22 24 26 28 30 32 34 36
BMI
Boys y = -0.4505x + 58.121 R2= 0.0285
Boys Girls
Japanese Children
Boys y = 0.6036x + 39.204 R2= 0.0373
10 20 30 40 50 60 70 80 90 100
10 12 14 16 18 20 22 24 26 28 30 32 34 36
BMI
T-score
Normal G range Over G range New Zealand Children
1020 3040 5060 7080 10090
10 12 14 16 18 20 22 24 26 28 30 32 34 36
BMI
Boys y = -0.4505x + 58.121 R2= 0.0285
Boys Girls
Boys y = -0.4505x + 58.121 R2= 0.0285
Boys Girls
Japanese Children
Boys y = 0.6036x + 39.204 R2= 0.0373
Boys y = 0.6036x + 39.204 R2= 0.0373
10 20 30 40 50 60 70 80 90 100
10 12 14 16 18 20 22 24 26 28 30 32 34 36
BMI
T-score
Normal G range Over G range Normal G range Over G range
Figure 2:
Explosive strength
Boys Girls
Boys y = -1.2322x + 71.084 R2= 0.1538
Girlsy = -0.9561x + 66.124 R2= 0.0753
0 10 20 30 40 50 60 70 80 90
10 12 14 16 18 20 22 24 26 28 30 32 34 36
BMI
T-score
New Zealand children Boys y = -0.9975x + 67.65
R2= 0.0981
Girls y = -0.8125x + 64.748 R2= 0.0891
0 10 20 30 40 50 60 70 80 90
10 12 14 16 18 20 22 24 26 28 30 32 34 36
Japanese children
Normal G range Over G range
Boys Girls Boys Girls
Boys y = -1.2322x + 71.084 R2= 0.1538
Girlsy = -0.9561x + 66.124 R2= 0.0753
0 10 20 30 40 50 60 70 80 90
10 12 14 16 18 20 22 24 26 28 30 32 34 36
BMI
T-score
New Zealand children Boys y = -0.9975x + 67.65
R2= 0.0981
Girls y = -0.8125x + 64.748 R2= 0.0891
0 10 20 30 40 50 60 70 80 90
10 12 14 16 18 20 22 24 26 28 30 32 34 36
Japanese children
Normal G range Over G range Normal G range Over G range
Figure 2: Scatter plots of BMI and T-score of explosive strength. Lower, Japanese and upper, New Zealand. Solid lines and dashed lines represent linear regression slopes for boys and girls, respectively. The vertical dotted lines are showed border of four groups in all children. The calculated border is different from age and sex, but the border lines are shown as three vertical dotted lines because the border values for the children in this study are very close.
As a side note, the season in which fitness tests are performed is important when comparing results between countries, because environmental temperature might affect performance in fitness tests.
In this study, fitness tests were performed in September in Japan and in November, February or March in New Zealand. Season thus seems unlikely to have had any major impact on the results, as tests were performed in warm seasons in both countries. In addition, the period of investigation must be considered. New Zealand data were from 2000 and 2003, while Japanese data were from 2005 and 2006.
Levels of child fitness and physique appear to be slowly declining (Dawson et al, 2001, Ministry of Education Culture, Sports, Science and Technology, Japan, 2005, Santtila, 2006), and should be carefully observed in the long-term, over more than a decade.
The data from this study indicates that the
relationship between BMI and each fitness factor represents the actual condition for children over the last decade.
In addition, NZ data showed almost the same ethnic distribution as the country as a whole.
Prevalence of overweight and obesity was significantly higher among New Zealand children than among Japanese for both sexes. Rates of obese children in New Zealand boys and girls were 4.2%
(boys) and 5.1% (girls) higher than those in Japanese children. The relationship between physical fitness and BMI in this study thus shows current circumstances for fitness and obesity in both countries. Considering the prevalence of Japanese obesity was lower than that of New Zealand, the results for New Zealand children may indicate a future trend for Japanese children, who may be becoming more obese.
Recent studies have reported that flexibility does not differ significantly between normal and overweight children (Deforche et al., 2003;
Tokmakidis et al., 2006). The relationship between BMI and flexibility was significantly negative in New Zealand boys, but very weakly positive in Japanese boys. The significance of the results for flexibility in New Zealand children and Japanese boys in this study was caused by extreme values in both countries.
Some children of the Normal group in New Zealand displayed extremely high T-scores, >80, for flexibility.
Conversely, the two Japanese boys with BMI >30 kg/m2 showed relatively higher T-scores, of 67.9 and 74.6. Therefore, flexibility does not appear to be associated with BMI, as indicated in a previous study (Tokmakidis et al., 2006). Scatter graphs of flexibility for Japanese children also show that the small number of obese children may result in a mis-estimation of the relationship between fitness and BMI. Tokmakidis et al. (2006) reported that the higher BMI categories were strongly associated with inferior performances in all fitness tests, except flexibility for Greek children. Other previous studies have reported similar results for the United States (Kim et al., 2005) and Flemish children (Deforche et al., 2003). In this study, relationships between BMI and explosive strength, speed and agility and cardiorespiratory fitness in boys in both countries showed negative correlations. Explosive strength and cardiorespiratory fitness among girls in both countries were significantly associated with BMI.
These results support data from other countries. The fitness factor which showed the highest correlation was cardiorespiratory fitness in all groups, with r=-0.473 in New Zealand boys, r=-0.470 in Japanese boys, r=-0.552 in New Zealand girls and r=-0.378 in Japanese girls (p<0.001 each). These results support the findings of previous studies. The results for explosive strength and cardiorespiratory fitness indicate that excess body fat represents an extra load to be moved during weight-bearing tasks. The variation for cardiorespiratory fitness was much wider for New Zealand children than for Japanese.
One contributing factor would be that the 550-m run test used in New Zealand is slightly short for assessing cardiorespiratory fitness. These factors in both countries were significantly associated with BMI, but it should be noted that decreasing of children’s
fitness can not explain only in BMI. In addition, the highest correlation (r=-0.552) with BMI in this study was not indicative of a very strong relationship. The correlation between physical fitness factors and BMI in this study suggests that we should carefully observe scatter plots for each physical fitness value and BMI.
Despite the use of weight-bearing tasks, the relationship between BMI and speed and agility was not exceptionally strong in either country, with no correlation seen in Japanese girls. Plots of each fitness factor for children in the normal range groups in both countries were widely scattered on each graph.
Some children showed extremely low T-scores, <20, for speed and agility in both countries. The latest studies measuring physical activity in children have reported that children tend to be inactive. Emphasis has been placed on the concept that children should be more active to prevent becoming overweight. In addition, the extremely low speed and agility in the Normal group range in this study may indicate that, for children of both countries, the development of motor fitness training is as important as increasing daily energy expenditures.
Abdominal muscle endurance for New Zealand children (Fig. 3) was very interesting. Many children with lower T-scores were seen within the normal weight range and a small number of children showed mean T-score level. This would be because the upper limit for the sit-up test was 50 repetitions. However, this phenomenon may indicate that physical strength in developed countries tends to be polarized as either high or low. The results of this investigation suggest that lower physical activity is also becoming a more serious problem for all children in both countries regardless of underweight, normal weight or overweight status.
The rate of underweight children among Japanese girls, at 11.5%, was 5% more than among New Zealand children and Japanese boys. Japanese girls with BMI <14 kg/m2 tend to show lower T-scores on cardiorespiratory fitness (Fig. 5). Some of the samples of underweight New Zealand children and Japanese boys also tended to show lower fitness levels. Both countries may need to grapple with the problem of nutrition and exercise for underweight children in the future.
Figure 3:
Endurance of abdominal muscle
Boys Girls New Zealand Children
Girls y = -0.6801x + 62.134 R
2= 0.0749
0 10 20 30 40 50 60 70 80
10 12 14 16 18 20 22 24 26 28 30 32 34 36
Japanese Children
Boys y = -0.6276x + 60.771 R
2= 0.0423
0 10 20 30 40 50 60 70 80
10 12 14 16 18 20 22 24 26 28 30 32 34 36
BMI
T-Score
Normal G range Over G range Boys Girls Boys Girls New Zealand Children
Girls y = -0.6801x + 62.134 R
2= 0.0749
0 10 20 30 40 50 60 70 80
10 12 14 16 18 20 22 24 26 28 30 32 34 36
Japanese Children
Boys y = -0.6276x + 60.771 R
2= 0.0423
0 10 20 30 40 50 60 70 80
10 12 14 16 18 20 22 24 26 28 30 32 34 36
BMI
T-Score
Normal G range Over G range Normal G range Over G range
Figure 3: Scatter plots of BMI and T-score for endurance of abdominal muscle. Lower, Japanese and upper, New Zealand. Solid line and dashed lines represent linear regression slopes for boys and girls, respectively. The vertical dotted lines are showed border of four groups in all children. The calculated border is different from age and sex, but the border lines are shown as three vertical dotted lines because the border values for the children in this study are very close.
Figure 4:
Speed and Agility
Boys Girls
New Zealand Children
Boys y = -0.9482x + 66.67R2 = 0.1253 Girls y = -0.4165x + 57.621
R2= 0.0303
10 20 30 40 50 60 70
10 12 14 16 18 20 22 24 26 28 30 32 34 36
Japanese Children
Boys y = -1.0388x + 67.787 R2 = 0.0998
10 20 30 40 50 60 70
10 12 14 16 18 20 22 24 26 28 30 32 34 36
BMI
T-Score
Normal G range Over G range Boys Girls Boys Girls
New Zealand Children
Boys y = -0.9482x + 66.67R2 = 0.1253 R2 = 0.1253 Girls y = -0.4165x + 57.621
R2= 0.0303 Girls y = -0.4165x + 57.621
R2= 0.0303
10 20 30 40 50 60 70
10 12 14 16 18 20 22 24 26 28 30 32 34 36
Japanese Children
Boys y = -1.0388x + 67.787 R2 = 0.0998
10 20 30 40 50 60 70
10 12 14 16 18 20 22 24 26 28 30 32 34 36
BMI
T-Score
Normal G range Over G range
Figure 4: Scatter plots of BMI and T-scores of speed and agility. Lower, Japanese and upper, New Zealand. Solid and dashed lines in each graph represent linear regression slopes for boys and girls, respectively. The vertical dotted lines are showed border of four groups in all children. The calculated border is different from age and sex, but the border lines are shown as three vertical dotted lines because the border values for the children in this study are very close.
Figure 5:
Cardiorespiratory fitness
New Zealand Children Boys y = -1.658x + 79.127
R2= 0.2237
Girls y = -1.9527x + 84.726 R2= 0.3076
0 10 20 30 40 50 60 70 80
10 12 14 16 18 20 22 24 26 28 30 32 34 36
T-score
Boys y = -1.5287x + 76.736
= 0.2211
Girls y = -1.2444x + 71.161
BMI
R2= 0.1419
0 10 20 30 40 50 60 70 80
10 12 14 16 18 20 22 24 26 28 30 32 34 36
Japanese Children
R2 Normal G range Over G range
New Zealand Children Boys y = -1.658x + 79.127
R2= 0.2237
Girls y = -1.9527x + 84.726 R2= 0.3076
0 10 20 30 40 50 60 70 80
10 12 14 16 18 20 22 24 26 28 30 32 34 36
New Zealand Children Boys y = -1.658x + 79.127
R2= 0.2237
Girls y = -1.9527x + 84.726 R2= 0.3076
0 10 20 30 40 50 60 70 80
10 12 14 16 18 20 22 24 26 28 30 32 34 36
T-score
Boys y = -1.5287x + 76.736
= 0.2211
Girls y = -1.2444x + 71.161
BMI
R2= 0.1419
0 10 20 30 40 50 60 70 80
10 12 14 16 18 20 22 24 26 28 30 32 34 36
Japanese Children
R2 Normal G range Over G range
Figure 5: Scatter plots of BMI and T-scores of cardiorespiratory fitness. Lower, Japanese and upper, New Zealand.
Solid and dashed lines represent linear regression slopes for boys and girls, respectively. The vertical dotted lines are showed border of four groups in all children. The calculated border is different from age and sex, but the border lines are shown as three vertical dotted lines because the border values for the children in this study are very close.
Japan and New Zealand have big differences in culture, including lifestyles and sports. For example, in New Zealand, most of the students are driven to and from the school by parents or a school bus. On the other hand, most of the Japanese students go to and from the school in walking. And New Zealand students move to the class room every subject on foot with their backpack, in contrast, Japanese students wait in their home room a teacher coming.
Furthermore, the home time or time table of New Zealand schools is different from that of Japanese Schools. However, both countries have common problems in that children tend to be increasingly inactive and overweight. Despite differing cultures and ethnicities, relationships between BMI and each physical fitness factor were very similar in these countries. This suggests that the relationship between BMI and various fitness factors could be estimated for Japanese children just as in Western countries such as New Zealand, even if a smaller proportion of children are overweight in Japan.
Correlations between BMI and each fitness factor were significant, but were not strong in either country.
In addition, children with lower fitness levels (T-score
<20) could be found in the Normal groups of both countries. Additionally, the eating habit of Japanese tends to westernize, the TV games which were thought up in Japan spread in Western countries and disturb children’s outdoor games in the park or sports facilities. These results and social phenomena indicate that both countries should share ideas and strategies to arrest further decays in childhood physical fitness. Development of motor fitness for children of both countries appears warranted regardless of BMI. Focusing on preventing or decreasing overweight status in childhood, especially in Japan, does not seem likely to be a productive avenue of addressing fitness in children. These regions should share ideas and strategies in the schools and society of both countries to prevent decreasing physical fitness and increasing weight on children.
REFERENCES
Armstrong N, Welsman JR (2006) The physical activity patterns of European youth with
Reference to Methods of Assessment. Sports Med 36(12): 1067-1086
Calvert S, Ross J, Hamlin M (2000) Levels of physical activity of a sample of 10-13 year old New Zealand children NZ Med J 114: 496-498
Cole T, Bellizzi M, Flegal K, Dietz W (2000) Establishing a standard definition for child overweight and obesity worldwide: international survey. BMJ 320: 1240-3
Dawson K, Hamlin MJ, Ross J (2001) Trends in the healty related physical fitness of 10-14 year old New Zealand children. J Physical Ed New Zealand 32(1): 26-39
Department of Education, New Zealand (1984) Trial Revision Fitness Activities -Physical Education- S2-F2. Wellington: Government Printer
Deforche B, Lefevre J, Bourdeaudhuij ID, Hill AP, Duquet W, Bouckaert J (2003) Physical Fitness and Physical activity in obese and nonobese Flemish youth . Obesity Research 11:434-441 De Vito E, La Torre G, Langiano E, Berardi D,
Ricciardi G (1999) Overweight and obesity among secondary school children in central Italy. Eur J Epidemiology 15: 649-654
Guerra S, Ribeiro JC, Costa R, Duarte J, Mota J (2002) Relationship between cardiorespiratory fitness, body composition and blood pressure in school children. J Sports Med Phys Fitness 42:
207-213
Hibi I. (1968) Obesity Textbook of pediatrics ,Tokyo Japan,Nakayamasyoten, (in Japanese)
Hohepa M, Schofield G, Kolt G (2004) Adolescent obesity and physical inactivity. NZMJ : 117(1207) Hong SW, Hamlin MJ (2005) Secular trends and
contemporary differences in physique and
helth-related fitness levels of 11-12 year-old South Korean and New Zealand children.
36(5):1339-1345
Hussey J, Bell C, Bennett K, O’Dwyer J, Gormley J (2007) Relation between the intensity of physical activity, inactivity, cardiorespiratory fitness and body composition in 7-10-year-old Dublin children.
Br J Sports Med 41:311-316
Kim J, Must A, Fitzmaurice GM, Gillman MW, Chomitz V, Kramer E, McGowan R, Peierson KE
(2005) Relationship of Physical Fitness to Prevalence and Incidence of Overweight among Schoolchildren. Obese Res 13:1246-1254 Matsushita Y, Yoshiike N, Kaneda F, Yoshita K,
Takimoto H (2004) Trends in childhood obesity in Japan over the last 25 years from the National Nutrition Survey. Obes Res 12:205–214.
Ministry of Education Culture, Sports, Science and Technology , Japan (1998) Japan new physical fitness test manual (in Japanese),
( http://www.mext.go.jp/a_menu/sports/stamina/05 030101/001.pdf)
Ministry of Education Culture, Sports, Science and Technology, Japan (2005) Japan's Education at a Glance 2005. II Social Education, Sports, Culture II-3:42-46
( http://www.mext.go.jp/english/statist/05101901/0 06.pdf )
Mota J, Flores L, Flores L, Ribeiro J, Santos MP (2006) Relationship of single measures of cardiorespiratory fitness and obesity in young schoolchildren Am J Human Biol 18: 335-341 Must A, Dallal G, Dietz W (1991) Reference data for
obesity. 85th and 95th percentiles of body mass index (wt/ht2) and triceps skinfold thickness.
American Journal of Clinical Nutrition;
53:839-846
Sacchetti R, A Ceciliani, A Garulli, A Masotti, G Poletti, P Beltrami, E Leoni (2012) Physical fitness of primary school children in relation to
overweight prevalence and physical activity habits.
J Sports Sci 30(7): 633-640
Santtila M,Kyrolainen H, Vasankari T, Tiainen S, Palvalin K, Hakkinen A, Hakkinen K(2006) Physical fitness profiles in young Finnish Men during the years 1975-2004. Med Sci Sports Exerc 38(11):1990-1994
Scott DJ, Schofield G, Duncan EK (2006)
Pedometer-Determined physical activity and body composition in New Zealand children Med Sci Sports Exerc 38(8): 1402-1409
Thorpe LF, List DG, Marx T, May L, Helgerson SD, Frieden TR (2004) Childhood obesity in New York city elementary school students. Am J Public Health 94(9):1496-1500
Tokmakidis SP, Kasambalis A, Christodoulos AD (2006) Fitness levels of Greek primary
schoolchildren in relationship to overweight and
obesity. Eur J Pediatr 165: 867-874
Tomkinson GR, L´eger LA, Olds1 TS, Cazorla G (2003) Secular trends in the performance of children and adolescents (1980-2000) An analysis of 55 studies of the 20m shuttle run test in 11 countries. Sports Med 33(4):285-300
Turnbull, AD Wickens, DB, Crane, J (2004) Changes in body mass index in 11-12-year-old children in Hawkes Bay, New Zealand (1989-2000). J Paediatr
Child Health 40: 33-37
World Health Organization (1995) Physiological status : the use and interpretation of
anthropometry , report a WHO Expert committee.
World Health Organ Tech Rep Ser, 854:1-452
【連絡先 杉山 康司
E-mail: [email protected]】