young w
om
en
著者
Saw
ai Akem
i , Toc hi gi Yur i ko, Kaval i ova
N
adz eya, Zabor onok Al exander , W
ar as hi na Yuki ,
M
at hi s Br yan J . , M
es aki N
obor u, Shi r aki
H
i t os hi , W
at anabe Koi c hi
j our nal or
publ i c at i on t i t l e
PLO
S O
N
E
vol um
e
13
num
ber
1
page r ange
e0191022
year
2018- 01
権利
( C) 2018 Saw
ai et al . Thi s i s an open ac c es s
ar t i c l e di s t r i but ed under t he t er m
s of t he
Cr eat i ve Com
m
ons At t r i but i on Li c ens e, w
hi c h
per m
i t s unr es t r i c t e d us e, di s t r i bu t i on, and
r epr oduc t i on i n any m
edi um
, pr ovi ded t he
or i gi nal aut hor and s our c e ar e c r edi t ed.
U
RL
ht t p: / / hdl . handl e. net / 2241/ 00150869
MRI reveals menstrually-related muscle
edema that negatively affects athletic agility in
young women
Akemi Sawai1, Yuriko Tochigi1, Nadzeya Kavaliova2, Alexander Zaboronok3*,
Yuki Warashina4, Bryan J. Mathis3, Noboru Mesaki4, Hitoshi Shiraki4, Koichi Watanabe4* 1Graduate School of Comprehensive Human Sciences, University of Tsukuba, Tsukuba, Ibaraki, Japan, 2University of Tsukuba Hospital, Tsukuba, Ibaraki, Japan,3Faculty of Medicine, University of Tsukuba, Tsukuba, Ibaraki, Japan,4Faculty of Health and Sport Sciences, University of Tsukuba, Tsukuba, Ibaraki, Japan
*[email protected](AZ);[email protected](KW)
Abstract
Context
About 10% of Japanese female athletes are afflicted by menstrually-related edema, mainly in the lower limbs, and, with few studies on this problem, the effect on performance remains unclear.
Objective
To quantitatively evaluate fluid retention in the calf in female students over their menstrual cycle using magnetic resonance imaging (MRI) and to determine the relationship of MRI changes and athletic performance.
Design
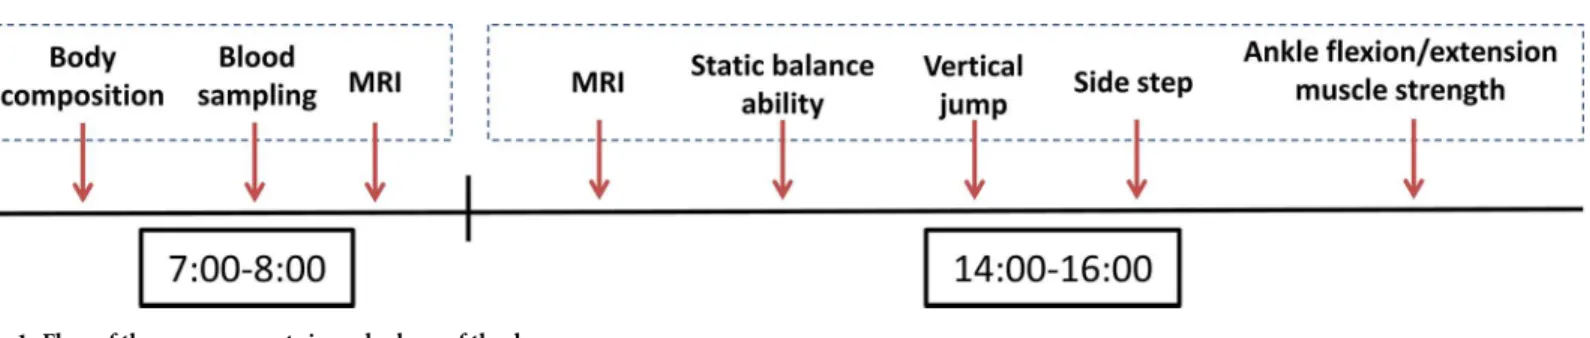
The menstrual cycle was divided into 5 phases: menstrual, follicular, ovulatory, early luteal, and late luteal with sampling done in either morning (AM) or afternoon (PM) sessions. At each phase, MRI of the calf (7:00–8:00, 14:00–16:00), body composition and hormones (7:00–8:00), and athletic performance (14:00–16:00) were evaluated.
Participants
13 adult healthy Japanese female students with eumenorrhea.
Results
Estradiol levels decreased significantly in the menstrual phase and the follicular phase com-pared to the early luteal phase (P= 0.001,P= 0.024 respectively). Menstrual phase estra-diol levels were significantly lower compared to the ovulatory phase (P= 0.015), and the late luteal phase (P= 0.003). Progesterone levels decreased significantly in the menstrual phase and the follicular phase compared to the ovulatory phase (P= 0.012,P= 0.009 respectively), the early luteal phase (bothP= 0.007), and the late luteal phase (P= 0.028,
a1111111111 a1111111111 a1111111111 a1111111111 a1111111111
OPEN ACCESS
Citation:Sawai A, Tochigi Y, Kavaliova N, Zaboronok A, Warashina Y, Mathis BJ, et al. (2018) MRI reveals menstrually-related muscle edema that negatively affects athletic agility in young women. PLoS ONE 13(1): e0191022.https://doi. org/10.1371/journal.pone.0191022
Editor:Cornelis B. Lambalk, VU medisch centrum, NETHERLANDS
Received:December 22, 2016
Accepted:December 27, 2017
Published:January 24, 2018
Copyright:©2018 Sawai et al. This is an open access article distributed under the terms of the
Creative Commons Attribution License, which permits unrestricted use, distribution, and reproduction in any medium, provided the original author and source are credited.
Data Availability Statement:All relevant data are within the paper and its Supporting Information files.
Funding:The authors received no specific funding for this work.
P= 0.029 respectively), and it along with a significant decrease in the ovulatory phase com-pared to the early luteal phase (P= 0.010). AM T2 signals were significantly lower in the menstrual phase compared to the ovulatory phase (P= 0.043) but not other phases. PM T2 signals increased significantly in the menstrual phase compared to the follicular phase (P= 0.003), ovulatory phase (P= 0.009), and the late luteal phase (P= 0.032), and the difference between the AM and PM values increased significantly in the menstrual phase compared to the other 4 phases (P<0.01). A negative correlation between fluid retention and agility was observed.
Conclusion
In female students fluid retention during the menstrual phase could be a factor that influ-ences athletic agility.
Introduction
Currently, the number of female athletes is increasing, with the 2012 Olympic Games seeing
the highest ever number of female athletes with 4675 women participating [1]. Of particular
importance to supporting female athletes is investigation of the unique influence of menorrhea on physical activity and conditioning. About 80% of Japanese top-level female athletes and
over 50% of regular female athletes in Japan experience menstrual discomfort [2,3] and 10%
(of those 80%) are afflicted by edema [4], which are thought to be somatosensory factors that
influence conditioning by increasing fear and anxiety during training. The worldwide known number of women suffering from premenstrual syndrome (PMS) differs by country and
study, with 10~79% in Europe [5,6], 21~98.2% in Asia [5,7], 41% in the USA, 25.2%~97.2% in
South America (Brazil) [6], and 85% in Africa (Nigeria)[5]. Previous studies have reported the
prevalence of PMS as 41% of athletes and 59% of non-athletes among Iranian students [8], in
Turkey, 2 studies found 55.88% and 66.11% [9], and 37.76% and 46.89% [10], respectively, and
in 42.4% of female athletes in Poland [11].
In previous reports, estrogen and progesterone were suggested to have direct and indirect influence on bodily fluid deposition in tissues and sodium regulation and thereby influence
menstrual cycle-related edema [12–15]. These hormones are reported to influence exercise
[16,17] and athletic performance is affected by symptoms occurring before menstruation
which are collectively called premenstrual syndrome (PMS) [18,19]. The indirect influence
reportedly occurs through the renin-angiotensin-aldosterone system (RAAS) and changes in
arginine vasopressin (AVP) secretion [14,15]. However, in the literature, the description of the
exact mechanisms by which edema and its related symptoms influence female athletic
perfor-mance is lacking [20].
MRI is considered a useful tool in detection of different pathological conditions in skeletal muscles that may cause an alteration in the signal intensity. Normal skeletal muscle MR signal intensity is usually slightly higher than the signal of water and much lower than that of fat on T1-weighted images and much lower than the signal of both fat and water on T2-weighted images. Muscle edema patterns, which almost always develop due to increased intracellular or extracellular water, are characterized by increased T2-signal intensity superimposed on normal
appearance of the involved muscle or muscles [21].
evaluation of edema associated with the menstrual cycle based on T2 signal intensity could be important to understand changes in physical condition and help to identify both the reasons for variation of water balance in the lower limbs and its effect on athletic performance.
Materials and methods
Study population
Initially, we analyzed data for 13 female undergraduate and graduate students (23.5±0.4 years old, 160.4±1.4 cm height) of the University of Tsukuba, Tsukuba City, Japan. The participants were recruited from May 1st to June 30th 2015. The inclusion criteria were as follows: age 20 to 25 years, menarche occurred at least 5 years before the start of the study, regular menstrual cycle, normal physical activity level (no professional athletes), physically healthy without any serious illnesses, no oral contraception or other medications, and nonsmoker. All participants received an explanation of the purpose and the flow of the study and signed an informed con-sent form prior to their inclusion. Powers analysis indicated that the sample size was sufficient to enable rejection of the null hypothesis. The noninvasiveness of the imaging ensured the safety of the participants. All aspects of the study were approved by the Ethics Committee of the University of Tsukuba.
Study procedures
Starting at least 2 months prior to the MRI measurements for edema, the participants mea-sured basal body temperature every morning after awakening and recorded it in a graphical format. Normal menstrual cycles and ovulation were confirmed by a gynecologist based on basal body temperature data analysis and luteinizing hormone surge was detected using a spe-cific urine test (DotestLHa, Rohto Co. Ltd, Osaka, Japan). All the subjects maintained body temperature measurements until the end of the study to confirm the stability of the cycle.
The menstrual cycle was divided into 5 phases: the menstrual phase, day 1 to 4 (menses);
the follicular phase, day 7 to 10; the ovulation (luteinizing hormone surge±1 day); the early
luteal phase (within 7 days of the post-luteinizing hormone surge); and the late luteal phase (after the early luteal phase until menses). The measurements were carried out on one day between the first and the last days of each phase, excluding the first day of the menstrual phase
(see the supplementary materialsS1 Fig,S1andS2Tables).
In healthy individuals, no exact T2-signal values have been defined for the description of edema, which is usually related to the extension of the interstitial space, deposition of intracel-lular or extracelintracel-lular water in various pathologies and is characterized by the increase of
T2-signal intensity [21–23] In our study, the T2 signal intensity analysis was based on the
method initially introduced by Bloch et al [24]. To identify the relationship between stages of
the menstrual cycle and water deposition in the lower limbs, we compared the intensity of the T2 signals in the calf twice a day over the 5 phases of the menstrual cycle with the parallel mea-surement of the calf circumference.
In the morning (7:00–8:00 AM) we analyzed body composition, took blood samples for hormone analysis, measured the T2 signal intensity in the calf, and measured the calf circum-ference. In the afternoon (2:00–4:00 PM), we measured the T2 signal intensity in the calf, the calf circumference, and tested athletic performance (static balance, vertical jumping ability,
agility, and muscle strength in ankle isometric flexion and dorsal flexion [Fig 1]). One week
random order—the first phase of the measurement of each participant being randomized to prevent habituation effect.
Measurements
The basal body temperature was measured orally using digital thermometers (CTEB503L, CITIZEN Co, Ltd., Tokyo, Japan). A digital height meter (AD-6227, A&D Co., Ltd., Tokyo, Japan) and a body composition analyzer (Inody770, Inbody Japan, Inc., Tokyo, Japan) were used to obtain the anthropometric data on 30 indexes, including height, weight, body fat mass and volume, body water volume, lean body mass, and body mass index (BMI). Serum estradiol and serum progesterone concentrations were measured using Chemiluminescence Enzyme Immunoassay (CLEIA) and serum aldosterone concentration was measured using Radioim-munoassay (RIA).
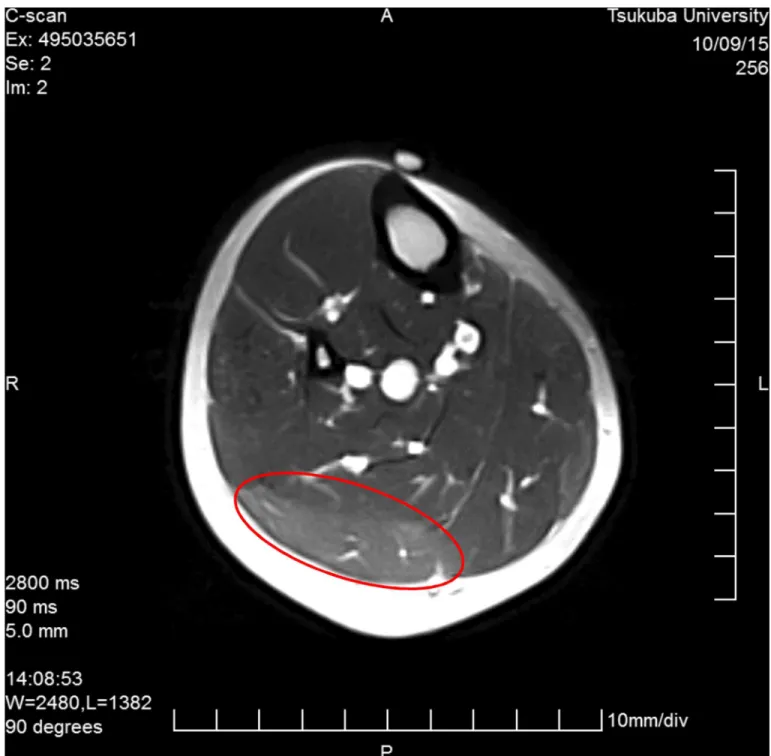
The maximum calf circumference out of 3 measurements in the dominant leg was recorded. The position of the measurement was decided on the first day and marked at a cer-tain distance from the popliteal fossa for each individual. The T2 signal on MRI (Esaote, Inc., Napoli, Italy) was analyzed at the position of the calf’s maximum circumference. For the assessment of fluid retention, we calculated the T2 signal and the cross-sectional area of the
lat-eral gastrocnemius (Fig 2).
The intensity of the participants’ physical activities was tracked using an activity tracker (Polar Loop, Polar Electro, Inc., Kempele, Finland) that participants wore 1 week prior to mak-ing the initial measurements through to the end of the study. Avoidance of strenuous activity was thus confirmed. We analyzed the physical activity data in 24-hour sections for every day of the 5-week study, dividing the amount of activity into 5 different degrees of exercise intensity: resting, sitting, low-, moderate-, and high-level of intensity. Additionally, we evaluated the number of steps (average step number in each phase per day) and energy expenditure (average energy expenditure in each phase per day).
Static balance ability was measured using the amplifier built-in force plate (Kistler 9286BA, Kistler Co., Ltd., Winterthur, Switzerland). Data were collected for 30 seconds, with a sampling frequency of 100 Hz and we calculated the body sway from the center-of-pressure (COP). The participants had to close their eyes, cross their arms on their chest, slightly bend their hip and knee joints and keep their balance on their dominant leg for 30 seconds. The participants prac-ticed keeping their balance for 10 seconds 3 times before every successive measurement. If the foot of the dominant leg moved laterally or if the participants opened their eyes, or their arms detached from the chest, or the nondominant leg was used to keep their balance during the measurement, they failed the test.
The static balance ability index was assigned as the “outer peripheral area” (cm2) tracing the
marginal most distant balance maintaining movements, and the area of sway (rectangular)
(cm2) limited by the farthest points of the individual balance maintaining body movements
Fig 1. Flow of the measurements in each phase of the day.
(Fig 3). Additional parameters used in the analysis were the sway area (mean circle) (cm2), the total locus length of the line tracing COP (cm), the total movement unit length, or the locus
length per second (cm/sec), and the locus length per unit area (cm/cm2).
Agility was assessed using a side-step exercise, approved by the Japanese Ministry of Educa-tion Science and Technology (MEXT) as a new physical fitness test for people aged 20 to 64
[25]. In this exercise, 3 tape bands are stuck on a flat floor at 1-meter intervals. From a central
starting position, the participants have 20 seconds in which to step, as many times as they can,
Fig 2. T2 signal and lateral cross-section area of the lateral gastrocnemius.
alternately on or over the outer bands, returning to the center each time. Jumping is not allowed. If the participant steps on or over the band, it is counted as 1. If the participant fails to reach the outer band, it is counted as 0. The test is repeated 2 times for 20 seconds with a rest-ing time of 5 minutes. We recorded the best result of the 2 tests for each individual, accordrest-ing to MEXT recommendations.
Vertical jumping height was measured using a digital vertical jump assessment device (Jump-MD, T.K.K 5406, Takei Scientific Instruments Co., Ltd., Niigata, Japan). The testing belt was tightly secured around the waist and the participants were told to jump as high as pos-sible. The principle of the vertical jumping height test is similar to that of the agility test, albeit in different planes; with agility the movement is horizontal and in jumping it is vertical. The vertical jumping test was repeated twice each time, and the best result was recorded.
Ankle flexion-extension muscle strength in the dominant leg was measured by the BIODEX System 4 (Biodex Medical Systems Inc., New York, USA). Participants were in a sitting posi-tion, with their hip and the knee joints bent 90 degrees with no flexion nor extension and feet resting on a fixation plate. The thigh and the trunk of the body were immobilized with a belt and the arms were crossed at the chest. Muscle strength was evaluated by measuring the pres-sure on the fixation plate, at 5 seconds for flexion and 5 seconds for extension, with a 20-sec-ond rest between them. The average value from tests 2, 3, and 4, out of 5 sets, was recorded. The ankle flexion-extension test is of a different principle, where the muscle strength is evalu-ated and, as in previous reports where the average values of the muscle strength in different
body parts was analyzed, we also followed this common principle [26,27]. The first and the last
tests were excluded, as the individuals were not familiar with such tests in their everyday life and could avoid pressing the plate with 100% of their muscle strength in test 1 and could develop fatigue in test 5, unduly influencing the overall test results.
Statistical analysis
We used SPSS version 22.0 (SPSS Inc, Chicago, IL, USA) and the repeated measures analysis of variance (RMANOVA) to evaluate differences between measured variables and correlation analysis to investigate the relationship between the T2 signal and athletic performance indexes in each of the 5 phases. All variables in the Results section were first confirmed by RMANOVA and then the post hoc tests were carried out. We performed the Bonferroni post hoc test to
Fig 3. Outer peripheral area (A, cm2) and rectangular area of sway (B, cm2). Scale bar: 1 cm.
assess the differences among the 5 phases in each measurement. Data presented represent
means±SE.P<0.05 was considered as statistically significant.
Results
Body composition and physical activity
Neither main effects nor significant changes were observed in body composition, amount of physical activity, steps, and energy expenditure over the 5 phases, suggesting that participants did not have any high intensity activities that could induce edema.
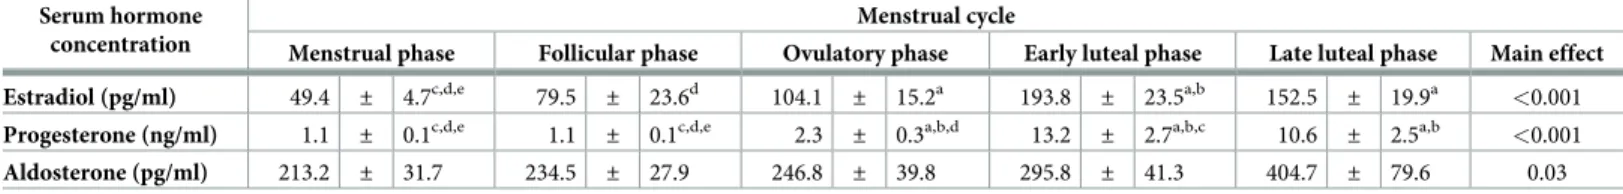
Serum hormones concentration
The highest levels of serum estradiol and progesterone were recorded in the early luteal phase. Serum estradiol levels decreased significantly in the menstrual phase and the follicular phase
compared to the early luteal phase (P= 0.001, P = 0.024 respectively). Additionally, the
men-strual phase estradiol level was significantly lower compared to the ovulatory phase
(P= 0.015), and the late luteal phase (P= 0.003). The serum progesterone level decreased
sig-nificantly in the menstrual phase and the follicular phase compared to the ovulatory phase
(P= 0.012, P = 0.009 respectively), the early luteal phase (both P = 0.007), and the late luteal
phase (P= 0.028, P = 0.029 respectively), and it also decreased significantly in the ovulatory
phase compared to the early luteal phase (P= 0.010). Although a main effect was observed in
the serum aldosterone level and showed the highest values in the late luteal phase, there was no
significant difference over the 5 phases (Table 1).
Fluid retention in the calf
There were no significant differences in the calf circumference and the cross-sectional area of the lateral gastrocnemius in the morning (AM) and afternoon (PM), and the difference
between AM and PM values over the 5 phases was also insignificant (Table 2). T2 signals were
significantly lower in the menstrual phase in the AM compared to the ovulatory phase
(P= 0.043) and were not significantly different compared to other phases. In PM, T2 signal
increased significantly in the menstrual phase compared to the follicular phase (P= 0.003),
ovulatory phase (P= 0.009), and the late luteal phase (P= 0.032), and the difference between
the AM and PM values increased significantly in the menstrual phase compared to the other 4
phases (P<0.01).
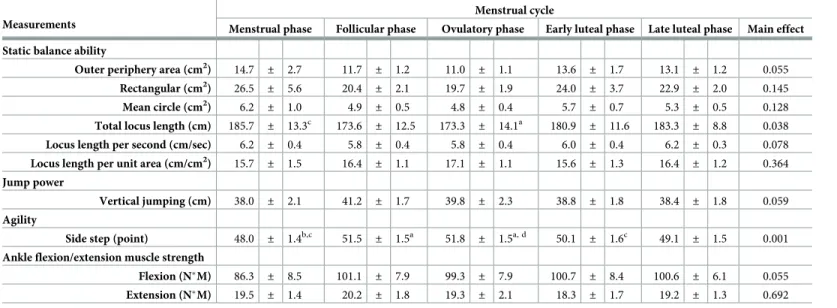
Athletic performance
Athletic performance data are shown in theTable 3. The total locus length increased
signifi-cantly in the menstrual phase compared to the ovulatory phase (P= 0.009). Other indexes of
Table 1. Hormone levels in blood over the 5 phases. Serum hormone
concentration
Menstrual cycle
Menstrual phase Follicular phase Ovulatory phase Early luteal phase Late luteal phase Main effect Estradiol (pg/ml) 49.4 ± 4.7c,d,e 79.5 ± 23.6d 104.1 ± 15.2a 193.8 ± 23.5a,b 152.5 ± 19.9a <0.001
Progesterone (ng/ml) 1.1 ± 0.1c,d,e 1.1 ± 0.1c,d,e 2.3 ± 0.3a,b,d 13.2 ± 2.7a,b,c 10.6 ± 2.5a,b <0.001
Aldosterone (pg/ml) 213.2 ± 31.7 234.5 ± 27.9 246.8 ± 39.8 295.8 ± 41.3 404.7 ± 79.6 0.03
The data represent means±SEs,P<0.05 in a)vs. menstrual phase, b)vs. follicular phase, c)vs. ovulatory phase, d)vs. early luteal phase, e)vs. late luteal phase.
The individual estradiol and progesterone concentrations for each participant are provided inS3 Tablein the supplementary materials.
static balance ability (outer peripheral area, rectangular area, mean circle area, locus length per second, and the locus length per unit area), as well as vertical jumping ability and ankle flex-ion-extension muscle strength, did not change significantly over the 5 phases.
In the side step, the results showed a significant decrease during the menstrual phase
com-pared to the follicular phase (P= 0.003) and the ovulatory phase (P= 0.009). The highest score
was recorded in the ovulatory phase. The values significantly decreased in the early-luteal
phase compared to the ovulatory phase (P= 0.039), though there was no significant difference
between the menstrual phase and the early-luteal phase. Additionally, we found a negative cor-relation between the T2 signal changes in the AM and PM and the side step values (corcor-relation
coefficient = -0.546,P= 0.025).
Table 2. Assessment of fluid retention in the calf.
Measurements Menstrual cycle
Menstrual phase Follicular phase Ovulatory phase Early luteal phase Late luteal phase Main effect Calf circumference (cm)
AM 34.8 ± 0.5 34.6 ± 0.4 34.6 ± 0.5 34.6 ± 0.4 34.7 ± 0.4 0.703
PM 34.8 ± 0.5 34.6 ± 0.4 34.6 ± 0.5 34.6 ± 0.4 34.7 ± 0.4 0.295
AM-PM differ 0.3 ± 0.1 0.2 ± 0.1 0.1 ± 0.1 0.3 ± 0.1 0.2 ± 0.1 0.657
T2 signal
AM 997.7 ± 28.2a 1105.8 ± 24.0 1107.3 ± 25.4c 1105.1 ± 30.3 1052.3 ± 29.3 0.013
PM 1239.8 ± 35.8b,c,e 1049.7 ± 38.0a 1069.5 ± 32.2a 1137.6 ± 27.6 1136.7 ± 34.0a 0.001
AM-PM differ 242.1 ± 35.8b,c,d,e -56.2 ± 40.1a -37.8 ± 23.9a 32.5 ± 35.2a 84.4 ± 34.2a <0.001
Cross-sectional area (mm2)
AM 495.4 ± 36.3 472.0 ± 33.2 466.9 ± 29.4 481.6 ± 34.5 494.8 ± 31.1 0.342
PM 466.3 ± 32.0 480.6 ± 31.4 501.3 ± 37.4 478.2 ± 29.8 503.4 ± 27.2 0.241
AM-PM differ -29.2 ± 19.1 8.0 ± 20.7 34.4 ± 21.6 -3.4 ± 16.4 8.6 ± 14.1 0.193
The data represent means±SEs,P<0.05 in a)vs. menstrual phase, b)vs. follicular phase, c)vs. ovulatory phase, d)vs. early luteal phase, e)vs. late luteal phase.
https://doi.org/10.1371/journal.pone.0191022.t002
Table 3. Variations in the athletic performance indexes over the menstrual cycle.
Measurements
Menstrual cycle
Menstrual phase Follicular phase Ovulatory phase Early luteal phase Late luteal phase Main effect Static balance ability
Outer periphery area (cm2) 14.7 ± 2.7 11.7 ± 1.2 11.0 ± 1.1 13.6 ± 1.7 13.1 ± 1.2 0.055
Rectangular (cm2) 26.5
± 5.6 20.4 ± 2.1 19.7 ± 1.9 24.0 ± 3.7 22.9 ± 2.0 0.145
Mean circle (cm2) 6.2 ± 1.0 4.9 ± 0.5 4.8 ± 0.4 5.7 ± 0.7 5.3 ± 0.5 0.128
Total locus length (cm) 185.7 ± 13.3c 173.6 ± 12.5 173.3 ± 14.1a 180.9 ± 11.6 183.3 ± 8.8 0.038
Locus length per second (cm/sec) 6.2 ± 0.4 5.8 ± 0.4 5.8 ± 0.4 6.0 ± 0.4 6.2 ± 0.3 0.078
Locus length per unit area (cm/cm2) 15.7
± 1.5 16.4 ± 1.1 17.1 ± 1.1 15.6 ± 1.3 16.4 ± 1.2 0.364
Jump power
Vertical jumping (cm) 38.0 ± 2.1 41.2 ± 1.7 39.8 ± 2.3 38.8 ± 1.8 38.4 ± 1.8 0.059
Agility
Side step (point) 48.0 ± 1.4b,c 51.5
± 1.5a 51.8
± 1.5a, d 50.1
± 1.6c 49.1
± 1.5 0.001
Ankle flexion/extension muscle strength
Flexion (NM) 86.3 ± 8.5 101.1 ± 7.9 99.3 ± 7.9 100.7 ± 8.4 100.6 ± 6.1 0.055
Extension (NM) 19.5 ± 1.4 20.2 ± 1.8 19.3 ± 2.1 18.3 ± 1.7 19.2 ± 1.3 0.692
The data represent means±SEs,P<0.05 in a)vs. menstrual phase, b)vs. follicular phase, c)vs. ovulatory phase, d)vs. early luteal phase.
Discussion
Body composition and physical activity
Our results are in line with previous studies, which have reported that there is no significant difference in body composition over the menstrual cycle in participants who have normal
physical activity level [28–30]. Thus, in our study, neither physical activity nor illness affected
fluid retention in the calf and any significant differences could only be attributed to menstrual cycle influence.
Serum hormones and fluid retention
Our results suggest that fluid retention and the difference between the AM and PM values are more prominent in the menstrual phase. Furthermore, the variations between the AM and PM regarding the fluid component increase gradually from the late luteal phase to the menstrual phase and then gradually decrease after the menstrual phase and continue to the follicular phase, showing less fluid variations in the ovulatory phase.
In previous reports, edema was assessed by measuring calf circumference or by subjective
evaluation [31,32]. In these reports, fluid retention, assessed using a subjective scale, peaked on
the first day of menstruation [33,34], which agrees with our results. Our findings also support
the suggestion that the edema could be the result of a delayed response to the previous higher
hormone levels [34]. The reason for this still remains unclear, however, the increase in the
serum hormone levels and the appearance of the edema with the 3–4 days delay is obvious. Although participants of the present study did not complain of any typical PMS symptoms, the results show that fluid retention increased significantly during the menstrual phase. Thus, we found that edema occurred regardless of subjective symptoms. Furthermore, T2 signal changes during the menstrual cycle showed fluid retention when the levels of estrogen, proges-terone, and aldosterone were the lowest, which contradicts the main theory of premenstrual edema.
A decrease in physical activity level may be a reason for the occurrence of edema. Although, during the present study, there was no significant difference in the physical activity level over the menstrual cycle, there is a possibility that participants may unconsciously have a decrease in physical activity level due to menstruation. Saito et al reported that over 60% of the female participants in their study complained of lethargy during menstruation and over 40%
answered that they became depressed [35]. In our study, we collected data on specific
symp-toms (PMS) over the menstrual cycle without assessing the mood component. Nevertheless, it is possible that related mechanisms somehow influence both mood and fluid retention during the menstrual phase.
Athletic performance
Hayashi et al reported that static balance ability decreased significantly in the menstrual, early-luteal, and late-luteal phases compared to the follicular phase and the locus length per second
decreased significantly in the late-luteal phase [36], suggesting the secretion of estradiol and
progesterone as a possible cause. These hormones are also reported to have a central nervous
system effect, potentially affecting posture control indirectly [37–39]. In the present study,
Giacomoni et al showed that jumping power decreased significantly in the menstrual phase
in athletes using the multi-drop jump and the squat jump [40]. We did not use these tests, as
they carry some risk of injury for non-athletes. However, even with a digital vertical jump assessment device it was quite difficult for participants to jump accurately and vertical jumping could also depend on arm movement much more than lower extremity mechanical power
[41], which could account for our results.
Lebrun et al reported that the best agility performance was generally recorded in the first postmenstrual days, with the worst performance during the premenstrual interval and the first
few days of the menstrual flow, which agrees with our results [18]. Hashimoto et al assessed
agility in female handball players and reported that the agility was lowest in the menstrual
phase and best in the follicular phase [42]. However, the 25m shuttle run they used needed
technical skills and no measurements were done in the ovulatory, early-luteal, and late-luteal phases. In Japan, the side step exercise is generally used in physical education classes to assess agility and was familiar to the participants of our study and they had a practice session before the measurement. Therefore, we suggest that the results of our agility test were influenced only by the menstrual cycle itself.
Some previous reports have shown a relationship between muscle strength in the legs and the menstrual cycle in athletes, in which muscle strength increased mostly during the follicular
phase [26,27,43,44]. Our results are in line with the study by Jonge et al, who found no
signifi-cant difference in knee flexion-extension muscle strength (isokinetic) over the menstrual cycle
in women with normal physical activity level [45]. Thus, we suggest that the difference in the
physical activity level in participants (athletes versus non-athletes) may lead to a difference in muscle strength over the menstrual cycle.
Our objective study was the first to investigate that body fluid accumulation varies over the 5 menstrual phases in spite of the lack of subjective feelings of swelling. Although there was no significant correlation between the results in the MRI T2 signal and the ovarian hormone lev-els, there was a significant difference over the 5 phases in diurnal body fluid variation which was evaluated by the MRI T2 signal. We speculate that fluid accumulation occurrences are directly or indirectly affected by the ovarian hormones and may negatively influence both ath-letic performance ability (especially agility which was assessed by the side-step in our study) and musculoskeletal treatment of injuries in the clinical setting. Although our study was, for practical purposes, restricted to the gastrocnemius, evaluation of hormonal effect on fluid retention within muscle tissue is highly important clinical knowledge because there could be implications in treating muscular injuries that may be overlooked by subjective examination. That is to say, even if the patient is not aware of edema, the physician can ask about menstrual status and will now have objective measuring tools to check for any edema that could affect
subsequent clinical treatment options [46].
moment is a first step in accumulating base-line data for further investigation of the phenome-non in athletes.
Conclusion
Fluid retention in the legs (T2 signal intensity) increased significantly during the menstrual phase in the afternoon, and occurred regardless of subjective symptoms. Side-step ability showed a significant decrease during the menstrual phase and had a negative correlation with fluid retention (T2 signal intensity) in the legs. These might be factors that negatively influence the physical performance of women and should be considered in further sports-related studies.
Supporting information
S1 Fig. Measurement days within early luteal (EL) and late luteal (LL) phases (Example Subject A).The measurements were carried out on one day between the first and the last days of each phase, excluding the first day of the menstrual phase.
(TIF)
S1 Table. The day of the test counted from the first day of the menstruation in each partic-ipant (n = 13).
(XLSX)
S2 Table. The length of the cycle/luteal phase and measurement days in early luteal (EL) and late luteal (LL) phases in all subjects.
(XLSX)
S3 Table. The individual estradiol and progesterone concentrations for each participant in each phase of the menstrual cycle.
(XLSX)
Acknowledgments
We express our gratitude to the participants for their participation over the months of this study. We also thank Thomas Mayers for native English revision.
Author Contributions
Conceptualization:Akemi Sawai, Koichi Watanabe.
Data curation:Akemi Sawai, Yuriko Tochigi, Nadzeya Kavaliova, Alexander Zaboronok, Yuki Warashina.
Formal analysis:Akemi Sawai, Yuki Warashina.
Investigation:Akemi Sawai, Yuriko Tochigi.
Methodology:Akemi Sawai, Noboru Mesaki, Hitoshi Shiraki, Koichi Watanabe.
Project administration:Hitoshi Shiraki, Koichi Watanabe.
Resources:Hitoshi Shiraki, Koichi Watanabe.
Supervision:Koichi Watanabe.
Visualization:Akemi Sawai, Alexander Zaboronok.
Writing – original draft:Akemi Sawai, Nadzeya Kavaliova, Alexander Zaboronok, Bryan J. Mathis, Noboru Mesaki, Hitoshi Shiraki, Koichi Watanabe.
Writing – review & editing:Akemi Sawai, Nadzeya Kavaliova, Alexander Zaboronok, Bryan J. Mathis, Noboru Mesaki, Hitoshi Shiraki, Koichi Watanabe.
References
1. The International Olympic Committee. Factsheet. The Games of the Olympiad. Update-March 2016.
www.olympic.org/factsheets-and-reference-documents/olympic-summer-games(29 March 2016) 2. Nakamura M. [Female athletes conditioning evaluation]. Japanese Journal of Clinical Sports Medicine
2012; 20:252–255.
3. Takeda T, Imoto Y, Nagasawa H, Muroya M, Shiina M. Premenstrual syndrome and premenstrual dys-phoric disorder in Japanese collegiate athletes. J Pediatr Adolesc Gynecol. 2015; 28:215–218.https:// doi.org/10.1016/j.jpag.2014.07.006PMID:26028154
4. Japan Institute of Sports Sciences. [Handbook for female athlete conditioning]. 2013.
5. Direkvand-Moghadam A, Sayehmiri K, Delpisheh A, Kaikhavandi S. Epidemiology of premenstrual syn-drome (PMS)—a systematic review and meta-analysis study. J Clin Diagn Res 2014; 8:106–109.
https://doi.org/10.7860/JCDR/2014/8024.4021PMID:24701496
6. Tacani PM, Ribeiro Dde O, Barros Guimarães BE, Machado AF, Tacani RE. Characterization of symp-toms and edema distribution in premenstrual syndrome. Int J Womens Health. 2015; 11:297–303. 7. Rasheed P, Al-Sowielem LS. Prevalence and pre-dictors of premenstrual syndrome among
college-aged women in Saudi Arabia. Ann Saudi Med. 2003; 23:381–387. PMID:16868373
8. Rezaeian N. Comparison of prevalence of premenstrual syndrome in athlete and non-athlete students. International Journal of Public Health Research 2015; 3: 234–238.
9. Fekr LZ, Zadeh TA, Moghadam JB, Salehian MH. Comparison of disorders menstrual frequency between female athlete and non-athlete university students. Euro J Exp Bio 2012; 2:944–947. 10. Tulin A. Menstrual syndrome comparison of athletes and non-athletes. Health Med, 2012; 6:3035–
3042.
11. Czajkowska M, Drosdzol-Cop A, Gałązka I, Naworska B, Skrzypulec-Plinta V. Menstrual cycle and the prevalence of premenstrual syndrome/premenstrual dysphoric disorder in adolescent athletes. J Pediatr Adolesc Gynecol. 2015; 28:492–498.https://doi.org/10.1016/j.jpag.2015.02.113PMID:
26233292
12. Hessemer V, Bruck K. Influence of menstrual cycle on shivering, skin blood flow, and sweating responses measured at night. J Appl Physiol 1985; 59:1902–1910.https://doi.org/10.1152/jappl.1985. 59.6.1902PMID:4077797
13. Hessemer V, Bruck K. Influence of menstrual cycle on thermoregulatory, metabolic, and heart rate responses to exercise at night. J Appl Physiol 1985; 59:1911–1917.https://doi.org/10.1152/jappl.1985. 59.6.1911PMID:4077798
14. Stachenfeld NS, Taylor HS. Effects of estrogen and progesterone administration on extracellular fluid. J Appl Physiol 2004; 96:1011–1018.https://doi.org/10.1152/japplphysiol.01032.2003PMID:14660504
15. Stachenfeld NS. Sex hormone effects on body fluid regulation. Exerc Sport Sci Rev 2008; 36:152–159.
https://doi.org/10.1097/JES.0b013e31817be928PMID:18580296
16. Bonen A, Ling WY, Maclntyre KP, Neil R, McGrail JC, Belcastro AN. Effects of exercise on the serum concentrations of FSH, LH, progesterone, and estradiol. Eur J Appl Physiol Occup Physiol 1979; 42:15–23. PMID:499193
17. Jurkowski JE, Jones NL, Walker C, Younglai EV, Sutton JR.Ovarian hormonal responses to exercise. J Appl Physiol 1978; 44:109–114.https://doi.org/10.1152/jappl.1978.44.1.109PMID:627490
18. Lebrun CM. Effect of the different phases of the menstrual cycle and oral contraceptives on athletic per-formance. Sports Med 1993; 16:400–430. PMID:8303141
19. Bale P, Nelson G. The effects of menstruation on performance of swimmers. Aust J Sci Med Sport 1985; 17:19–22.
21. May DA, Disler DG, Jones EA, Balkissoon AA, Manaster BJ. Abnormal signal intensity in skeletal mus-cle at MR Imaging: patterns, pearls, and pitfals. Radiographics 2000; 20:S295–S315https://doi.org/10. 1148/radiographics.20.suppl_1.g00oc18s295PMID:11046180
22. Sica DA. Calcium channel blocker related peripheral edema: can it be resolved? J Clin Hypertens 2003; 5:291–294, 297.
23. Cho S, Atwood JE. Peripheral edema. Am J Med 2002; 113:580–586. PMID:12459405
24. Bloch F. Nuclear induction. Phys rev 1946; 70:460–474.
25. The Ministry of Education, Culture, Sports, Science and Technology of Japan (MEXT). Physical fitness and motor skills test. 1999.www.mext.go.jp/a_menu/sports/stamina/03040901.htm(31 May 2017) 26. Phillips SK, Sanderson AG, Birch K, Bruce SA, Woledge RC. Changes in maximal voluntary force of
human adductor pollicis muscle during the menstrual cycle. J Physiol 1996; 496:551–557. PMID:8910237
27. Sarwar R, Niclos BB, Rutherford OM. Changes in muscle strength, relaxation rate and fatiguability dur-ing the human menstrual cycle. J Physiol 1996; 493:267–272. PMID:8735711
28. Janse de Jonge XA. No effect of menstrual cycle on exercise performance. Sports Med 2003; 33:833– 51. PMID:12959622
29. Vaiksaar S, Ju¨rima¨e J, Ma¨estu J, Purge P, Kalytka S, Shakhlina L, Ju¨rima¨e T. No effect of menstrual cycle phase and oral contraceptive use on endurance performance in rowers. J Strength Cond Res 2011; 25:1571–1578.https://doi.org/10.1519/JSC.0b013e3181df7fd2PMID:21399539
30. Vaiksaar S, Ju¨rima¨e J, Ma¨estu J, Purge P, Kalytka S, Shakhlina L, Ju¨rima¨e T. No effect of menstrual cycle phase on fuel oxidation during exercise in rowers. Eur J Appl Physiol 2011; 111:1027–34.https:// doi.org/10.1007/s00421-010-1730-1PMID:21088972
31. Young SL, Ohno S, Fkuda A. The seasonal, menstrual and daily changes of lower leg surface areas and lower leg volumes in the women. Journal of Home Economics of Japan 1987; 38.3:205–212. 32. Sudo M, Chiba A, Ueno K, Yada Y, Akataki K, Takesada M, Ito Y, Mita K. Relation with swelling and
muscle fatigue on lower leg. Japanese Journal of Physical Anthropology 2010; 15:21–26.
33. Taylor JW. The timing of menstruation-related symptoms assessed by a daily symptom rating scale. Acta Psychiatr Scand 1979; 60:87–105. PMID:573049
34. White CP, Hitchcock CL, Vigna YM, Prior JC. Fluid retention over the menstrual cycle: 1-year data from the prospective ovulation cohort. Obstet Gynecol Int 2011; 2011:138451.https://doi.org/10.1155/2011/ 138451PMID:21845193
35. Saito C, Nishiwaki M. Relationship Between Menstruation Pattern and Premenstrual and Menstrual Dis-comfort Symptoms, and Coping Method. Yamagata Journal of Health Sciences 2005; 8:53–63. 36. Hayashi C, Ikeda M, Aizawa K, Murai F, Mesaki N. Change in dynamic and static balance ability during
menstrual cycle among young women. The Japanese Journal of Physical Fitness and Sports Medicine 2004; 53:197–203.
37. Lebrun CM. The effect of the phase of the menstrual cycle and the birth control pill in athletic perfor-mance. Clin Sports Med 1994; 13:419–441. PMID:8013042
38. Woolley CS. Effects of estrogen in CNS. Curr Opin Neurobiol 1999; 9:349–354. PMID:10395567
39. Posthuma BW, Bass MJ, Bull SB, Nisker JA. Detecting change in functional ability in women with pre-menstrual syndrome. Am J Obstet Gynecol 1987; 156:275–278. PMID:3826160
40. Giacomoni M, Bernard T, Gavarry O, Altare S, Falgairette G. Influence of the menstrual cycle phase and menstrual symptoms on maximal anaerobic performance. Med Sci Sports Exerc 2000; 32:486– 492. PMID:10694136
41. Shetty AB, Etnyre BR. Contribution of arm movement to the force components of a maximum vertical jump. J Orthop Sports Phys Ther 1989; 11:198–201. PMID:18796913
42. Hashimoto Y, Mesaki N. Athletic Performance in menstrual cycles of female handball players. Journal of Japanese Society of Psychosomatic Obstetrics and Gynecology 2001; 6:108–115.
43. Petrofsky JS, LeDonne DM, Rinehart JS, Lind AR. Isometric strength and endurance during the men-strual cycle. Eur J Appl Physiol Occup Physiol 1976; 35:1–10. PMID:1253779
44. Elliott KJ, Cable NT, Reilly T, Diver MJ. Effect of menstrual cycle phase on the concentration of bioavail-able 17-beta oestradiol and testosterone and muscle strength. Clin Sci 2003; 105:663–669.https://doi. org/10.1042/CS20020360PMID:12848619
45. Jonge XAK, Boot CR, Thom JM, Ruell PA, Thompson MW. The influence of menstrual cycle phase on skeletal muscle contractile characteristics in humans. J Physiol 2001; 530:161–166.https://doi.org/10. 1111/j.1469-7793.2001.0161m.xPMID:11136868