Administration Manual for the Japanese Version of Sixteen Personality Factor Questionnaire 5
thEdition
Naotaka Watanabe, Tomoko Ito, and Toyoaki Nishida
Abstract
This manual has been prepared for users of the Japanese version of Sixteen Personality Factor Questionnaire 5th Edition (16PF5). It provides comprehensive information about the process of administering, scoring and interpreting the 16PF5 questionnaire. Users are highly recommended to refer the technical article, “Development of a Culturally and Linguistically Equivalent Personality Test”, which was published by the authors of this paper (Watanabe, Ito and Nishida, 2017) .
Keywords
Introduction
The 16PF questionnaire was originally published in 1949 by Raymond Cattell following an extensive series of factor analytical explorations into the adult personality structure. Cattell’s initial exploration reduced a list of thousands of descriptive adjectives to sixteen elemental personality traits (Cattell, 1945). Such research is distinguished by (1) attempting to cover the domain of human personality through human language, and (2) a commitment to factor analytic methods for the discovery of the elemental units of personality.
In 1988 a six-year project was begun in the US to improve the questionnaire (which had evolved into five different adult forms and numerous forms intended for children and adolescents). This Fifth Edition of the 16PF questionnaire involved an initial pool of over 750 questions (items) and the participation of 6,220 pilot testing participants in four iterative studies.
The standardization form, which contained about fourteen items per factor, was administered to a representative US sample. Final item selection was conducted so that (1) items had higher correlations with their own scale than those with the other scales, (2) items maximized internal consistency estimates (ie.
scale reliabilities), and (3) scales had similar correlations for men and women.
Numerous 16PF5 translations are used widely across the world, but had not previously been available in Japanese. To enable the Japanese-speaking community to use this tool, the 16PF5 questionnaire had to be
Administration Manual, Personality Test, Japanese 16PF5, Scoring, Interpretation
put through a thorough translation process.
The project to translate and adapt the 16PF5 into Japanese language started in October 2001, when the Test Development Agreement between IPAT(The Institute for Personality and Ability Testing) and Naotaka Watanabe, one of the authors of this paper, was signed-up at Champaign, Illinois. After IPAT had been merged to OPP (Oxford Psychologist Press), an amendment was made between the author, Naotaka Watanabe, and OPP in July 2004. (Watanabe and Nishida, 2003,2004 ).
All the test development procedures were based on IPAT’s “Standards for Test Translations” in principle (Watanabe and Nishida,2003&2004; Watanabe,Ito,and Nishida,2017) Some parts of the procedures, however, did not necessarily meet the standard, due to the Japanese corporates’ policies which had provided the research fields to the authors. Since the Japanese 16PF5 questionnaire is also a broad measure of normal personality, it can be used in a variety of settings (clinical/counselling, occupational and research) to measure a wide range of life behaviors.
Administration and scoring
The 16PF5 instrument is designed to be administered to adults (aged sixteen years and older), individually or in a group setting. Whether the questionnaire is appropriate for an individual younger than sixteen is a decision that should be based on professional consideration of the client’s maturity level.
Scoring steps
The 16PF instrument is scored in a number of iterative steps, as follows:
Step 1: Scoring the Primary Factors
The 16PF5 questions have a three-choice response format. Each item response has a 2, 1, or 0 score.
Except for the Factor B items, the middle response choice is always a question mark (?). The Factor B items, which assess reasoning ability, are grouped together at the end of the questionnaire following the personality items.
The total raw score of the items in a scale is obtained by adding the score for each individual item that belongs to that scale.
Step 2: Conversion of raw scores to sten scores (standard ten scores)
The raw scores are then converted to sten scores. Raw scores are converted into standardized (sten) scores by using norm tables, such as combined sex, male or female norm tables. Stens are based on a 10-point scale with a mean of 5.5 and a standard deviation of 2.
Step 3: Calculation of global factor sten scores
This step involves calculating sten scores for the five global factors of personality: Extraversion, Anxiety, Tough-Mindedness, Independence and Self-Control. Since these global factors comprise combinations of
related primary factors, they describe personality in broader, more general terms than the primary factors.
The scoring process for the Response Style Indices will be described later.
Interpretation of the result of scoring
The evolution of the 16PF instrument has reflected Cattell’s use of the factor-analytic approach in identifying the basic structure of human personality. Understanding this method of test development as the theoretical base of the 16PF5 tool aids in using the test. This manual helps to build a foundation for this understanding as do other resource books on the history and applications of the 16PF tool. Professionals may want to consult these for information regarding the original development of the factors, relevant research and interpretive findings.
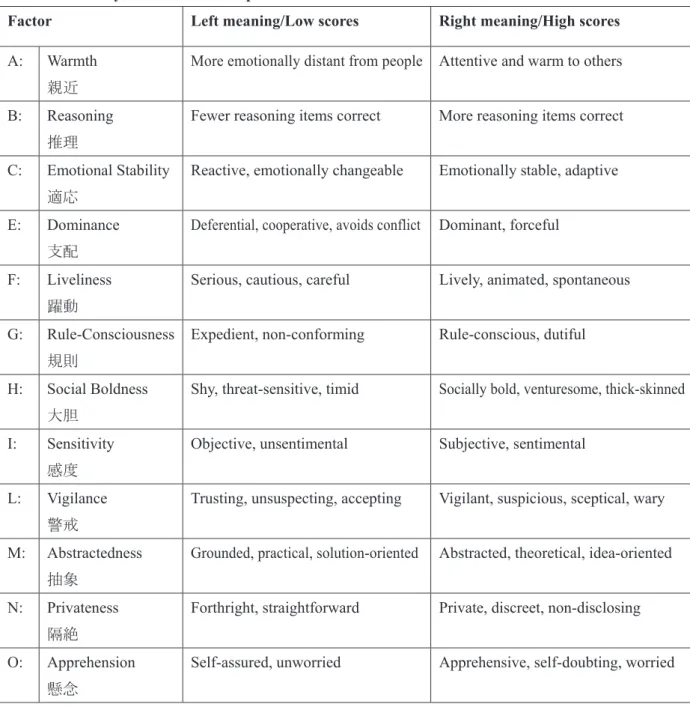
Table 1: Primary factor scale descriptors
Factor Left meaning/Low scores Right meaning/High scores A: Warmth
親近
More emotionally distant from people Attentive and warm to others
B: Reasoning 推理
Fewer reasoning items correct More reasoning items correct
C: Emotional Stability 適応
Reactive, emotionally changeable Emotionally stable, adaptive
E: Dominance 支配
Deferential, cooperative, avoids conflict Dominant, forceful
F: Liveliness 躍動
Serious, cautious, careful Lively, animated, spontaneous
G: Rule-Consciousness 規則
Expedient, non-conforming Rule-conscious, dutiful
H: Social Boldness 大胆
Shy, threat-sensitive, timid Socially bold, venturesome, thick-skinned
I: Sensitivity 感度
Objective, unsentimental Subjective, sentimental
L: Vigilance 警戒
Trusting, unsuspecting, accepting Vigilant, suspicious, sceptical, wary
M: Abstractedness 抽象
Grounded, practical, solution-oriented Abstracted, theoretical, idea-oriented
N: Privateness 隔絶
Forthright, straightforward Private, discreet, non-disclosing
O: Apprehension 懸念
Self-assured, unworried Apprehensive, self-doubting, worried
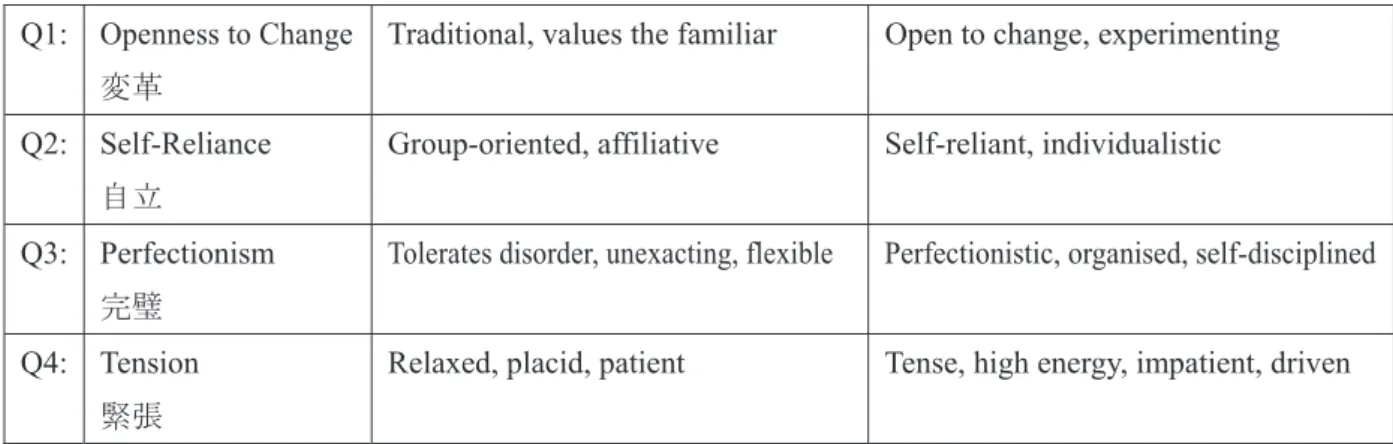
Q1: Openness to Change 変革
Traditional, values the familiar Open to change, experimenting
Q2: Self-Reliance 自立
Group-oriented, affiliative Self-reliant, individualistic
Q3: Perfectionism 完璧
Tolerates disorder, unexacting, flexible Perfectionistic, organised, self-disciplined
Q4: Tension 緊張
Relaxed, placid, patient Tense, high energy, impatient, driven
Historically, the basic scales of the 16PF questionnaire have been labelled with letters (for example, Factor A, Factor B, and so on, through to Factor Q4). The fifth edition continued the tradition of using factor letters and also provided ‘common-language’ names for each scale (see Table 1).
As shown in Table 1, the 16PF5 scales are bipolar in nature; that is, both high and low scores have meaning.
The right-side pole, or high-score range, of a factor is described as the plus (+) pole. The left-side pole, or low-score range, is the minus pole (–). For example, high scorers on Factor A are described as Warm (A+);
low scorers are described as Reserved (A–).
Generally, professionals should not assume that high scores are ‘good’ and that low scores are ‘bad’. For example, high scorers on Factor A tend to be warm interpersonally, whereas low scorers tend to be more reserved interpersonally. In some situations, being reserved might be quite fitting or useful. In other situations, being warm might be more suitable.
In addition to the primary scales, the 16PF5 tool contains a set of five scales that combine related primary scales into global factors of personality. (See Table 2). These global factors historically have been called
‘second-order factors’ in 16PF questionnaire literature and result from a factor analysis of the test’s primary scales.
Table 2: Global factor scale descriptors
Factor Left meaning Right meaning
EX: Extraversion 外向
Introverted, socially inhibited Extraverted, socially participating
AX: Anxiety 不安
Low anxiety, unperturbed High anxiety, perturbable
TM: Tough-Mindedness 意志
Receptive, open-minded Tough-minded, resolute
IN: Independence 独立
Accommodating, agreeable, selfless Independent, persuasive, wilful
SC: Self-Control 自制
Unrestrained, follows urges Self-controlled, inhibits urges
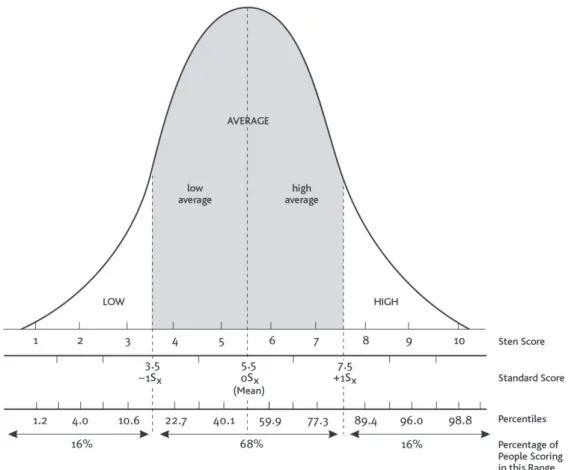
The 16PF tool uses ‘standard ten’ (sten) score scales. Sten scores range from 1–10, with a mean of 5.5 and a standard deviation of 2. Scores that fall further from the mean (either in the high or the low direction) are considered more extreme. The more extreme a score is towards a given factor pole, the more likely that the descriptors for the scale’s pole will apply for that score and that the trait will be apparent in the respondent’s behavior.
Sten scores of 4–7 are considered to be within the average range; stens of 1–3, in the low range; and stens of 8–10, in the high range. (See Figure 1) A sten score of 4 is described as ‘low-average’, and a score of 7 as ‘high-average’.
In a sten distribution, most people are expected to score in the middle (theoretically, about 68 per cent obtain a score within plus-or-minus one standard deviation from the mean ie stens 4–7). About 16 per cent score at the low end, and another 16 per cent score at the high end. The exact percentages may vary somewhat, depending on the shape of the distribution for any given factor scale.
Professionals need to integrate an understanding of measurement limits when interpreting 16PF5 profiles.
Because the scales are short (between ten and fifteen items each), they necessarily are an estimate of a person’s true score on any given personality factor. Theoretically, a person’s true score falls, 68 per cent of the time, in a band of plus-or-minus one standard error unit. Most 16PF scales have a standard error of measurement (SEM) that is close to 1 sten score point.
Thus, 68 per cent of the time, the true score for a person falls within the score range of plus-or-minus 1 sten score point around his or her obtained score. That is, the true score for a sten score of 8 on a factor would be expected to fall, 68 per cent of the time, within a sten score range of 7–9. For a 95 per cent confidence interval, the score band expands to plus-or-minus two standard error units; that is, for a sten of 8, the true score falls, 95 per cent of the time, within a sten range of 6–10.
Professionals should be careful not to over-interpret sten score differences. This caution especially applies to interpreting scores at the extremes of the distribution where, in a few cases, a mere 2-point raw score difference (the answer to one item) can account for a 2-point sten score difference.
As mentioned previously, scores of 4 and 7 are termed ‘low-average’ and ‘high-average’, respectively.
Professionals should realize that a respondent’s true score might fall outside the average range because it is on the line between ‘average’ and ‘distinctive’ scores and because the scales are not perfect measures of traits. For example, a respondent’s sten of 4 might shift down a sten score point, thus falling outside the
average range, if he or she were to be retested. Similarly, scores of 3 and 8, which fall outside the average line but along the line between average or extreme, should not be over-interpreted as extreme because the true scores might actually fall in the average range.
Figure 1. Sten distribution
Interpretation of the profile
The recommended strategy for 16PF5 profile interpretation involves evaluating the following in the sequence indicated:
Step 1: Evaluate response style indices.
In general, response style indices are evaluated first as a check for atypical test-response styles. Information relating to the interpretation and the development of the response style indices is found at the end of this section.
Step 2: Evaluate global and primary factor scales.
Readers may recognize links between the 16PF5 global factors and the ‘big five’ model of personality that is discussed in personality literature. For each global factor, a set of primary scales ‘load on’ the global construct; that is, the scale set contributes to, or makes up, the global construct. Before examining the
specific global scale scores in a 16PF5 profile, testing professionals are encouraged to look at broad trends within the profile.
Step 2A: Evaluate number of extreme scores
As noted in prior explanations of the distribution, the extreme scores in a profile usually indicate a respondent’s most distinctive traits. Thus, the greater the number of extreme scores, the more distinctive the personality expression is likely to be. It is rare that a respondent would have extreme scores on four or all five global factors. Still, a respondent not having at least one extreme score is a rare occurrence.
Most profiles show extreme scores on three to seven primary scales. If the number of extremes is nine or more, the respondent is among only about 5 per cent of people whose profiles are this distinctive. If the number of extremes is below two, the respondent is among only about 5 per cent of people whose profiles are this flat.
Step 2B: Remember the primary factor scale relationships
With a knowledge of how certain scales are expected to intercorrelate, the testing professional can identify unexpected factor combinations, thus adding a richness beyond an evaluation that involves only a single factor at a time. When interpreting a global factor score, the testing professional should identify (1) contributing primary scale scores that are in the expected direction for the global factor, and (2) primary scale scores that are in the opposite direction. With a knowledge that certain scales are expected to contribute to a given global factor, the professional can begin to identify unusual factor combinations and can form hypotheses about possible ways that conflicting scores might be expressed in a respondent’s life.
For example, if a respondent is Extraverted and all the related primary scale scores are in the Extraverted direction, he or she probably moves towards other people in a consistent manner. On the other hand, if an examinee is Extraverted on some relevant primary scales and Introverted on others, he or she may experience conflict. That is, the examinee may be Extraverted in some situations, or ways, but not in others, or may be ambivalent about how to or whether to move towards others.
Another example involves an overall global Extraversion score that is low-average. Such a score can reflect various combinations of the primary scales since several primary scales contribute to the global factor score.
In general, primary factor scale scores that cluster on a given global factor tend to be consistent; that is, a person who scores in the Introverted direction on the global factor often tends to score in the Introverted direction on the primary factor scales that make up Introversion. However, it is not uncommon that one of the primary scale scores will be in the Extraverted direction, even when the person’s score on the global factor falls in the Introverted direction.
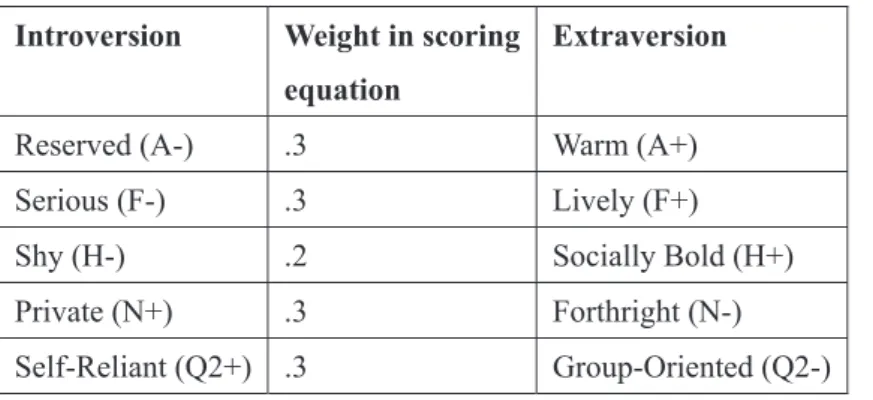
Each global factor is described in the next section in terms of the primary scales that contribute to it and its meaning. The pole of the bipolar primary scale that contributes to the global factor will be identified by a plus (+) or minus (–) following the factor name.
Table 3: Extraversion (Introverted versus Extraverted) Introversion Weight in scoring
equation
Extraversion
Reserved (A-) .3 Warm (A+)
Serious (F-) .3 Lively (F+)
Shy (H-) .2 Socially Bold (H+)
Private (N+) .3 Forthright (N-)
Self-Reliant (Q2+) .3 Group-Oriented (Q2-)
Extraversion has been included in even the earliest descriptions of personality. The construct is largely attributed to Jung (1971), but has been found and described in many subsequent studies such as those by Eysenck (1960) and Cattell (1957). Extraversion continues to be measured in the ‘big five’ model of personality so popular in current personality literature (Goldberg, 1992). In the original 16PF Handbook, Extraversion was said to orient around a general social participation (Cattell et al., 1970, p. 117). Extraverts tend to be people-oriented and to seek out relationships with others. Introverts tend to be less outgoing and sociable; they tend to spend more time in their own company than in that of others. Extraversion has several contributing aspects, as reflected in the primary factor scales that play a role in the overall global factor.
Table 4: Anxiety (low Anxiety versus high Anxiety)
Low Anxiety Weight in scoring equation High Anxiety
Emotionally Stable (C+) .4 Reactive (C-)
Trusting (L-) .3 Vigilant (L+)
Self-Assured (O-) .4 Apprehensive (O+)
Relaxed (Q4-) .4 Tense (Q4+)
Like Extraversion, Anxiety has been described since early studies of personality, and continues to be described in studies of the ‘big five’ dimensions of personality (Goldberg, 1992). Anxiety has several contributing aspects, as reflected in its related primary factor scales.
Anxiety can be aroused in response to external events, or it can be internally generated. Anxiousness may be an activation of the ‘fight-or-flight’ state associated with perceived or actual threat, as suggested by the
scoring weights. People with low Anxiety tend to be unperturbed; however, they may minimize negative affect or be unmotivated to change because they are comfortable. Since anxious people often experience more negative affect, they may have difficulty controlling their emotions or reactions and may act in counterproductive ways, as suggested by the scoring weights.
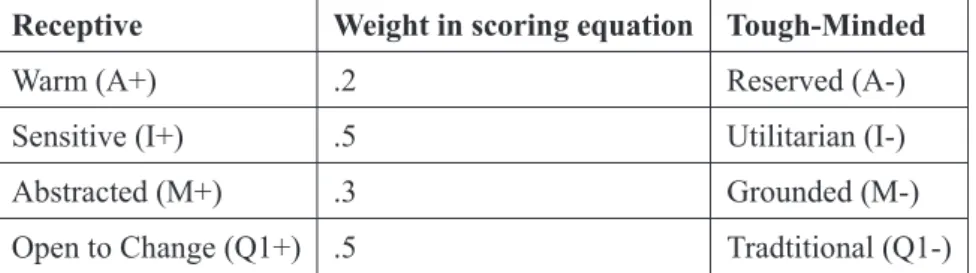
Table 5: Tough-Mindedness (Receptive versus Tough-Minded) Receptive Weight in scoring equation Tough-Minded
Warm (A+) .2 Reserved (A-)
Sensitive (I+) .5 Utilitarian (I-)
Abstracted (M+) .3 Grounded (M-)
Open to Change (Q1+) .5 Tradtitional (Q1-)
Cattell originally called this global factor ‘Cortertia’, an abbreviation for ‘Cortical alertness’ (Cattell et al., 1970, p. 119). High scorers on Cortertia were described as alert and tending to deal with problems at a dry, cognitive level. The factor later assumed the more popularised term ‘Tough-Mindedness’.
In addition to operating at a dry, cognitive level, extremely Tough-Minded people may portray a sense of being ‘established’, possibly to the degree of being set or fixed. That is, they may not be open to other points of view, to unusual people, or to new experiences. While Receptive people may be more open than their Tough-Minded counterparts, Receptive people may overlook the practical or objective aspects of a situation.
A certain inflexibility and lack of openness may be apparent in Tough-Minded people. In fact, toughness and resoluteness can border on entrenchment. Tough-Minded people may have difficulty in accepting new viewpoints, including those that involve emotions. In contrast, Receptive people can be more open to experiencing feelings, possibly even negative affective states. As a result, Receptive people may experience difficulty in setting aside their feeling reactions to attain objectivity, and consequently, may overlook the practical aspects of situations. Gender stereotypes are associated with Tough-Mindedness and Receptivity, the former being more ‘masculine’ and the latter being more ‘feminine’.
Table 6: Independence (Accommodating versus Independent) Accommodating Weight in scoring
equation
Independent
Deferential (E-) .6 Dominant (E+)
Timid (H-) .3 Bold (H+)
Trusting (L-) .2 Vigilant (L+)
Traditional (Q1-) .3 Open to Change (Q1+)
Independence revolves around the tendency to be actively and forcefully self-determined in one’s thinking and actions. Independent people tend to enjoy trying new things and exhibit an intellectual curiosity, as shown in correlations with other measures. A strong element of social forcefulness is evident in Independence. Independent people tend to form and express their own opinions. They often are persuasive and forceful, willing to challenge the status quo, and suspicious of interference from others. Independent people may be uncomfortable or ineffective in situations that involve accommodating other people.
In contrast to Independent people, Accommodating people tend not to question; instead, they value agreeableness and accommodation more than self-determination or getting their way. External situations and other people tend to influence them, both in terms of forming opinions and shaping behaviour. They may be very uncomfortable or ineffective in situations that call for self-expression, assertiveness or persuasion. Accommodation may be linked with the wish to avoid harm or with anxiousness, as suggested by the correlations.
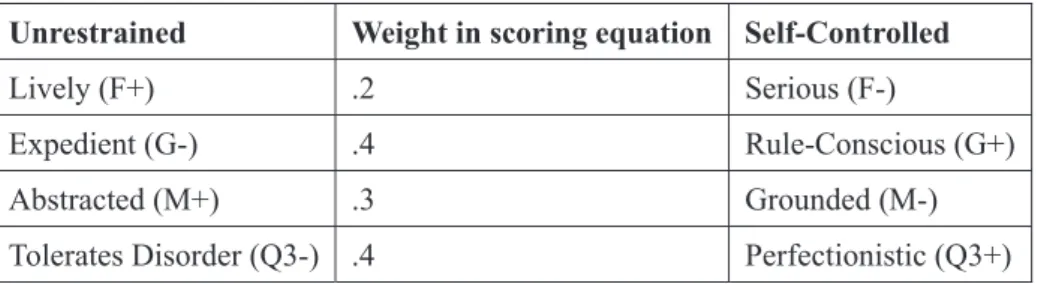
Table 7: Self-Control (Unrestrained versus Self-Controlled)
Unrestrained Weight in scoring equation Self-Controlled
Lively (F+) .2 Serious (F-)
Expedient (G-) .4 Rule-Conscious (G+)
Abstracted (M+) .3 Grounded (M-)
Tolerates Disorder (Q3-) .4 Perfectionistic (Q3+)
Self-Control concerns curbing one’s urges. High scorers tend to be able to inhibit their impulses. Either Self-Controlled people simply do not value flexibility or spontaneity, or they may have acquired self-control at the expense of these qualities.
In contrast to Self-Controlled people, Unrestrained people tend to follow their urges more. Unrestrained people may be flexible in their responses; however, in situations that call for self-control, they may find it difficult to restrain themselves. They may be perceived as self-indulgent, disorganised, irrepressible, or irresponsible, depending on whether they can muster resources for self-control when doing so is important.
Because the 16PF instrument uses oblique factors (that is, Cattell assumed that the primaries would be related), the structure shows that the scales are indeed inter-correlated. These inter-correlations are predictable: the primary scales cluster along the five global factors of Extraversion, Anxiety, Tough-Mindedness, Independence, and Self-Control.
With a knowledge of how certain scales are expected to intercorrelate, the testing professional can identify unexpected factor combinations, thus adding a richness beyond an evaluation that involves only a single factor at a time. In general, primary factor scale scores that cluster on a given global factor tend to be
consistent; that is, a person who scores in the Introverted direction on the global factor often tends to score in the Introverted direction on the primary factor scales that make up Introversion. However, it is not uncommon that one of the primary scale scores will be in the Extraverted direction, even when the person’s score on the global factor falls in the Introverted direction.
In evaluating a profile, then, how conflicting tendencies are played out should be considered and hypotheses should be generated. Comparing the findings with other data about the respondent also can be helpful. Finally, in cases where findings are shared with the respondent, a discussion of conflicting patterns could be valuable.
Step 2C: Evaluate primary factor scales
An understanding of the primary factor scales is critical to understanding the global factor scales. Therefore, users of the 16PF questionnaire should become familiar with such test characteristics as scale reliabilities and standard errors of measurement (SEM) – as described in later chapters.
Primary factor scale descriptions Factor A (Warmth): Warm versus Reserved
Factor A addresses the tendency to be warmly involved with people versus the tendency to be more reserved socially and interpersonally. Reserved (A–) people tend to be more cautious in involvement and attachments. They tend to like working alone, often on mechanical, intellectual or artistic pursuits. Warm (A+) people tend to have more interest in people and to prefer occupations dealing with people (as seen in the item content). They tend to be comfortable in situations that call for closeness with other people.
Warm (A+) behavior tends to be more socially desirable. However, extremely high scores can indicate that the desirable aspect of warmth represents an extreme need for people and for close relating. Extremely Warm (A+) people may be uncomfortable in situations where the close relationships they seek are inaccessible. Low scorers, on the other hand, can be quite uncomfortable in situations that call for extensive interaction or for emotional closeness.
Factor B (Reasoning): Abstract versus Concrete
The Factor B scale is composed of items concerning the ability to solve problems using reasoning. In the 16PF literature, Factor B is described as a brief measure of reasoning or intelligence, although it is not intended as a replacement for more reliable, full-length measures of mental ability. Therefore, cautious interpretations are in order (see ‘Score Meaning’). Even though Reasoning is not a personality trait, it is included in the 16PF instrument because cognitive style moderates the expression of many personality traits.
High scorers tend to solve more of the Reasoning problems correctly; low scorers tend to choose a higher
number of incorrect answers. On the US Factor B scale, H. B. Cattell (1989, pp. 31–32) suggests that high scores frequently reflect higher Reasoning ability because people are unlikely to obtain high scores by chance. At times, however, average or low scores may not accurately reflect people’s reasoning ability.
“These instances are apt to occur in examinees who are educationally disadvantaged or who are depressed, anxious, or preoccupied with their troubles. They also occur when examinees are distracted by environmental stimuli, are wrong in their interpretations of the instructions, or are, for various reasons, not motivated to spend the time figuring out the correct answers” (Cattell, H. B., 1989, p. 32).
Because of the verbal nature of the items, a lower-than-expected score can result when a respondent has reading difficulties or speaks English as a second language. A low score also may indicate that an examinee did not pay full attention to the test, and review of the Infrequency (INF) scale score may support this possibility.
Factor C (Emotional Stability): Emotionally Stable versus Reactive
This factor largely concerns feelings about coping with day-to-day life and its challenges. High scorers tend to take life in their stride and to manage events and emotions in a balanced, adaptive way. Low scorers feel a certain lack of control over life. Low scorers tend to react to life, whereas high scorers make adaptive or proactive choices in managing their lives. This factor has an element of emotional well-being that is supported by correlations with other measures. However, an extremely high score on this scale can indicate that a respondent may be strongly disinclined to report, or even to experience, so-called ‘negative’ feelings.
Presenting oneself as able to cope with life is socially desirable; admitting that one feels unable to manage feelings or adapt to life is socially undesirable. Whenever a respondent obtains an extremely low score, he or she is admitting undesirable feelings. Karson and O’Dell (1976, p. 43) suggest that a respondent always should be questioned about reported experiences of distress and reactivity. They also advise that interpretation of a high Emotional Stability (C+) score, especially when it is accompanied by a high score on the IM scale, should address whether the respondent denied any problems in order to present himself or herself favorably.
Factor E (Dominance): Dominant versus Deferential
This factor involves the tendency to exert one’s will over others (Dominance) versus accommodating others’
wishes (Deference). Factor E is more about dominance than about simple assertiveness. Whereas assertiveness serves to protect one’s rights, wishes, and personal boundaries, dominance serves to subjugate others’ wishes to one’s own (Cattell, H. B., 1989, pp. 68–69). A high score does not eliminate the possibility that a respondent can be assertive rather than aggressive. However, most high scorers tend to be forceful, vocal in expressing their wishes and opinions even when not invited to do so, and pushy about obtaining what they want. They feel free to criticise others and to try to control others’ behaviour. While dominance can lend a certain amount of commanding social presence, extreme dominance can alienate
people who do not wish to be subjugated.
Low scorers tend to avoid conflict by acquiescing to the wishes of others. They are self-effacing and willing to set aside their wishes and feelings. Extreme deference can be alienating to those who wish for a more forceful or participating response.
Factor F (Liveliness): Lively versus Serious
In The 16PF: Personality in Depth, Factor F’s exuberance is compared to the natural self-expression and spontaneity exhibited by children before they learn self-control (Cattell, H. B., 1989, pp. 90–91). High scorers are enthusiastic, spontaneous and attention-seeking; they are lively and drawn to stimulating social situations. Extreme scores may reflect a flighty quality that is seen as unreliable or immature. The attention-seeking and liveliness of F+ people can assume proportions inappropriate for certain situations, especially those that call for restraint or decorum. In contrast, low scorers on Factor F tend to take life more seriously; they are quieter, more cautious, and less playful. They tend to inhibit their spontaneity, sometimes to the point of appearing constricted or saturnine. While they may be regarded as mature, they may not be perceived as fun or entertaining.
Factor G (Rule-Consciousness): Rule-Conscious versus Expedient
This factor addresses the extent to which cultural standards of right and wrong are internalised and used to govern behavior (Cattell et al., 1970, p. 89). It has been associated with the psychoanalytic concept of superego, in which moral ideals from the culture and environment are internalised and used to control the id impulses of self-gratification. High scorers tend to perceive themselves as strict followers of rules, principles and manners. High scorers are described as those who endorse conventional cultural values in their responses to Factor G items (Cattell, H. B., 1989, p. 110). Rule-Conscious people emphasise the importance of conformance to regulations, depicting themselves as rule-bound, conscientious and persevering.
In reality, they can be perceived as staid, inflexible, or self-righteous because of their dogmatism. Low scorers tend to eschew rules and regulations, doing so either because they have a poorly developed sense of right and wrong (for example, lack internalized moral values) or because they ascribe to values that are not solely based on conventional mores in deciding which rules and principles should govern their actions.
Expedient (G–) behaviours seem to have elements of need for autonomy, need for play, and need for flexibility, as suggested by correlations with other measures. Low scorers might have difficulty in conforming to strict rules and regulations. It is important to evaluate whether low scorers have failed to develop moral standards or whether they simply follow unconventional standards. In either case, their behaviours may be perceived as unpredictable unless their guiding principles and motivations are known.
Other primary factor scales can indicate resources that might influence the Expedient (G–) person’s self-control, especially those scales with which this factor correlates.
A link exists between the cultural values endorsed by Rule-Conscious (G+) people and social desirability.
Saying that one follows the rules is more socially desirable than admitting that one does not conform.
Factor H (Social Boldness): Socially Bold versus Shy
High scorers consider themselves to be bold and adventurous in social groups, and show little fear of social situations. They tend to initiate social contacts and aren’t shy in the face of new social settings. A large element of need for self-exhibition is evident at the high pole, with a flavor of dominance more prevalent than in other Extraversion-related factors. Low scorers tend to be socially timid, cautious and shy; they find speaking in front of a group to be a difficult experience. The possibility of subjective experience of discomfort may relate to Shyness (H–) as well as to some lack of self-esteem and discomfort in new settings, particularly interpersonal settings.
Factor I (Sensitivity): Sensitive versus Utilitarian
The content of the Factor I scale focuses on people’s sensitivities and sensibilities; that is, high scorers tend to base judgments on personal tastes and aesthetic values, whereas low scorers tend to have a more utilitarian focus. Sensitive (I+) people rely on empathy and sensitivity in their considerations; Utilitarian (I–) people evince less sentimentality, attending more to how things operate or work. Sensitive (I+) people tend to be more refined in their interests and tastes and more sentimental than their Utilitarian (I–) counterparts. At the extreme, I+ people may be so focused on the subjective aspects of situations that they overlook more functional aspects. Low scorers, on the other hand, tend to be concerned with utility and objectivity, and may exclude people’s feelings from consideration. Because they don’t tend to indulge vulnerability, people with extreme I– scores may have trouble dealing with situations that demand sensitivity.
Factor L (Vigilance): Vigilant versus Trusting
This factor relates to the tendency to trust versus being vigilant about others’ motives and intentions. High scorers expect to be misunderstood or taken advantage of, and they experience themselves as separate from other people. High scorers may be unable to relax their Vigilance (L+) when it might be advantageous to do so. At the extreme, high scorers’ mistrust may have an aspect of animosity, as suggested in correlations with other measures. Sometimes a Vigilant stance is in response to life circumstances (for example, members of oppressed minority groups tend to score higher on Vigilance [L+]).
Low scorers tend to expect fair treatment, loyalty, and good intentions from others. Trust (L–) tends to be related to a sense of well-being and satisfactory relationships, as supported in correlations with other measures. However, extremely low scorers may be taken advantage of because they do not give enough thought to others’ motivations.
Factor M (Abstractedness): Abstracted versus Grounded
Factor M addresses the type of things to which people give thought and attention. Abstracted people (M+) are more oriented to internal mental processes and ideas rather than to practicalities. Grounded (M–) people focus on their senses, observable data, and the outer realities of their environment in forming their perceptions.
High scores, reflecting an intense inner life rather than a focus on outer environment, are associated with the ‘absent-minded professor’ image (Krug, 1981, p. 8). High scorers are Abstracted (M+); that is, they are occupied with thinking, imagination and fantasy, and they often get lost in thought. In contrast, low scorers are Grounded (M–); that is, they focus more on the environment and its demands. Although low scorers may think in a practical and down-to-earth manner, they may not be able to generate possible solutions to problems. In fact, extremely Grounded (M–) people may be so overly concrete or literal that they ‘can’t see the wood for the trees’. Abstracted (M+) thinking, on the other hand, often leads to plentiful idea generation and is related to creativity (Rieke, Guastello and Conn, 1994). However, high scorers may generate ideas without considering the practical realities of people, processes and situations. Extremely Abstracted (M+) people sometimes seem less in control of their attention or of situations, and sometimes report that they have mishaps or accidents because they are preoccupied.
Factor N (Privateness): Private versus Forthright
This factor addresses the tendency to be Forthright (N–) and personally open versus being Private (N+) and non-disclosing. Factor N content addresses whether self-disclosure is part of one’s orientation to people.
Low scorers tend to talk about themselves readily; they are genuine, self-revealing and forthright. At the extreme, low scorers may be Forthright (N–) in situations where doing so may not be to their advantage.
High scorers, on the other hand, tend to be personally guarded. At the extreme, high scorers may maintain their privacy at the expense of developing close relationships with others.
Factor O (Apprehension): Apprehensive versus Self-Assured
High scorers tend to worry about things and to feel apprehensive and insecure. Sometimes, these feelings are in response to a particular life situation. In other cases, these feelings are part of a characteristic response pattern, appearing across situations in a person’s life. Worrying can have positive results, in that a person can anticipate dangers in a situation and can see how actions might have consequences, including interpersonal effects. However, Apprehensive (O+) people can make a poor social presence.
In contrast to high scorers, low scorers tend to be more self-assured, neither prone to apprehensiveness nor troubled about their sense of adequacy. Low scorers present themselves as confident and self-satisfied. If a person’s score is extremely low, his or her confidence may be unshaken, even in situations that provide opportunities for self-evaluation and self-improvement. In such instances, the person’s self-assurance may result from blocking out awareness of negative elements of self.
Factor Q1 (Openness to Change): Open to Change versus Traditional
High scorers tend to think of ways to improve things and to enjoy experimenting. If they perceive the status quo as unsatisfactory or dull, they are inclined to change it. Low scorers tend to prefer traditional ways of looking at things. They don’t question the way things are done. They prefer life to be predictable and familiar, even if life is not ideal.
Factor Q2 (Self-Reliance): Self-Reliant versus Group-Oriented
This factor tends to be about maintaining contact with or proximity to others. High scorers are Self-Reliant (Q2+); they enjoy time alone and prefer to make decisions for themselves. Low scorers are Group-Oriented (Q2–); they prefer to be around people and like to do things with others. Self-Reliant (Q2+) people may have difficulty in working alongside others, and they also may find it hard to ask for help when necessary.
While Self-Reliant people can act autonomously when the need arises, those having extremely high scores may neglect interpersonal aspects and consequences of their actions. On the other hand, being extremely Group-Oriented (Q2–) may not be optimally effective in situations where help is unavailable or where others are providing poor direction or advice.
Factor Q3 (Perfectionism): Perfectionistic versus Tolerates Disorder
High scorers want to do things right. They tend to be organised, to keep things in their proper places, and to plan ahead. Perfectionistic (Q3+) people are likely to be most comfortable in highly organised and predictable situations and may find it hard to deal with unpredictability. At the extreme, they may be seen as inflexible.
In contrast to high scorers, low scorers leave more things to chance and tend to be more comfortable in a disorganized setting. However, low scorers may be perceived as lackadaisical, disorganized or unprepared.
They may not be able to muster a clear motivation for behaving in well-planned or organized ways, especially if these behaviors are unimportant to them.
Factor Q4 (Tension): Tense versus Relaxed
This scale is associated with nervous tension. High scorers tend to have a restless energy and to be fidgety when made to wait. While a certain amount of tension can be focused effectively and can motivate action, extremely high tension can lead to impatience and irritability, as seen in the item content. Professionals may want to address the source of tension whenever high scores occur in a profile since such scores may reflect either tension that is characteristic of a person or tension that is specific to a person’s present life situation.
Low scorers tend to feel relaxed and tranquil. They are patient and slow to become frustrated. At the extreme, their low level of arousal can make them unmotivated. That is, because they are comfortable, they
may be disinclined to change or push themselves.
Response Style Indices
Response style refers to how a respondent reacts to a test and the test-taking setting. Examples of different response styles include tendencies to give socially desirable, acquiescent, critical, extreme, or random answers, regardless of item content (Conn and Rieke, 1994).
The Japanese 16PF questionnaire contains three Response Style Indices, which form Step I of the interpretative strategy to any 16PF5 profile. The three response style indices/scales are as follows:
Impression Management (IM), Infrequency (INF), and Acquiescence (ACQ). Reviewing all three scales provides data about test-taking response styles.
In brief, if a respondent’s score exceeds a certain level (usually the 95th percentile for the high end of the IM scale and the 5th percentile for the low end), the professional should consider possible explanations for the extreme response set. Depending on the reasons for testing and the criticality of accurate test data, the professional might consider retesting, especially if deliberate distortion is suspected.
For example, high scores on the INF scale indicate that a respondent answered a relatively large number of items in a way different from most people. Possible explanations for high INF scale scores include random responding, inability to decide, reactions to specific item content, reading or comprehension difficulties, or trying to avoid making the ‘wrong impression’. If a respondent’s INF score is above the 95th percentile or above another designated cut-off, the professional should try to determine why the uncertain response choice (?) was selected so frequently.
As with the other response style scales, scores above the 95th percentile on the ACQ scale signify the possibility of an acquiescent response set. The testing professional should try to determine whether the high score reflects random, inconsistent or indecisive responding, or a high need for approval.
The importance of correctly identifying invalid protocols varies in different situations. Professionals may choose to set their own cut-offs for classifying protocols as invalid in accordance with the information presented here and relative to individual client cases.
Impression Management scale
This bipolar scale consists of items which are scored only on the IM scale and do not contribute to any of the primary personality scales. IM is essentially a social-desirability scale, with high scores reflecting socially desirable responses and low scores reflecting willingness to admit undesirable attributes or behaviors. The item content reflects both socially desirable and undesirable behaviors or qualities.
Social-desirability response sets include elements of self-deception as well as elements of other-deception (Conn and Rieke, 1994). Thus high scores can reflect impression management (presenting oneself to others as tending to behave in desirable ways), or they can reflect a respondent’s self-image as a person who behaves in desirable ways. In both cases, the possibility exists that the socially desirable responses might be more positive than the respondent’s actual behaviour (that is, a form of response distortion that may be conscious or unconscious) or that the respondent really might behave in socially desirable ways (that is, the response choices accurately reflect the person’s behavior).
The Impression Management (IM) scale was developed alongside the other personality scales using a rational-intuitive approach. An initial item pool that reflected both socially desirable and undesirable behaviours was trialled. These scale items were tested and the results evaluated so that the most internally reliable scale items were retained for the final questionnaire.
Impression Management measures individual differences as determined by comparing a respondent’s score to a ‘norm’ group. A high IM score indicates more socially desirable responding or exaggeration of socially desirable qualities. In contrast, a low IM score indicates less socially desirable responding or exaggeration of socially undesirable qualities (Conn and Rieke, 1994).
Impression Management overlaps with other personality trait factors, hence making interpretations of personality on the basis of IM scores is redundant and unnecessary. Rather, the scale is meant to be used as a criterion-referenced measure; that is, as one of several checks on the overall validity of a 16PF report.
One way to use IM as a validity check involves choosing high and low IM cut-off scores. A respondent’s IM score that is greater than the high cut-off or less than the low cut-off would signal a possible problem with the 16PF report (Conn and Rieke, 1994). Traditional cut-off scores were used for the online 16PF questionnaire on the basis of the norm group’s 5th and 95th percentile. An alternative choice of cut-off is left to the discretion of the practitioner. With this in mind, frequency distributions for the IM items were calculated based upon the norm group. Raw-to-percentile conversions are presented in Table 3.8 to enable the 16PF user to choose the most appropriate cut-off for their particular test setting.
Table 8: Impression Management raw-to-percentile conversions
――――――――――――――
Raw Score Percentile
――――――――――――――
0 1
1 4
2 7
3 13
4 17
5 28
6 33
7 43
8 48
9 61
10 66
11 76
12 80
13 88
14 91
15 95
16 96
17 to 22 99
―――――――――――――
A number of situations exist in which different cut-off choices might be warranted. For example, a high cut-off could be used when hiring for a position in which self-presentation is an important selection criterion, such as sales personnel. A setting in which a low cut-off may be preferable is that in which undesirable qualities may be expected to be presented, such as in a counselling setting.
Depending on the cut-off used, an unusually high IM score may suggest that a respondent has exaggerated their socially desirable qualities. The practitioner could determine possible motives for the exaggerated self-presentation and as a result may even consider retesting (Conn and Rieke, 1994).
Infrequency scale
The INF scale consists of items selected on the basis of the criterion that a given response choice for an item should be selected infrequently. Even though the 16PF tool has a three-choice response format (a, b or c), the most infrequently chosen response choices are invariably ‘b’ responses (a question mark [?]
representing the ‘uncertain or cannot decide’ option). Therefore, when an ‘a’ or ‘c’ response is chosen for an INF scale item, that response does not usually contribute to the INF scale for that particular 16PF5 adaptation.
The total raw score on the INF scale is converted to a percentile that compares the examinee to the normative sample. Those falling at or above the 95th percentile relative to the norm sample are considered to be high.
Items comprising the Infrequency (INF) scale were selected upon the basis of their endorsement rates for the norm sample. The INF scale encompasses all those items for which one of the three answer response options (a, b or c) had an endorsement rate of less than 6.5%. (See Table 9).
Table 9: Infrequency items/scoring key Item numbers
3, 4, 7, 8, 11, 19, 22, 25, 30, 32, 35, 38, 39, 50, 55, 63, 68, 80, 81, 88, 92, 93, 94, 99, 100, 102, 108, 109, 114, 120, 127, 132, 140, 152, 153, 156, 158, 166, 170, 171, 172, 175, 177, 183, 188
(All items are scored to ‘b’ response: ‘b’ = 1, otherwise 0)
The Infrequency scale is scored by adding together the number of ‘b’ responses in the set of items listed above. For each ‘b’ response, 1 point is scored. To determine the raw score for the Infrequency scale, use the scoring key presented in Table 9. For the benefit of users, raw-to-percentile conversions are presented in Table 10. Like any other response style index, the INF scale can be used by the practitioner to generate hypotheses about a respondent’s response style.
Table 10: Infrequency raw-to-percentile conversions
――――――――――
Raw
Score Percentile
――――――――――
0 69
1 78
2 83
3 88
4 91
5 93
6 95
7 96
8 97
9 to 10 98 11to 45 99
――――――――――
Acquiescence scale
The Acquiescence (ACQ) scale measures the tendency to answer ‘true’ to an item, no matter what its content. This scale consists of all the true-or-false items. An ‘acquiescent response style’ is one where the respondent has shown a tendency to agree to items regardless of their content. This response style may
denote a misunderstanding of item content, random responding, difficulty in attending to self-evaluative questions, or inability to choose a self-descriptive response. An acquiescent response set also might indicate an unclear self-image or a high need for the testing professional’s approval (or approval by people in general).
This tendency to agree to item descriptions and answer ‘True’ has been assessed using an empirical approach. This is based on the endorsement frequency of all questionnaire items that have ‘True’ as one of their three answer response options (‘a’, ‘b’ or ‘c’). The frequency of the total set of Acquiescence (ACQ) items was calculated for the norm sample.
Table 11: Acquiescence items/scoring key Item numbers
1, 7, 8, 11, 12, 13, 15, 17, 18, 20, 22, 24, 26, 30, 31, 32, 35, 38, 39, 41, 42, 43, 44, 45, 47, 49, 51, 52, 55, 57, 58, 60, 61, 63, 65, 66, 67, 69, 71, 72, 73, 76, 78, 79, 80, 81, 85, 87, 88, 89, 91, 95, 96, 97, 99, 101, 105, 109, 111, 115, 119, 120, 121, 122, 124, 127, 128, 129, 133, 134, 136, 142, 144, 145, 146, 147, 149, 150, 151, 154, 155, 157, 159, 160, 162, 165, 167, 168, 169, 172, 174, 175, 176, 177, 178, 179, 181 , 186, 184, 185, 186, 188
(All items are scored to ‘a’ response: ‘a’ = 1, otherwise 0)
The ACQ scale is scored by adding together all those items that have one of the ‘True’ answer response formats for answer option ‘a’. To determine the raw score for the ACQ scale, use the scoring key described in Table11. For each item listed, an ‘a’ response receives 1 point.
For the benefit of users, raw-to-percentile conversions are presented in Table 12. Like any other response style index, the ACQ scale can be used by the practitioner to generate hypotheses about a respondent’s response style.
Table 12: Acquiescence raw-to-percentile conversions
――――――――――――――
Raw Score Percentile
――――――――――――――
0-28 1
29 2
30-31 3
32 4
33 5
34 6
35 7
36 9
37 11
38 13
39 15
40 17
41 20
42 24
43 27
44 31
45 34
46 38
47 43
48 47
49 52
50 58
51 62
52 66
53 70
54 74
55 78
56 81
57 84
58 87
59 90
60 92
61 94
62 95
63 96
64 97
65-66 98
67 to102 99
―――――――――――――
Concluding remarks
Although there exists no fixed strategy for 16PF5 profile interpretation, the authors as well as IPAT and
OPP propose the recommended strategy. It involves evaluating the following in the sequence indicated:
1. Response style indices 2. Global factor scale 3. Primary factor scale
In general, response style indices, Impression Management (IM), Infrequency (INF) , and Acquiescence (AQ), are firstly evaluated as a check for atypical response styles. The global factors are examined next because they provide a broad picture of the respondent. Finally, the primary factor scales are evaluated to obtain details of the personality picture. Scoring both the global dimensions and the primary factor scales is recommended for hand-score users.
Appendix shows primary and global factor scales’ descriptors in Japanese.
References
Cattell, R.B. (1945). The description of personality: Principles and findings in a factor analysis. American Journal of Psychology, 58, 69-90.
Cattell, H. B. (1989). The 16PF Personality in Depth. Champaign, Illinois: Institute for Personality and Ability Testing, Inc.
Cattell, R.B., Eber, H.W. and Tatsuoka, M.M. (1970). Handbook for the 16PF. Champaign, Illinois:
Institute for Personality and Ability Testing, Inc.
Conn, S.R. and Rieke, M.L. (1994). The 16PF Fifth Edition Technical Manual. Champaign, IL: Institute for Personality and Ability Testing, Inc.
Eysenck, H.J. (1960). Handbook of Abnormal Psychology. London: Pitman.
Goldberg, G.L.R. (1992). The development of markers for the big-five factor structure. Psychological Assessment, 4(1), 26-42.
Jung, C.G. (1971). Psychological Types (H.G. Baynes, Trans. revised by R.F.C.Hull). Volume 6 of The collected works of C.G. Jung. Princeton, NJ: Princeton University Press. (Original work published in 1921).
Karson, S. and O’Dell, J.W. (1976). A Guide to the Clinical Use of the 16PF. Champaign, Illinois: Institute for Personality and Ability Testing, Inc.
Krug, S.E. (1981). Interpreting 16PF Profile Patterns. Champaign, Illinois: Institute for Personality and Ability Testing, Inc.
Watanabe,N. and Nishida,T. (2003). Development of the Japanese version of 16PF Questionnaire (5th edition): Interim report. Unpublished technical report.
Watanabe,N. and Nishida,T. (2004). Development of the Japanese version of 16PF Questionnaire (5th edition): Final report. Unpublished technical report.
Watanabe,N. Ito,T., and Nishida,T. (2017). Development of a culturally and linguistically equivalent personality test: A case of the Japanese version of 16PF 5th edition, Bulletin of Aichi Shukutoku University, Faculty of Global Communication, 1, 101-131.
Appendix
表1 基本因子の意味
因
子 左 寄 り の 意 味 右 寄 り の 意 味
A
人と関わることや親密になることに慎重で、モノを相 手にしたり、知的なことや芸術を追求すること、独 りで仕事をすることを好む。グラフが極端に左に伸び ている場合は、人との過度の接触や情緒的な親密性 を求められると落ち着かなくなる傾向がある。
「人」に興味があり「人」と関係する仕事を好む。他人 と親密になる状況を好む傾向がある。グラフが極端に 右に伸びている場合は、他人に親密な関係を求めて もそれが得られないと落ち着かなくなる傾向があ る。
B
推論を必要とする問題を解くことが苦手な一方で、
具体的思考を得意とする。グラフが極端に左に伸びて いる場合は、気分が落ち込んでいる、不安を感じて いる、問題を解こうとする意欲がない、十分な時間 がない等も考えられる。
推論には言語的・論理的・数理的推論があるが、それ らの推理能力が高いことを意味する。したがって、推 理を必要とする問題を解くことが得意である。グラフ が極端に右に伸びている場合は、抽象的思考に長け ているといえる。
C
人生を自分でコントロールする感覚に乏しく、人生や生活 に対し受動的な傾向にある。グラフが極端に左に伸び ている場合は、感情の浮き沈みが激しく、情緒的な 不安感があり、ちょっとした困難に出会っても自分 では対処できないと考える傾向にある。
人生を着実にしっかりと歩み、コントロールしていると感 じている。情緒的にも安定し、人生や生活にも能動的 に関わろうとする傾向がある。ただし、グラフが極端に 左に伸びている場合は、自分の良い面だけを見せて 悪い面は隠そうとの意図が反映されていることもあ る。
E
他人の望みや意思に従い、争いごとを避けようとす る傾向がある。自分の望みや感じていることを表さ ず、自己主張より協調を好み、他人を迷惑と感じて も黙っている。グラフが極端に左に伸びている場合 は、力づくの人には近づかない傾向がある。
自分の望みや意思の力を他人に及ぼそうとする。協 調より自己主張を好み、他人を支配しようとする。グ ラフが極端に右に伸びている場合は、力強く独断的で、
他人を批判したり、コントロールしようとする。この傾向は 社会的にある程度好ましく受け止められるが、度が 過ぎると人を遠ざける結果となる。
F
人生をより深刻に考え、物静かで用心深く、はしゃ ぐことがない。のびのびしておらず、陰気に見える 場合がある。成熟した大人と見られる一方で、面白 味のない人とも見られる。おもしろおかしい人生よ り、真面目で厳粛な人生を歩むことを好む。
子供のような自然さで自己表現し、物事に熱中しや すく、のびのびとしていて場を盛り上げる傾向にあ る。グラフが極端に右に伸びている場合は、信用がおけ ず、未熟で気まぐれな上、節度が求められる場面では 軽率な人と見られることもある。
G
善悪を識別する感覚に乏しいが、既存とは異なる価 値観を持っていて、規則・規制は無視する傾向にあ る。自立、遊び、柔軟性を好み、集団や社会に束縛さ れない。グラフが極端に左に伸びている場合は、反社 会的な行動にでる場合もある。
規則や原則、マナーを頑なに守ろうとし、規則・秩序・良 心に忠実である。自らの教条に従って威風堂々とし ており、一徹である反面、独り善がりなところがあ る。意思決定では何が正しく適切かを考え、道徳や倫 理を厳しく守る。
H
集団の中では物怖じし、はにかみ屋である。人前に 出たり、人前で話すことは苦手で、時に劣等感が根 底にある。このような傾向が謙虚さとなって現れる 場合もある。
集団の中で物怖じすることなく大胆に振る舞う。人 との交流を自分から積極的に働きかけ、慣れない場 面でも恥ずかしがらない。根底にはあつかましさが あり、繊細さに欠け、ずうずうしく、異性に対しても 積極的である。
I
共感や感受性に乏しく、人や出来事に感情移入する ことが少ない。功利的で感情的にならずに物事を処 理する。自立していて責任感が強い。グラフが極端に 左に伸びている場合は、実用性や客観性を重視し、
人の感情に配慮しない傾向がある。
共感や感受性に富み、人や出来事に感情移入しやす い。傷つきやすい反面、人の気持ちを解する。関心や 趣味が洗練されていて、感傷にひたる傾向がある。グ ラフが極端に右に伸びている場合は、物事を主観的に 見過ぎ、機能的・実際的な面を見逃しやすい。
L
他人を信頼し、裏表がなく、性善説にたつ。その信頼 の感覚は、人生全般に対する安寧感や他人との満足 できる関係構築に裏打ちされている。グラフが極端に 左に伸びている場合は、他人の企みに対してあまり に無警戒で利用される可能性もある。
他人を信頼せず、疑い深く、他人の隠れた動機や意図 を警戒するあまり、他人と距離をおくところがある。
グラフが極端に右に伸びている場合は、不信感が敵意 となる傾向がある。人生途上の不幸な境遇やいわれ ない差別が影響を与えることも考えられる。
M
自分の感覚や実際に見た事実、外界の現実に注目し やすい。置かれた環境やその環境が求めるものに注 目し、実現的・具体的で地に足のついた方法で考え る。グラフが極端に左に伸びている場合は、木を見て 森を見ないことから根本的な解決に至れないこと もある。
目に見える現実的なものより自身に内在する過程や 観念に注目する。物事を突き詰めて考え、想像や空想 に浸るあまり考えがまとまらないこともある。グラフ が極端に右に伸びている場合は、創造性に富む反面、
現実を見ずに注意不足で事件・事故に巻き込まれや すい。
N
率直で開放的、自分のプライベートなことも他人によく 話す傾向がある。全てのカードをテーブルに広げてゲーム をするタイプ。グラフが極端に左に伸びている場合は、
気取らず純粋かつ単純であるため、自分の損になる ことまで話してしまうところがある。
他人に対して自分の手の内は明かさず、プライバシーを 守ろうとする傾向がある。自分の持っているカードを 一切見せずにゲームをするタイプ。グラフが極端に右に伸 びている場合は、他人と親密な関係を築けず、時に親 密になることを恐れる場合もある。
O
確信を持ち、物事に動じず、心配したり慌てたりし ない傾向がある。自信に満ち、自分自身にも満足し ている。グラフが極端に左に伸びている場合は、自身 を振り返っても自分の否定的な側面に気づけない ほど自信過剰に陥っている場合がある。
過度に心配するあまり、情緒的に不安定で落ち着き がない。心配性の傾向は、そもそもの性質による場合 と、人生途上のある経験による場合とが考えられる。
この傾向は、危険を事前に察知したり危機に備える という面で肯定的な意味も持つ。
Q1
物事を伝統的・慣習的な見方で捉えようとする。人 生が自分の理想とかけ離れていても、ライフスタイルを変 えるより予測可能で慣れ親しんだライフスタイルを志向す る。決まりきった仕事や生活から安心や自信を確保 し、新しい考え方や変わった人との関わりを避けよ うとする。
物事を良い方向に改革したり、実験を楽しむ傾向が ある。現状をつまらないと感じると変革することに 没頭する。普通の人では考えつかないような新しい ことや上手いやり方を考えたり、実際にやってみた りする傾向がある。
Q2
仲間に囲まれ、人と一緒に物事をすることを好む。
社会的に望ましい行動に見られる時もあるが、グラフ が極端に左に伸びている場合は、仲間の援助がない と何もできなかったり、間違った指示や助言を与え られた時に適切な判断が自分で下せなかったりす る。
独りでいる時間を楽しみ、自分で計画を立てたり意 思決定することを好む。自立的でグループに入って仲 間の援助を求めようとしない。人嫌いではないが、グ ラフが極端に右に伸びている場合は、自分の行動が他 人に及ぼす影響を無視する傾向を持つ。
Q3
何事も運任せで、きちんとした仕事ができなくても 気にしない。むしろ乱雑な状況を好む。情熱に欠け、
ぼんやりしており、何事にも準備不足な面がある。
自分にとって重要でない場合は、特にいい加減な行 動や態度を取りがちである。
何事もきちんと完璧に仕上げようとする。身の回り も整理し、計画を周到に立てる。秩序と予測可能な状 態を好む一方、予測不可能な物事には戸惑う。グラフが 極端に右に伸びている場合は、頑なで硬直的である との印象を持たれやすい。
Q4
落ち着いていて静かで忍耐強く、なかなか欲求不満 は感じない。グラフが極端に左に伸びている場合は、モ チベーションが低い。自分は現状が快適であるため、自ら 追いつめたり挑戦したりすることもなく、自分を向 上させようとする意識がほとんどない状態に陥る こともある。
落ち着きがなく、不安で物事の決着を待てない傾向 がある。イライラし、怒りっぽくせかせかしている。これ らは積極的で生産的な行動になって現れる一方、グラ フが極端に右に伸びている場合は、短気で興奮しやす く、周囲に当たり散らすなど否定的な側面が強くな る。