研究ノート
Relationship between the Maximum Size of the Cyclone Products and the Vertical Velocity Distribution inside the
Classifying Column of the Tower Mill Takashi Furuyama & Norio Hashiguchi
Abstract
The Tower Mill is one of the vertical types of stirred ball mill often used in tertiary grinding operation during mineral processing. We have developed a new dry Tower Mill which has a classifying column of 390mm radius installed over a comminution cell of 130mm radius to collect comminuted fine particles before they could flocculate.
The previous investigations revealed that inserting a horizontal circle plate of 260mm
radius inside the classifying column reduced the maximum size of products collected
in the cyclone from 28.8 to 17.5 μm. In this study velocity measurements were carried
out to clarify the vertical velocity distribution at 36 points on the cross section of the
classifying column. The measurement points were located at regular intervals of 69
mm in the horizontal direction (Rank 1 - 6) and 91 mm in the vertical direction
(Column 1 -6). When the plate was not inserted inside the column, it was found that
the partial velocity in the area from Rank 3- Rank 6 to Column 5 – Column 6 had a
great influence on the maximum size of collected products. As for the column inside
the horizontal plate, the velocities in the area located at Rank 1 – 3 : Column 4 – 5 rule
the maximum size of cyclone products.
1. Introduction
Through a series of modifications of the dry tower mill VD-1, KD-1 and KD-2 the production of fine particles have been improved both quantitatively and qualitatively
1)-5). The last version KD-3
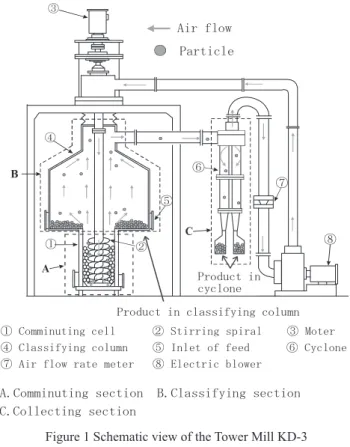
6)-12)of the KD series of tower mill in which the comminuting and classifying operations have been separated, can produce particles finer than 10μm from a limestone ore sizing from 420 to 3,360 μm. The tower mill KD-3 has a length of 1,750 mm, a width of 1,500 mm and a height of 3,050 mm. In this tower mill, products comminuted in the section A (Figure 1) are blew up and transported into the classifying column B, made of an emptied cone on top of a cylinder, before they agglomerate and settle down. The inner diameter and height of the plastic made classifying column are 780mm and 820mm, respectively. Fine particles are deported and recovered in a cyclone with a central spiral ribbon (collecting section C). Previous studies on the KD-3 have shown a reduction in the maximum size of collected products with the increase of the airflow rate in duct when the horizontal circle plate was inserted inside the classifying column
13). This phenomenon was supposed to occur with the reduction of the velocity inside the column. In this study, measurements on the velocity distribution inside the column were carried out to investigate the relationship between the local velocity inside the column and the maximum size of cyclone products.
2. Experimental procedure
As illustrated in Figure 2, the different modifications made to the classifying column were named respectively: CLE, for the empty column (column without an inserted plate) and CLP, for the column with a horizontal circle plate located 180 mm from the bottom of the classifying section and whose diameter was 2/3 of the column diameter. Experiments were carried out on 1.0 kg of limestone ore (density 2.70×
10
3kg/m
3) provided by the Todaka Tsukumi Mine (Japan) and sizing from 3360 to 420
μm. Steel balls of 20 mm diameter (loading mass: 40.0 kg) formed the grinding media
Figure 1 Schematic view of the Tower Mill KD-3
Figure 2 Schematic views of the different modified classifying column
used to ground the material twice, for 60 minutes. The rotation of the stirring screw was settled at 85 rpm and data were collected at different airflow rates in the duct, which could be calculated from the differential pressure in the orifice (Figure 1).
Velocities inside the column were measured at the points shown in Figure 3. Steel balls were not stirred through the measurements of the velocities.
3. Experimental results and discussion
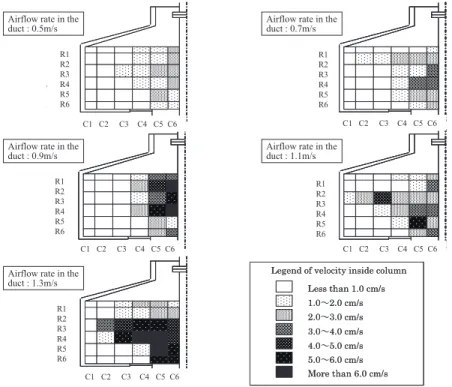
Figure 4 shows the velocity distribution in the CLE according to the variation of airflow rate in duct. At the air flow rate of 0.5 m/s, slow velocities were generated
Figure 3 Measuring points of velocities inside the classifying column
inside the column, from Column 4 to Column 6. Until 0.9 m/s, velocities were reported only from Column 4 to Column 6. When the rate became more than 1.1 m/s, velocities were also generated in Column 2 and Column 3, but rapid velocities could not be observed at Rank 1 and 2.
Figure 5 shows, in the case of CLE, the relationship between the maximum size of cyclone products and the airflow rate in the duct. The estimated maximum size of cyclone products in the Figure 5 was calculated by using the obtained velocities at each measurement point in the Stokes equation. The estimated values were calculated assuming that particles fall freely inside the column. And so, a particle with a settling velocity Up higher than the velocity of the ascending airflow, Um, inside the
Airflow rate in the duct : 1.3m/s Airflow rate in the duct : 0.9m/s Airflow rate in the duct : 0.5m/s
Airflow rate in the duct : 1.1m/s Airflow rate in the duct : 0.7m/s
Figure 4 Variation of velocity distribution in CLE column
classifying column, will reach the bottom of the column. On the other hands, the one with a lower settling velocity is transported into the cyclone. In the results, the size of a particle with the same settling velocity as Um becomes the maximum size in the cyclone products. Accordingly, the maximum size of products collected in the cyclone could be calculated by using, in the Stokes equation, the velocity Um, measured at a point. For example, the estimated values 1 illustrated in Figure 5 are the maximum sizes of cyclone products calculated by using the average of vertical velocities of Rank 3:Column 6, Rank 4:Column 6, Rank 5:Column 6 and Rank 6:Column 6 in the Stokes equation. In the case of CLE column, the maximum size of products collected in the cyclone increases with the experimental values of the airflow rate in the duct. And the experimental values 1 correspond almost to the estimated values 1 and 2. Accordingly the upper velocities, Um, in the area from Rank 3- Rank 6 to Column 5 – Column 6 rule the maximum size of cyclone products.
Figure 5 Relationship between the maximum size of cyclone products and the airflow
rate in the duct in CLE
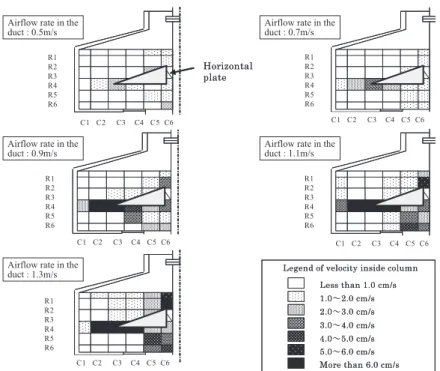
Figure 6 shows the velocity distribution on CLP at various airflow rates in the duct.
When the airflow rate in the duct increased, rapid velocity could be seen below the horizontal plate. Moreover at the edge of the plate as R4:C2, R4 C3 and R4 C4 more rapid velocities were occurring. On the other hands the velocities over the plate were almost gentle.
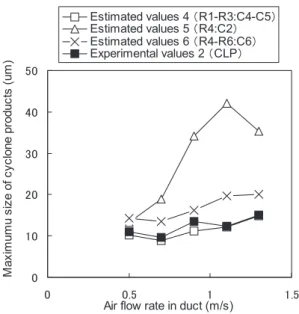
Figure 7 shows a relationship between the maximum size of cyclone products and the airflow rate in the duct in CLP. As for CLP column, the ascending airflow from the comminution section collides to the horizontal plate. So the rapid airflow can be observed at Column 5, 6 and Rank 4. Especially, at the edge of horizontal plate (Rank 4 : Column 2 - 3) air flow is running very rapidly but the air flow over the plate (Rank 1 - 3) is slower than under the plate. The estimated values 4 in the area Rank 1 – 3 :
Figure 6 Variation of velocity distribution in CLP column
Airflow rate in the duct : 1.3m/s Airflow rate in the duct : 0.9m/s Airflow rate in the duct : 0.5m/s
Airflow rate in the duct : 1.1m/s Airflow rate in the duct : 0.7m/s