INTRODUCTION
Tumor cells have a very distinctive metabolism. Several previous studies have considered the metabolic changes that take place in the host after tumor implantation. Metabolic abnormalities arising from malnutrition and malignancy are seen in animals or patients with cancer cachexia. Various cancers affect the lipid metabolism.1-7) Rats subcutaneously implanted with the ascites hepatoma cell line AH109A show hyperlipidemia with a notable decrease in the high-density lipoprotein (HDL) fraction and an enormous increase in the very-low- density lipoprotein (VLDL) plus low-density lipoprotein (LDL) fractions5-7) during growth of the solid tumor.5) AH109A is a hepatoma and originates from the liver. Major lipid metabolism occurs in the liver;
this includes cholesterol, fatty acid, and triglyceride biosyntheses as well as VLDL production. It is therefore believed that hepatoma cells may affect the lipid metabolism in the host body and that the cancer state affects the lipid metabolism.
Sato lung carcinoma (SLC) is a transplantable solid pulmonary tumor induced in a male Donryu strain rat with 4-nitroquinoline 1-oxide.
SLC cells injected intravenously have been found to produce metastatic foci only in the lung, with all injected rats dying of pulmonary metastases.8,9)
In the present study, to investigate the effects of the SLC implantation on lipid metabolism, changes in lipid levels in the serum and liver were
examined in SLC-implanted rats. A previous study reported that SLC- bearing rats implanted with 5×10⁶ cells showed a decrease in the serum HDL- and esterified cholesterol concentrations. The solid tumor was observed within a short time after SLC implantation, although the solid tumor stopped growing and the solid tumor weight was less than 1% of the body weight on the 21st day after SLC implantation.10) Therefore, in the present study, rats were implanted with 5×10⁷ SLC cells or 5×10⁶ SLC cells to investigate the effects of the number of tumor cells implanted on serum and liver lipid levels.
MATERIALS AND METHODS
Animals and diets. This animal experiment was conducted with the approval of the Iwate Prefectural University Research Ethics Committee.
Male Donryu rats (four weeks of age, Japan SLC, Inc., Shizuoka, Japan) were individually housed in stainless steel cages with wire bottoms in an air-conditioned room with a temperature of 22±2℃, a relative humidity of 55±5%, and an 8:00 a.m. to 8:00 p.m. light cycle and were fed a stock pellet diet (MF; Oriental Yeast Co., Ltd., Tokyo, Japan) followed by a basal diet containing 20% casein.11) The composition of the basal diet was as follows: 20% casein (Oriental Yeast Co., Ltd.), 13.2% α-cornstarch (Oriental Yeast Co., Ltd.), 39.75%
cornstarch (Oriental Yeast Co., Ltd.), 10% sucrose (Nissin Sugar Manufacturing Co., Tokyo, Japan), 5% cellulose powder (Oriental Yeast
* Food and Nutrition Major, Science of Living Department.
Abbreviations: HDL, high-density lipoprotein; LCAT, lecithin-cholesterol acyl transferase; LDL, low-density lipoprotein; PBS(-), phosphate-buffered saline; TBARS, thiobarbituric acid-reactive substance; VLDL, very-low-density lipoprotein.
学術論文
Effects of Tumor Bearing on Serum and Liver Lipid Levels in Sato Lung Carcinoma- Implanted Rats: Effect of a Difference in Implanted Cell Numbers
佐藤肺癌移植ラットにおける血清および肝臓脂質レベルに対する担癌の影響―移植細胞数の違いの影響㻌 Masashi KAWASAKI*
川崎 雅志
The effects of tumor bearing on serum and liver lipid levels were investigated in Sato lung carcinoma (SLC)-implanted rats. Tumor-bearing rats were implanted with 5×10⁶ or 5×10⁷ SLC cells and maintained for 21 days. Serum total cholesterol concentration, and especially high-density lipoprotein cholesterol and esterified cholesterol concentrations, were significantly decreased following the implantation of both 5×10⁶ and 5×10⁷ SLC cells as compared to the control group. On the other hand, serum triglyceride and nonesterified fatty acid, liver cholesterol and triglyceride, and serum and liver thiobarbituric acid-reactive substance values were not changed by SLC implantation. The solid tumor could be observed on day 3- 6 or day 2-4 after the implantation of 5×10⁶ or 5×10⁷ SLC cells, respectively, and continued to grow with time. However, on approximately the 14th day after SLC implantation, the solid tumor stopped growing and began to decrease in size until the 21st day after SLC implantation. The solid tumor weight was less than 1% of the body weight on the 21st day after the implantation of both 5×10⁶ and 5×10⁷ SLC cells. These results suggest that in SLC-implanted rats, serum cholesterol concentrations undergo changes resulting in abnormal lipid metabolism, even if the tumor is small in size and regardless of the difference in the number of cells implanted.
Keywords: cancer, serum and liver lipids, tumor bearing 癌,血清および肝臓脂質,担癌
Co., Ltd.), 7% soybean oil (Oriental Yeast Co., Ltd.), 3.5% mineral mixture (AIN 93G composition)11) (Oriental Yeast Co., Ltd.), 1%
vitamin mixture (AIN 93 composition)11) (Oriental Yeast Co., Ltd.), 0.25% choline bitartrate (Wako Pure Chemical Industries, Ltd., Osaka, Japan), and 0.3% L-cystine (Wako Pure Chemical Industries, Ltd.).
After preliminary feeding, the rats were divided into three groups (n=7) of similar body weights. Two of the groups received a subcutaneous implantation of 5×10⁶ (T6 group) or 5×10⁷ (T7 group) SLC cells (provided by the Cell Resource Center for Biomedical Research, Institute of Development, Aging and Cancer, Tohoku University, Sendai, Japan) suspended in phosphate-buffered saline (PBS(-)) (0.5 ml/rat) in the back to produce a solid tumor (tumor-bearing group), and the last group received a sham injection of PBS(-) alone (0.5 ml/rat); this latter group was designated normal rats (C group). The SLC cells were prepared by means of a cell culture system. The SLC cells were cultured in RPMI-1640 medium supplemented with 10% fetal calf serum. The rats of each group were maintained for a further 21 days on the basal diet.
The solid tumor diameter was measured to estimate the tumor volume
every day. Water and diet were offered every day and remained available at all times. The animals were deprived of their diet at 9:00 a.m. on the 21st day, but allowed free access to water until they were sacrificed, which was done 4 hours later. Blood was collected and left to clot at room temperature to obtain serum. The liver, epididymal adipose tissue, and solid tumor were quickly removed, washed with cold 0.9% NaCl, blotted on filter paper, and weighed. The serum and liver were stored at -30℃ until lipid concentration analyses were performed. Aliquots of the liver were also preserved in methanol and stored at 4℃ until analyses of the lipid contents were performed.
Lipid analyses. The lipoprotein separation of serum was as follows, HDL was separated from VLDL plus LDL by precipitation method using sodium phosphotungstic acid and MgCl,12) and VLDL was separated from LDL plus HDL by ultracentrifugation.13)
Serum total, HDL-, and (HDL+LDL)-cholesterol, free cholesterol, triglyceride, phospholipid, and nonesterified fatty acid (NEFA) concentrations were determined by an enzymatic method using a Cholesterol E-test, Free cholesterol E-Test, Triglyceride E-test, Phospholipid C-test, and NEFA C-test (Wako Pure Chemical Industries, Ltd.), respectively. The difference between the total cholesterol concentration and HDL-cholesterol concentration was regarded as the (VLDL+LDL)-cholesterol concentration. The difference between the (HDL+LDL)-cholesterol concentration and HDL-cholesterol concen- tration was regarded as the LDL-cholesterol concentration. The difference between the (VLDL+LDL)-cholesterol concentration and LDL-cholesterol concentration was regarded as the VLDL-cholesterol concentration. The ratio of the (VLDL+LDL)-cholesterol concentration to HDL-cholesterol concentration is designated as the atherogenic index.
The difference between the total cholesterol concentration and free cholesterol concentration was regarded as the esterified cholesterol concentration, and the ratio of the esterified cholesterol concentration to total cholesterol concentration is designated as the cholesterol ratio.
Total lipids were extracted according to the procedure of Folch et al.14) from the liver. After portions of the chloroform phase had been dried under nitrogen, the contents of cholesterol,15) triglyceride,16) and phospholipid17) were determined.
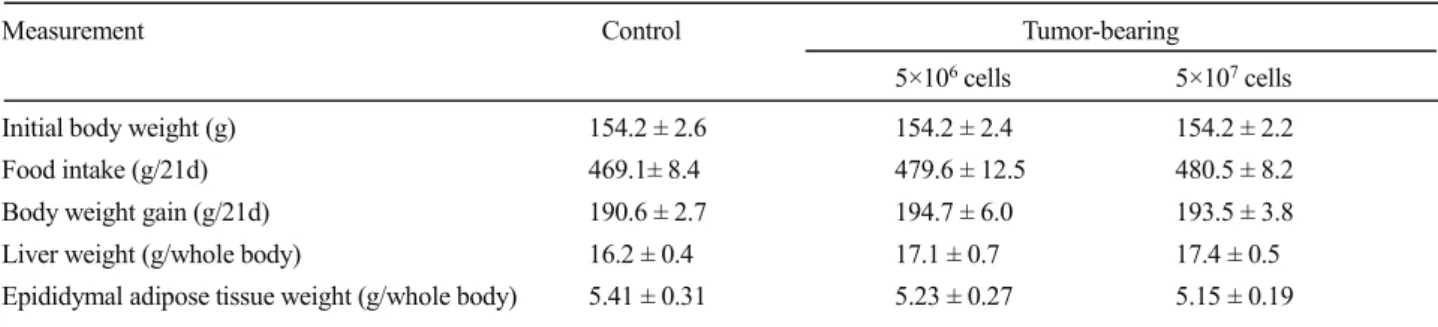
Table 1. Initial body weight, food intake, body weight gain, and weights of liver and epididymal adipose tissue in normal (Control) and tumor-bearing rats.
Measurement Control Tumor-bearing
5×10⁶ cells 5×10⁷ cells Initial body weight (g) 154.2 ± 2.6 154.2 ± 2.4 154.2 ± 2.2 Food intake (g/21d) 469.1± 8.4 479.6 ± 12.5 480.5 ± 8.2 Body weight gain (g/21d) 190.6 ± 2.7 194.7 ± 6.0 193.5 ± 3.8 Liver weight (g/whole body) 16.2 ± 0.4 17.1 ± 0.7 17.4 ± 0.5 Epididymal adipose tissue weight (g/whole body) 5.41 ± 0.31 5.23 ± 0.27 5.15 ± 0.19 Values represent the means ± standard errors for seven rats.
Fig. 1. Estimated solid tumor volume in tumor-bearing rats implanted 5×10⁶ (■) or 5×10⁷ (●) SLC cells. Each value represents the means for seven rats. Vertical bars indicate standard errors.
The serum and liver thiobarbituric acid-reactive substance (TBARS) values were measured according to the method described by Yagi18) and Mihara et al.,19) respectively.
Statistical analysis. Results were expressed as mean ± standard error.
Statistical analysis was carried out by one-way analysis of variance followed by Dunnett’s pairwise multiple comparison t-test using the SPSS Statistics, version 22 (IBM Japan, Ltd., Tokyo, Japan). A
significance level of p < 0.05 was used for all the comparisons.
RESULTS
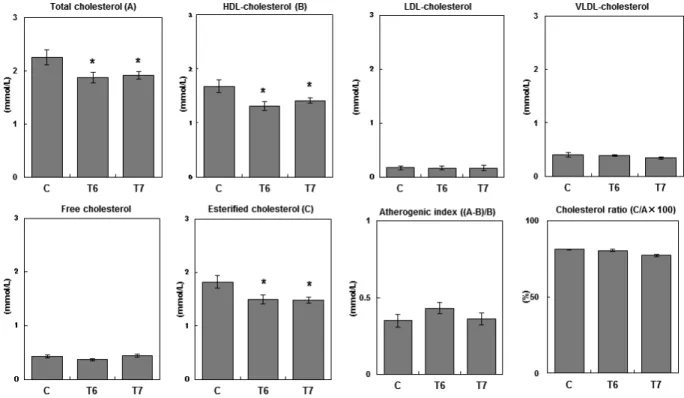
Table 1 shows the initial body weight, food intake, and body weight gain for the 21-day duration of the experimental period and the weights of the liver and epididymal adipose tissue at the end of the experimental period. There were no significant differences between the control group Fig. 2. Serum cholesterol concentration, atherogenic index, and cholesterol ratio in normal and tumor-bearing rats. Each value represents the means for seven rats. Vertical bars indicate standard errors. * Significantly different from the control group at p < 0.05 by one-way analysis of variance followed by Dunnett’s pairwise multiple comparison t-test. C, normal rats group (Control); T6, tumor-bearing rats implanted 5×10⁶ SLC cells group;
T7, tumor-bearing rats implanted 5×10⁷ SLC cells group.
Fig. 3. Serum triglyceride, phospholipid, and nonesterified fatty acid (NEFA) concentrations in normal and tumor-bearing rats. Each value represents the means for seven rats. Vertical bars indicate standard errors. C, normal rats group (Control); T6, tumor-bearing rats implanted 5×10⁶ SLC cells group; T7, tumor-bearing rats implanted 5×10⁷ SLC cells group.
Co., Ltd.), 7% soybean oil (Oriental Yeast Co., Ltd.), 3.5% mineral mixture (AIN 93G composition)11) (Oriental Yeast Co., Ltd.), 1%
vitamin mixture (AIN 93 composition)11) (Oriental Yeast Co., Ltd.), 0.25% choline bitartrate (Wako Pure Chemical Industries, Ltd., Osaka, Japan), and 0.3% L-cystine (Wako Pure Chemical Industries, Ltd.).
After preliminary feeding, the rats were divided into three groups (n=7) of similar body weights. Two of the groups received a subcutaneous implantation of 5×10⁶ (T6 group) or 5×10⁷ (T7 group) SLC cells (provided by the Cell Resource Center for Biomedical Research, Institute of Development, Aging and Cancer, Tohoku University, Sendai, Japan) suspended in phosphate-buffered saline (PBS(-)) (0.5 ml/rat) in the back to produce a solid tumor (tumor-bearing group), and the last group received a sham injection of PBS(-) alone (0.5 ml/rat); this latter group was designated normal rats (C group). The SLC cells were prepared by means of a cell culture system. The SLC cells were cultured in RPMI-1640 medium supplemented with 10% fetal calf serum. The rats of each group were maintained for a further 21 days on the basal diet.
The solid tumor diameter was measured to estimate the tumor volume
every day. Water and diet were offered every day and remained available at all times. The animals were deprived of their diet at 9:00 a.m. on the 21st day, but allowed free access to water until they were sacrificed, which was done 4 hours later. Blood was collected and left to clot at room temperature to obtain serum. The liver, epididymal adipose tissue, and solid tumor were quickly removed, washed with cold 0.9% NaCl, blotted on filter paper, and weighed. The serum and liver were stored at -30℃ until lipid concentration analyses were performed. Aliquots of the liver were also preserved in methanol and stored at 4℃ until analyses of the lipid contents were performed.
Lipid analyses. The lipoprotein separation of serum was as follows, HDL was separated from VLDL plus LDL by precipitation method using sodium phosphotungstic acid and MgCl,12) and VLDL was separated from LDL plus HDL by ultracentrifugation.13)
Serum total, HDL-, and (HDL+LDL)-cholesterol, free cholesterol, triglyceride, phospholipid, and nonesterified fatty acid (NEFA) concentrations were determined by an enzymatic method using a Cholesterol E-test, Free cholesterol E-Test, Triglyceride E-test, Phospholipid C-test, and NEFA C-test (Wako Pure Chemical Industries, Ltd.), respectively. The difference between the total cholesterol concentration and HDL-cholesterol concentration was regarded as the (VLDL+LDL)-cholesterol concentration. The difference between the (HDL+LDL)-cholesterol concentration and HDL-cholesterol concen- tration was regarded as the LDL-cholesterol concentration. The difference between the (VLDL+LDL)-cholesterol concentration and LDL-cholesterol concentration was regarded as the VLDL-cholesterol concentration. The ratio of the (VLDL+LDL)-cholesterol concentration to HDL-cholesterol concentration is designated as the atherogenic index.
The difference between the total cholesterol concentration and free cholesterol concentration was regarded as the esterified cholesterol concentration, and the ratio of the esterified cholesterol concentration to total cholesterol concentration is designated as the cholesterol ratio.
Total lipids were extracted according to the procedure of Folch et al.14) from the liver. After portions of the chloroform phase had been dried under nitrogen, the contents of cholesterol,15) triglyceride,16) and phospholipid17) were determined.
Table 1. Initial body weight, food intake, body weight gain, and weights of liver and epididymal adipose tissue in normal (Control) and tumor-bearing rats.
Measurement Control Tumor-bearing
5×10⁶ cells 5×10⁷ cells Initial body weight (g) 154.2 ± 2.6 154.2 ± 2.4 154.2 ± 2.2 Food intake (g/21d) 469.1± 8.4 479.6 ± 12.5 480.5 ± 8.2 Body weight gain (g/21d) 190.6 ± 2.7 194.7 ± 6.0 193.5 ± 3.8 Liver weight (g/whole body) 16.2 ± 0.4 17.1 ± 0.7 17.4 ± 0.5 Epididymal adipose tissue weight (g/whole body) 5.41 ± 0.31 5.23 ± 0.27 5.15 ± 0.19 Values represent the means ± standard errors for seven rats.
Fig. 1. Estimated solid tumor volume in tumor-bearing rats implanted 5×10⁶ (■) or 5×10⁷ (●) SLC cells. Each value represents the means for seven rats. Vertical bars indicate standard errors.
and each of the two tumor-bearing groups (C vs. T6 and C vs. T7) with regard to food intake, body weight gain, and liver and epididymal adipose tissue weights.
The absolute and relative weights of the solid tumors at the end of the experimental period in groups T6 and T7 were 0.44 ± 0.07 g and 0.12
± 0.02 % of body weight, respectively, in the T6 group, and 0.97 ± 0.21 g and 0.28 ± 0.06 % of body weight, respectively, in the T7 group.
Fig. 1 shows the estimated solid tumor volume in tumor-bearing rats after SLC implantation. The solid tumor could be observed on day 36 (T6 group) or day 2-4 (T7 group) after SLC implantation and continued to grow with time. On approximately the 14th day after SLC implantation, however, the solid tumor stopped growing and began to decrease in size until the 21st day after SLC implantation.
The serum cholesterol concentrations are shown in Fig. 2. The total cholesterol concentration in the tumor-bearing rats decreased significantly as compared to the control group (C vs. T6 and C vs. T7).
In lipoprotein cholesterol, the HDL-cholesterol concentrations in each of the two tumor-bearing groups was significantly lower than that in the control group (C vs. T6 and C vs. T7), while the LDL- and VLDL- cholesterol concentrations were not changed in response to tumor bearing. The atherogenic index in the two tumor-bearing groups was not significantly changed as compared to the control group (C vs. T6 and C vs. T7). The esterified cholesterol concentration in each of the two tumor- bearing groups was significantly lower than that in the control group (C vs. T6 and C vs. T7), while the free cholesterol concentration was not changed in response to tumor-bearing. The cholesterol ratio in the two tumor-bearing groups was not significantly changed as compared to the control group (C vs. T6 and C vs. T7).
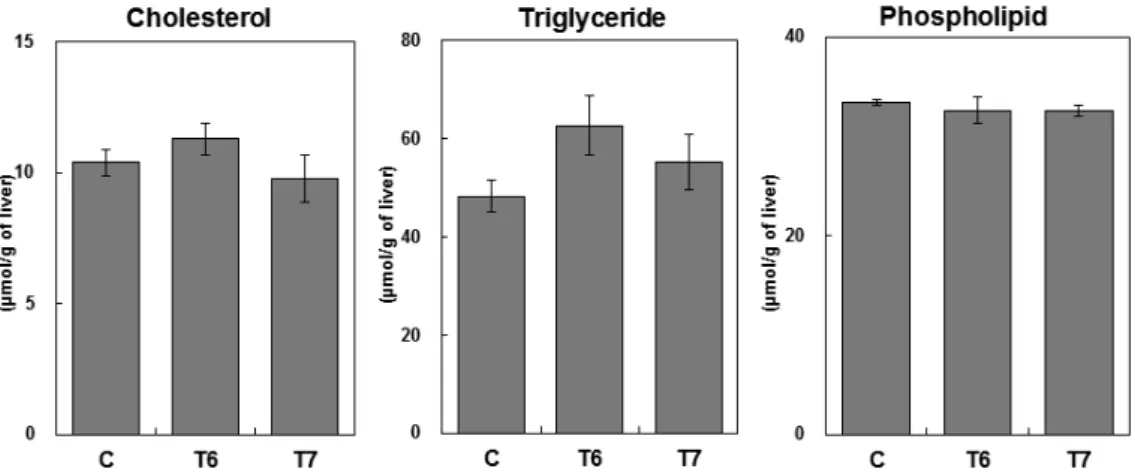
The serum triglyceride, phospholipid, and NEFA concentrations are shown in Fig. 3. There were no significant differences between the control group and each of the two tumor-bearing groups (C vs. T6 and C vs. T7) with regard to the serum triglyceride, phospholipid, and NEFA Fig. 4. Liver lipid contents in normal and tumor-bearing rats. Each value represents the means for seven rats. Vertical bars indicate standard errors.
C, normal rats group (Control); T6, tumor-bearing rats implanted 5×10⁶ SLC cells group; T7, tumor-bearing rats implanted 5×10⁷ SLC cells group.
Fig. 5. Serum and liver thiobarbituric acid-reactive substance (TBARS) values in normal and tumor-bearing rats. Each value represents the means for seven rats. Vertical bars indicate standard errors. C, normal rats group (Control); T6, tumor-bearing rats implanted 5×10⁶ SLC cells group; T7, tumor-bearing rats implanted 5×10⁷ SLC cells group.
concentrations.
The liver lipid contents are shown in Fig. 4. The liver cholesterol, triglyceride, and phospholipid contents were not significantly different between the control group and each of the two tumor-bearing groups (C vs. T6 and C vs. T7).
The serum and liver TBARS values are shown in Fig. 5. There were no significant differences between the control group and each of the two tumor-bearing groups (C vs. T6 and C vs. T7) with regard to the serum and liver TBARS values.
DISCUSSION
The implantation of both 5×10⁶ and 5×10⁷ SLC cells in rats significantly decreased the total cholesterol concentration, especially the esterified cholesterol and HDL-cholesterol concentrations, as compared to the control group. The free cholesterol esterification is catalyzed by lecithin-cholesterol acyl transferase (LCAT). LCAT catalyzes the transfer of a fatty acid residue from the 2-position of lecithin to cholesterol to form esterified cholesterol and is considered to be responsible for much of the esterified cholesterol in plasma lipoproteins.
It is likely that, in the rats that received the SLC implantation, the esterification of free cholesterol might be reduced by the suppression of the LCAT activity, and, hence, the decrease in the serum esterified cholesterol concentration was investigated. LCAT is also an important enzyme in reverse cholesterol transport, as it plays a central role in the transport of excess cholesterol from peripheral tissues to HDL. It has been reported that a significant decrease in plasma HDL-cholesterol concentration and a suppression of plasma LCAT activity occur simultaneously in hemodialysis patients.20) It is considered that if the suppression of serum LCAT activity occurs, it might be the cause of the significant decrease in serum HDL-cholesterol concentration seen in SLC-implanted rats.
It is well known that some cancers affect lipid metabolism. For example, an increase in the serum total cholesterol and (VLDL+LDL)- cholesterol concentrations and a decrease in the serum HDL-cholesterol concentration were seen in rats bearing the ascites hepatoma cell line AH109A.5-7) The plasma TBARS value increased in oral cancer patients.21) In the present study, the SLC implantation did not cause a change in most of the parameters related to lipid metabolism other than the above-mentioned measurements. In the tumor-bearing state, disorders of lipid metabolism occurred during the growth of the solid tumor.5) In a previous study, tumor-bearing rats showed increased plasma triglyceride concentration and suppressed activities of tissue lipoprotein lipase, the hydrolytic enzyme in serum triglyceride, with increased tumor burden, and tumor removal completely reversed these changes.22) These studies provide evidence that the tumor-induced changes in lipid concentrations in blood are stimulated by the presence of the tumor. In the present study, the solid tumor weight was less than 1% of the body weight on the 21st day after the implantation of both 5×10⁶ and 5×10⁷
SLC cells. Therefore, most of the parameters related to lipid metabolism examined in the present study might not be changed by SLC implantation.
In the present study, the solid tumor was observed within a short time after SLC implantation and grew with time in a dose-dependent manner following the implantation of an increased amount of SLC cells, although the solid tumor stopped growing and then decreased in size until the 21st day after SLC implantation. The reason the implanted tumor cells stopped growing is unclear. The tumor cell has a very distinctive metabolism with the potential for infinite growth. The SLC cell originates from Donryu rats; it was therefore unlikely that rejection occurred in the present study because the SLC cells were implanted into Donryu rats.
In conclusion, SLC implantation in rats changes the total cholesterol concentration, and especially the HDL-cholesterol and esterified cholesterol concentrations, even if the tumor is small in size and regardless of the difference in the number of cells implanted. The mechanisms responsible for the observed changes in these serum cholesterol concentrations that occur as a result of the SLC implantation were not determined in the present study. Questions regarding the mechanisms of these changes in lipid levels in response to SLC implantation remain to be answered in a subsequent study.
ACKNOWLEDGMENTS
This study was supported by a grant from Iwate Prefectural University.
REFERENCES
1) He, X. Q., Cichello, S. A., Duan, J. L., and Zhou, J., Canola oil influence on azoxymethane-induced colon carcinogenesis, hyper- triglyceridemia and hyperglycemia in Kunming mice, Asian Pac. J.
Cancer Prev., 15, 2477-2483 (2014).
2) Inamdar, P., and Mehta, G., Correlation between obesity and high density lipoprotein cholesterol (HDL-C) in breast cancer patients of Southern Rajasthan, Indian J. Surg. Oncol., 2, 118-121 (2011).
3) Muntoni, S., Atzori, L., Mereu, R., Satta, G., Macis, M. D., Congia, M., Tedde, A., Desogus, A., and Muntoni, S., Serum lipoproteins and cancer, Nutr. Metab. Cardiovasc. Dis., 19, 218-225 (2009).
4) Qadir, M. I., and Malik, S. A., Plasma lipid profile in gynecologic cancers, Eur. J. Gynaecol. Oncol., 29, 158-161 (2008).
5) Irikura, T., Takagi, K., Okada, K., and Yagasaki, K., Effect of KCD- 232, a new hypolipidemic agent, on serum lipoprotein changes in hepatoma-bearing rats, Lipids, 20, 420-424 (1985).
6) Kawasaki, M., Yagasaki, K., Miura, Y., and Funabiki, R., Responses of serum lipids and adipose tissue lipases to lipopolysaccharide administration in normal and hepatoma-bearing rats, Biosci. Biotechnol.
Biochem., 60, 528-529 (1996).
7) Kawasaki, M., Yagasaki, K., Miura, Y., and Funabiki, R., Comparison and each of the two tumor-bearing groups (C vs. T6 and C vs. T7) with
regard to food intake, body weight gain, and liver and epididymal adipose tissue weights.
The absolute and relative weights of the solid tumors at the end of the experimental period in groups T6 and T7 were 0.44 ± 0.07 g and 0.12
± 0.02 % of body weight, respectively, in the T6 group, and 0.97 ± 0.21 g and 0.28 ± 0.06 % of body weight, respectively, in the T7 group.
Fig. 1 shows the estimated solid tumor volume in tumor-bearing rats after SLC implantation. The solid tumor could be observed on day 36 (T6 group) or day 2-4 (T7 group) after SLC implantation and continued to grow with time. On approximately the 14th day after SLC implantation, however, the solid tumor stopped growing and began to decrease in size until the 21st day after SLC implantation.
The serum cholesterol concentrations are shown in Fig. 2. The total cholesterol concentration in the tumor-bearing rats decreased significantly as compared to the control group (C vs. T6 and C vs. T7).
In lipoprotein cholesterol, the HDL-cholesterol concentrations in each of the two tumor-bearing groups was significantly lower than that in the control group (C vs. T6 and C vs. T7), while the LDL- and VLDL- cholesterol concentrations were not changed in response to tumor bearing. The atherogenic index in the two tumor-bearing groups was not significantly changed as compared to the control group (C vs. T6 and C vs. T7). The esterified cholesterol concentration in each of the two tumor- bearing groups was significantly lower than that in the control group (C vs. T6 and C vs. T7), while the free cholesterol concentration was not changed in response to tumor-bearing. The cholesterol ratio in the two tumor-bearing groups was not significantly changed as compared to the control group (C vs. T6 and C vs. T7).
The serum triglyceride, phospholipid, and NEFA concentrations are shown in Fig. 3. There were no significant differences between the control group and each of the two tumor-bearing groups (C vs. T6 and C vs. T7) with regard to the serum triglyceride, phospholipid, and NEFA Fig. 4. Liver lipid contents in normal and tumor-bearing rats. Each value represents the means for seven rats. Vertical bars indicate standard errors.
C, normal rats group (Control); T6, tumor-bearing rats implanted 5×10⁶ SLC cells group; T7, tumor-bearing rats implanted 5×10⁷ SLC cells group.
Fig. 5. Serum and liver thiobarbituric acid-reactive substance (TBARS) values in normal and tumor-bearing rats. Each value represents the means for seven rats. Vertical bars indicate standard errors. C, normal rats group (Control); T6, tumor-bearing rats implanted 5×10⁶ SLC cells group; T7, tumor-bearing rats implanted 5×10⁷ SLC cells group.
of the changes in lipid metabolism between hepatoma-bearing and lipopolysaccharide-treated rats, Biosci. Biotechnol. Biochem., 68, 72- 78 (2004).
8) Saijo, N., Niitani, H., Chikama, M., Taniguchi, T., and Kimura, K., Effect of Propionibacterium acnes or BCG on enzyme activities in spleen lymphocytes of Donryu strain rats, Gann, 69, 345-352 (1978).
9) Saijo, N., Niitani, H., Irimajiri, N., and Chikama, M., Effect of 1(4- amino-2-methyl-5-pyrimidinyl) methyl-3-(2-chloroethyl)-3-nitroso- urea hydrochloride (ACNU) on Sato lung carcinoma (SLC).
Preliminary result of immunochemotherapy for SLC by combination of ACNU and propionibacterium acnes, Oncology, 36, 7-10 (1979).
10) Kawasaki, M., Effects of tumor bearing on serum and liver lipid levels in Sato lung carcinoma-implanted rats, Bulletin of Morioka Junior College, Iwate Prefectural University, 15, 1-6 (2013).
11) Reeves, P. G., Nielsen, F. H., and Fahey, G. C. Jr., AIN-93 purified diets for laboratory rodents: final report of the American Institute of Nutrition ad hoc writing committee on the reformulation of the AIN- 76A rodent diet, J. Nutr., 123, 1939-1951 (1993).
12) Burstein, M., Scholnick, H. R., and Morfin, R., Rapid method for the isolation of lipoproteins from human serum by precipitation with polyanions, J. Lipid Res., 11, 583-595 (1970).
13) Wu, L. L., Warnick, G. R., Wu, J. T., Williams, R. R., Lalouel, and J.
M., A rapid micro-scale procedure for determination of the total lipid profile, Clin. Chem., 35, 1486-1491 (1989).
14) Folch, J., Lees, M., and Sloane-Stanley, G. H., A simple method for
the isolation and purification of total lipides from animal tissues, J. Biol.
Chem., 226, 497-509 (1957).
15) Zak, B., Simple rapid microtechnic for serum total cholesterol, Am.
J. Clin. Path., 27, 583-588 (1957).
16) van Handel, E., Suggested modifications of the micro determination of triglycerides, Clin. Chem., 7, 249-251 (1961).
17) Chen, P. S., Toribara, T. Y., and Warner, H., Microdetermination of phosphorus, Anal. Chem., 28, 1756-1758 (1956).
18) Yagi, K., A simple fluorometric assay for lipoperoxide in blood plasma, Biochem. Med., 15, 212-216 (1976).
19) Mihara, M., and Uchiyama, M., Determination of malonaldehyde precursor in tissues by thiobarbituric acid test, Anal. Biochem., 86, 271- 278 (1978).
20) Miida, T., Miyazaki, O., Hanyu, O., Nakamura, Y., Hirayama, S., Narita, I., Gejyo, F., Ei, I., Tasaki, K., Kohda, Y., Ohta, T., Yata, S., Fukamachi, I., and Okada, M., LCAT-dependent conversion of prebeta1-HDL into alpha-migrating HDL is severely delayed in hemodialysis patients, J. Am. Soc. Nephrol., 14, 732-738 (2003).
21) Srivastava, K. C., Austin, R. D., Shrivastava, D., Sethupathy, S., and Rajesh, S., A case control study to evaluate oxidative stress in plasma samples of oral malignancy, Contemp. Clin. Dent., 3, 271-276 (2012).
22) Noguchi, Y., Vydelingum, N. A., Younes, R. N., Fried, S. K., and Brennan, M. F., Tumor-induced alterations in tissue lipoprotein lipase activity and mRNA levels, Cancer Res., 51, 863–869 (1991).
和文要旨 佐藤肺癌(SLC)移植ラットにおける血清および肝臓脂質レベルに対する担癌の影響を検討した。担癌ラットに はSLC細胞を5×10⁶または5×10⁷移植し21日間飼育した。血清総コレステロール濃度ならびにその中で高密度リポタンパク質
(HDL)コレステロールおよびエステル結合型コレステロール濃度が5×10⁶および5×10⁷のSLC細胞の移植後対照群と比較し て有意に低下した。その一方で,血清トリグリセリドおよび非エステル結合型脂肪酸,肝臓コレステロールおよびトリグリセリド ならびに血清および肝臓チオバルビツール酸反応物質(TBARS値)にSLC移植による変化はみられなかった。固形癌が5×10⁶ または5×10⁷のSLC移植後それぞれ,3から6日後または2から4日後に観察されるようになり,時間の経過とともに増殖して いった。しかし,SLCの移植およそ14日後に固形癌の増殖が止まり,移植21日目までその大きさが減少していった。移植21日 目の固形癌重量は5×10⁶および5×10⁷のSLC移植のいずれも体重の1%以下であった。SLC移植ラットにおいては,移植細胞数 の違いや固形癌の大きさの小ささにもかかわらず血清コレステロール濃度が変動し,脂質代謝異常が生じることが示唆された。