INTRODUCTION
Tea is one of the most-consumed beverages in the world. Tea is processed from the bud of the tea tree (Thea sinensis L.), and, in general, its hot-water extract is used. Tea is classified into three types based on whether or not the leaves are fermented. Black tea, oolong tea, and green tea are typical fermented, semi-fermented, and non-fermented teas, respectively.
Green tea is a staple beverage in Japan, and it is produced and consumed in very high amounts. Green tea is rich in theanine, glutamic acid, aspargic acid, arginine, serine, and threonine as free amino acids, is rich in ascorbic acid as a vitamin, and is rich in potassium, calcium, magnesium, and phosphorus as minerals. Theanine lends umami and sweetness to green tea, and caffeine lends bitterness. Green tea contains chlorophyll as a pigment. Green tea is a non-fermented tea; oxidases such as polyphenol oxidase are deactivated by steam in the manufacturing process. Therefore, changes in the quality or quantity of
ingredients are not seen in the course of preparation; most of these ingredients in the leaves of the raw materials are maintained in green tea leaves and its hot-water extract.
Tannin, which is also an ingredient that lends bitterness to green tea, is a catechin. Catechins are well known to have healthy effects. For example, catechins have an antibacterial effect.1)
In the present study, we examined the effects of the ingestion of catechin-containing green tea on serum and liver lipid levels in rats. The rats ingested different concentrations of catechin-containing green tea with either a cholesterol-free diet or a cholesterol-loaded diet used as a model of exogenous hypercholesterolemia and fatty liver.
MATERIALS AND METHODS
Animals and diets. This animal experiment was conducted with the approval of the Iwate Prefectural University Research Ethics Committee.
学術論文
Effects of the Ingestion of Green Tea on Serum and Liver Lipid Levels in Rats:
Comparison of Effects between Different Concentrations of Catechin Using Commercial Products
*1ラットの血清および肝臓脂質レベルに対する緑茶摂取の影響㻌
-カテキン濃度の異なる市販製品摂取時の影響の比較-㻌
Michika KIKUCHI,*2,3 Chie SUGAWARA,*2,3 Akari TATESAWA,*2,3 Mari FUJIMORI,*2,3 Reiko SASADA*2 and Masashi KAWASAKI*2,4
菊池美千佳,菅原千詠,舘澤あかり,藤森麻里,笹田怜子,川崎雅志
The effects of the ingestion of different concentrations of catechin-containing green tea on serum and liver lipid levels were investigated in rats. The rats ingested different concentrations of catechin-containing green tea using commercial products with cholesterol-free and cholesterol-loaded diets.
Neither epididymal nor perirenal adipose tissue weights were significantly different between the groups that consumed low and high concentrations of catechin with the cholesterol-free diet. However, with the cholesterol-loaded diet, the epididymal adipose tissue weight in the group that consumed a high concentration of catechin tended to be lower than that in the low-catechin-concentration group, and the perirenal adipose tissue weight was significantly lower in the high-catechin-concentration group than in the low-catechin-concentration group. The serum cholesterol concentration was not significantly different between the low- and high-catechin-concentration groups in either the cholesterol-free or cholesterol-loaded diets. The serum triglyceride concentration was not significantly different between the low- and high-catechin-concentration groups in the cholesterol-free diet. In the cholesterol-loaded diet, the serum triglyceride concentration in the high-catechin-concentration group tended to be lower than that in the low-catechin-concentration group. The serum TBARS value was not significantly different between the low- and high-catechin-concentration groups, both in the cholesterol-free and cholesterol-loaded diets. The liver TBARS value in the high-catechin-concentration group tended to be lower than that in the low-catechin-concentration group in the cholesterol-free diet. In the cholesterol-loaded diet, there was no significant difference in the liver TBARS value between the low- and high-catechin-concentration groups.
Previous studies have demonstrated that tea catechin ingestion brought beneficial effects on lipid metabolism in humans as well as in animals.
These results suggest that frequent catechin-containing green tea ingestion and taking an effective dose of tea catechin can have beneficial effects on lipid metabolism.
Keywords: catechin, liver lipid, serum lipid カテキン,肝臓脂質,血清脂質
*1 This study was conducted as a part of the Special Training of Food and Nutrition Major, Science of Living Department.
*2 Food and Nutrition Major, Science of Living Department.
*3 Co-first authors. These authors contributed equally to this work.
*4 Corresponding author.
Abbreviations: DHA, docosahexaenoic acid; EPA, eicosapentaenoic acid; HDL, high-density lipoprotein; LDL, low-density lipoprotein; NEFA, nonesterified fatty acid; TBARS, thiobarbituric acid-reactive substance; VLDL, very-low-density lipoprotein.
of the changes in lipid metabolism between hepatoma-bearing and lipopolysaccharide-treated rats, Biosci. Biotechnol. Biochem., 68, 72- 78 (2004).
8) Saijo, N., Niitani, H., Chikama, M., Taniguchi, T., and Kimura, K., Effect of Propionibacterium acnes or BCG on enzyme activities in spleen lymphocytes of Donryu strain rats, Gann, 69, 345-352 (1978).
9) Saijo, N., Niitani, H., Irimajiri, N., and Chikama, M., Effect of 1(4- amino-2-methyl-5-pyrimidinyl) methyl-3-(2-chloroethyl)-3-nitroso- urea hydrochloride (ACNU) on Sato lung carcinoma (SLC).
Preliminary result of immunochemotherapy for SLC by combination of ACNU and propionibacterium acnes, Oncology, 36, 7-10 (1979).
10) Kawasaki, M., Effects of tumor bearing on serum and liver lipid levels in Sato lung carcinoma-implanted rats, Bulletin of Morioka Junior College, Iwate Prefectural University, 15, 1-6 (2013).
11) Reeves, P. G., Nielsen, F. H., and Fahey, G. C. Jr., AIN-93 purified diets for laboratory rodents: final report of the American Institute of Nutrition ad hoc writing committee on the reformulation of the AIN- 76A rodent diet, J. Nutr., 123, 1939-1951 (1993).
12) Burstein, M., Scholnick, H. R., and Morfin, R., Rapid method for the isolation of lipoproteins from human serum by precipitation with polyanions, J. Lipid Res., 11, 583-595 (1970).
13) Wu, L. L., Warnick, G. R., Wu, J. T., Williams, R. R., Lalouel, and J.
M., A rapid micro-scale procedure for determination of the total lipid profile, Clin. Chem., 35, 1486-1491 (1989).
14) Folch, J., Lees, M., and Sloane-Stanley, G. H., A simple method for
the isolation and purification of total lipides from animal tissues, J. Biol.
Chem., 226, 497-509 (1957).
15) Zak, B., Simple rapid microtechnic for serum total cholesterol, Am.
J. Clin. Path., 27, 583-588 (1957).
16) van Handel, E., Suggested modifications of the micro determination of triglycerides, Clin. Chem., 7, 249-251 (1961).
17) Chen, P. S., Toribara, T. Y., and Warner, H., Microdetermination of phosphorus, Anal. Chem., 28, 1756-1758 (1956).
18) Yagi, K., A simple fluorometric assay for lipoperoxide in blood plasma, Biochem. Med., 15, 212-216 (1976).
19) Mihara, M., and Uchiyama, M., Determination of malonaldehyde precursor in tissues by thiobarbituric acid test, Anal. Biochem., 86, 271- 278 (1978).
20) Miida, T., Miyazaki, O., Hanyu, O., Nakamura, Y., Hirayama, S., Narita, I., Gejyo, F., Ei, I., Tasaki, K., Kohda, Y., Ohta, T., Yata, S., Fukamachi, I., and Okada, M., LCAT-dependent conversion of prebeta1-HDL into alpha-migrating HDL is severely delayed in hemodialysis patients, J. Am. Soc. Nephrol., 14, 732-738 (2003).
21) Srivastava, K. C., Austin, R. D., Shrivastava, D., Sethupathy, S., and Rajesh, S., A case control study to evaluate oxidative stress in plasma samples of oral malignancy, Contemp. Clin. Dent., 3, 271-276 (2012).
22) Noguchi, Y., Vydelingum, N. A., Younes, R. N., Fried, S. K., and Brennan, M. F., Tumor-induced alterations in tissue lipoprotein lipase activity and mRNA levels, Cancer Res., 51, 863–869 (1991).
和文要旨 佐藤肺癌(SLC)移植ラットにおける血清および肝臓脂質レベルに対する担癌の影響を検討した。担癌ラットに はSLC細胞を5×10⁶または5×10⁷移植し21日間飼育した。血清総コレステロール濃度ならびにその中で高密度リポタンパク質
(HDL)コレステロールおよびエステル結合型コレステロール濃度が5×10⁶および5×10⁷のSLC細胞の移植後対照群と比較し て有意に低下した。その一方で,血清トリグリセリドおよび非エステル結合型脂肪酸,肝臓コレステロールおよびトリグリセリド ならびに血清および肝臓チオバルビツール酸反応物質(TBARS値)にSLC移植による変化はみられなかった。固形癌が5×10⁶ または5×10⁷のSLC移植後それぞれ,3から6日後または2から4日後に観察されるようになり,時間の経過とともに増殖して いった。しかし,SLCの移植およそ14日後に固形癌の増殖が止まり,移植21日目までその大きさが減少していった。移植21日 目の固形癌重量は5×10⁶および5×10⁷のSLC移植のいずれも体重の1%以下であった。SLC移植ラットにおいては,移植細胞数 の違いや固形癌の大きさの小ささにもかかわらず血清コレステロール濃度が変動し,脂質代謝異常が生じることが示唆された。
Male Wistar rats (3-wk-old, Charles River Laboratories Japan, Inc., Kanagawa, Japan) were individually housed in stainless steel cages with wire bottoms in an air-conditioned room at a temperature of 22±2 ℃, a relative humidity of 55±5 %, and a 12-h light cycle (0800-2000). They were fed a stock pellet diet (MF; Oriental Yeast Co., Ltd., Tokyo, Japan) for 1 d. Subsequently, the rats were divided into two groups with similar body weights. Both groups (Experiments 1 and 2) were further divided into two additional groups (n=5), one of which ingested a green tea containing a low concentration of catechin (32 mg/100 ml) (Oi Ocha; Ito En Ltd, Tokyo, Japan) and the other of which ingested a green tea containing a high concentration of catechin (154 mg/100 ml) (Healthya, Kao Corporation, Tokyo, Japan). The food
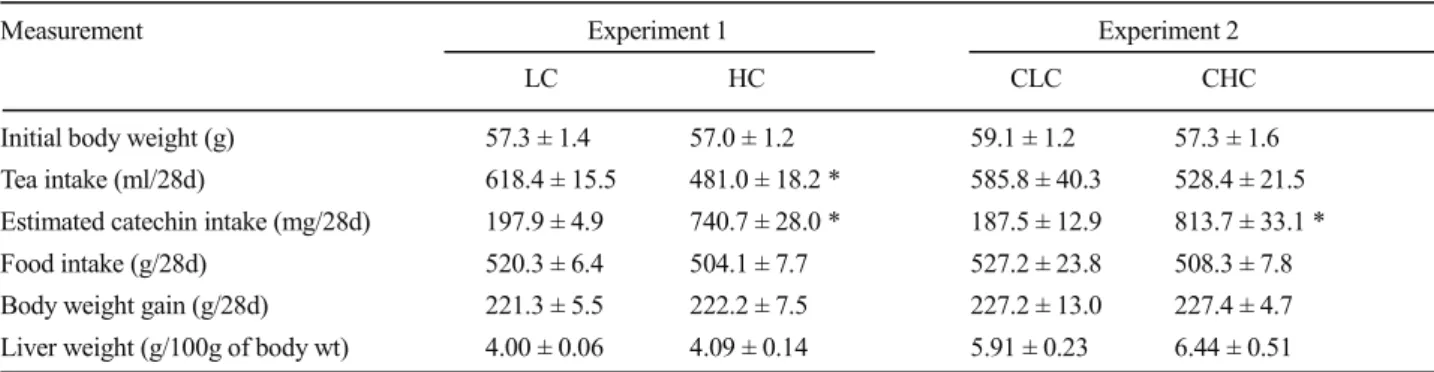
composition of low and high concentration catechin-containing green tea was as follows: 0 g protein, 0 g lipid, 0 g carbohydrate and 9 mg sodium per 100 ml, and 0 g protein, 0 g lipid, 1.1 g carbohydrate and 10 mg sodium per 100 ml, respectively. The Experiment 1 groups ingested the basal diet, and the Experiment 2 groups ingested a cholesterol-loaded diet. The composition of the basal diet2) was as follows: 20 % casein (Oriental Yeast Co., Ltd.), 13.2 % α-cornstarch (Oriental Yeast Co., Ltd.), 39.75 % cornstarch (Oriental Yeast Co., Ltd.), 10 % sucrose (Nissin Sugar Manufacturing Co., Ltd., Tokyo, Japan), 5 % cellulose powder (Oriental Yeast Co., Ltd.), 7 % soybean oil (Oriental Yeast Co., Ltd.), 3.5 % mineral mixture (AIN 93G composition)2) (Oriental Yeast Co., Ltd.), 1 % vitamin mixture (AIN 93 Table 1. Initial body weight, food and tea intake, body weight gain, and relative weight of liver in rats ingested different concentration of catechin-containing green tea with cholesterol-free (Experiment 1) and cholesterol-loaded (Experiment 2) diets.
Measurement Experiment 1 Experiment 2 LC HC CLC CHC Initial body weight (g) 57.3 ± 1.4 57.0 ± 1.2 59.1 ± 1.2 57.3 ± 1.6 Tea intake (ml/28d) 618.4 ± 15.5 481.0 ± 18.2 * 585.8 ± 40.3 528.4 ± 21.5 Estimated catechin intake (mg/28d) 197.9 ± 4.9 740.7 ± 28.0 * 187.5 ± 12.9 813.7 ± 33.1 * Food intake (g/28d) 520.3 ± 6.4 504.1 ± 7.7 527.2 ± 23.8 508.3 ± 7.8 Body weight gain (g/28d) 221.3 ± 5.5 222.2 ± 7.5 227.2 ± 13.0 227.4 ± 4.7 Liver weight (g/100g of body wt) 4.00 ± 0.06 4.09 ± 0.14 5.91 ± 0.23 6.44 ± 0.51 Values represent the means ± standard errors for five rats. * Significantly different at p < 0.05 by unpaired Student's t-test. LC, low concentration of catechin-containing green tea with cholesterol-free diet group; HC, high concentration of catechin-containing green tea with cholesterol-free diet group; CLC, low concentration of catechin-containing green tea with cholesterol-loaded diet group; CHC, high concentration of catechin-containing green tea with cholesterol-loaded diet group.
Fig. 1. Relative weights of epididymal and perirenal adipose tissues in rats ingested different concentration of catechin-containing green tea with cholesterol-free and cholesterol-loaded diets. Values represent the means for five rats. Vertical bars indicate standard errors. * Significantly different at p < 0.05 by unpaired Student's t-test. LC, low concentration of catechin-containing green tea with cholesterol-free diet group; HC, high concentration of catechin-containing green tea with cholesterol-free diet group; CLC, low concentration of catechin-containing green tea with cholesterol-loaded diet group; CHC, high concentration of catechin-containing green tea with cholesterol-loaded diet group.
composition)2) (Oriental Yeast Co., Ltd.), 0.25 % choline bitartrate (Wako Pure Chemical Industries, Ltd., Osaka, Japan), and 0.3 % L-cystine (Wako Pure Chemical Industries, Ltd.). The cholesterol-loaded diet was prepared by adding 0.5 % cholesterol (Wako Pure Chemical Industries, Ltd.) and 0.125 % sodium cholate (Wako Pure Chemical Industries, Ltd.) to the basal diet at the expense of cornstarch. The rats were maintained on this diet for an additional 28 d. The diet and green tea were available at all times. Animals were deprived of their diet at 0900 on the 28th day but allowed free access to green tea until they were sacrificed, which occurred 4 h later. Blood was collected from the heart and left to clot at room temperature so that serum could be obtained. The liver and epididymal and perirenal adipose tissues were quickly removed, washed with cold 0.9 % NaCl, blotted on filter paper, and weighed. The serum and liver were stored at 30 ℃ until lipid concentration analyses were performed. Aliquots of the liver were also preserved in methanol and stored at 4 ℃ until analyses of the lipid contents were performed.
Lipid analyses. Serum total cholesterol, high-density lipoprotein (HDL)-cholesterol, triglyceride, phospholipid, and nonesterified fatty acid (NEFA) concentrations were determined by an enzymatic method using a Cholesterol E-test Wako, HDL-Cholesterol E-test Wako, Triglyceride E-test Wako, Phospholipid C-test Wako, and NEFA-C test
Wako, respectively. All test kits were obtained from Wako Pure Chemical Industries, Ltd. The difference between the total cholesterol concentration and the HDL-cholesterol concentration was regarded as the (VLDL+LDL)-cholesterol concentration. The ratio of the (VLDL+LDL)-cholesterol concentration to the HDL-cholesterol concentration is designated as the atherogenic index. The ratio of the HDL-cholesterol concentration to the total cholesterol concentration is designated as the HDL-cholesterol ratio.
Total lipids from the liver were extracted according to the procedure described by Folch et al.3) After portions of the chloroform phase had been dried under nitrogen, cholesterol,4) triglyceride,5) and phospholipid6) contents were determined.
The serum and liver thiobarbituric acid-reactive substance (TBARS) values were measured according to the method described by Yagi7) and Mihara et al.,8) respectively.
Statistical analyses. Results were expressed as the mean ± standard error. Statistical analysis was carried out by unpaired Student’s t-test using the SPSS Statistics, version 22 (IBM Japan, Ltd., Tokyo, Japan).
Differences were considered significant at p < 0.05.
RESULTS
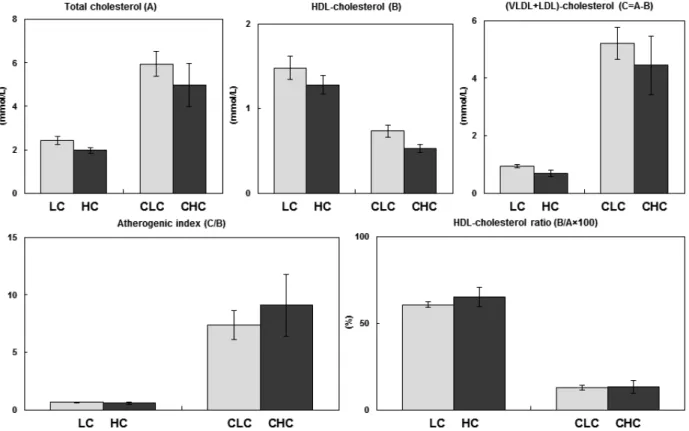
Table 1 shows the initial body weight; green tea, food, and Fig. 2. Effects of the ingestion of different concentration of catechin-containing green tea with cholesterol-free and cholesterol-loaded diets on serum cholesterol concentration, atherogenic index, and high-density lipoprotein (HDL)-cholesterol ratio in rats. Values represent the means for five rats. Vertical bars indicate standard errors. LC, low concentration of catechin-containing green tea with cholesterol-free diet group; HC, high concentration of catechin-containing green tea with cholesterol-free diet group; CLC, low concentration of catechin-containing green tea with cholesterol-loaded diet group; CHC, high concentration of catechin-containing green tea with cholesterol-loaded diet group.
Male Wistar rats (3-wk-old, Charles River Laboratories Japan, Inc., Kanagawa, Japan) were individually housed in stainless steel cages with wire bottoms in an air-conditioned room at a temperature of 22±2 ℃, a relative humidity of 55±5 %, and a 12-h light cycle (0800-2000). They were fed a stock pellet diet (MF; Oriental Yeast Co., Ltd., Tokyo, Japan) for 1 d. Subsequently, the rats were divided into two groups with similar body weights. Both groups (Experiments 1 and 2) were further divided into two additional groups (n=5), one of which ingested a green tea containing a low concentration of catechin (32 mg/100 ml) (Oi Ocha; Ito En Ltd, Tokyo, Japan) and the other of which ingested a green tea containing a high concentration of catechin (154 mg/100 ml) (Healthya, Kao Corporation, Tokyo, Japan). The food
composition of low and high concentration catechin-containing green tea was as follows: 0 g protein, 0 g lipid, 0 g carbohydrate and 9 mg sodium per 100 ml, and 0 g protein, 0 g lipid, 1.1 g carbohydrate and 10 mg sodium per 100 ml, respectively. The Experiment 1 groups ingested the basal diet, and the Experiment 2 groups ingested a cholesterol-loaded diet. The composition of the basal diet2) was as follows: 20 % casein (Oriental Yeast Co., Ltd.), 13.2 % α-cornstarch (Oriental Yeast Co., Ltd.), 39.75 % cornstarch (Oriental Yeast Co., Ltd.), 10 % sucrose (Nissin Sugar Manufacturing Co., Ltd., Tokyo, Japan), 5 % cellulose powder (Oriental Yeast Co., Ltd.), 7 % soybean oil (Oriental Yeast Co., Ltd.), 3.5 % mineral mixture (AIN 93G composition)2) (Oriental Yeast Co., Ltd.), 1 % vitamin mixture (AIN 93 Table 1. Initial body weight, food and tea intake, body weight gain, and relative weight of liver in rats ingested different concentration of catechin-containing green tea with cholesterol-free (Experiment 1) and cholesterol-loaded (Experiment 2) diets.
Measurement Experiment 1 Experiment 2 LC HC CLC CHC Initial body weight (g) 57.3 ± 1.4 57.0 ± 1.2 59.1 ± 1.2 57.3 ± 1.6 Tea intake (ml/28d) 618.4 ± 15.5 481.0 ± 18.2 * 585.8 ± 40.3 528.4 ± 21.5 Estimated catechin intake (mg/28d) 197.9 ± 4.9 740.7 ± 28.0 * 187.5 ± 12.9 813.7 ± 33.1 * Food intake (g/28d) 520.3 ± 6.4 504.1 ± 7.7 527.2 ± 23.8 508.3 ± 7.8 Body weight gain (g/28d) 221.3 ± 5.5 222.2 ± 7.5 227.2 ± 13.0 227.4 ± 4.7 Liver weight (g/100g of body wt) 4.00 ± 0.06 4.09 ± 0.14 5.91 ± 0.23 6.44 ± 0.51 Values represent the means ± standard errors for five rats. * Significantly different at p < 0.05 by unpaired Student's t-test. LC, low concentration of catechin-containing green tea with cholesterol-free diet group; HC, high concentration of catechin-containing green tea with cholesterol-free diet group; CLC, low concentration of catechin-containing green tea with cholesterol-loaded diet group; CHC, high concentration of catechin-containing green tea with cholesterol-loaded diet group.
Fig. 1. Relative weights of epididymal and perirenal adipose tissues in rats ingested different concentration of catechin-containing green tea with cholesterol-free and cholesterol-loaded diets. Values represent the means for five rats. Vertical bars indicate standard errors. * Significantly different at p < 0.05 by unpaired Student's t-test. LC, low concentration of catechin-containing green tea with cholesterol-free diet group; HC, high concentration of catechin-containing green tea with cholesterol-free diet group; CLC, low concentration of catechin-containing green tea with cholesterol-loaded diet group; CHC, high concentration of catechin-containing green tea with cholesterol-loaded diet group.
estimated catechin intakes; body weight gain over the 28-day experimental period; and the relative weight of the liver at the end of the experimental period. The green tea intake was significantly lower in the high-catechin-concentration group than in the low-catechin-concentration group in the cholesterol-free diet, whereas in the cholesterol-loaded diet, there was no significant difference between the low- and high-catechin-concentration groups. On the other hand, the estimated catechin intake in the high-catechin-concentration group was significantly higher than that in the low-catechin-concentration group in both the cholesterol-free and cholesterol-loaded diets due to the different catechin concentrations of these two experimental green tea beverages. The food intake and body weight gain were not significantly different between the low- and high-catechin-concentration groups in either the cholesterol-free or the cholesterol-loaded diet. The relative liver weight was also not significantly different between the low- and high-catechin-concentration groups in either the cholesterol-free or the cholesterol-loaded diet.
The relative weights of epididymal and perirenal adipose tissues at the end of the experimental period are shown in Fig. 1. Neither the epididymal nor the perirenal adipose tissue weight was significantly different between the low- and high-catechin-concentration groups in the cholesterol-free diet, whereas in the cholesterol-loaded diet, the epididymal adipose tissue weight in the high-catechin-concentration group tended to be lower than that in the low-catechin-concentration group, and the perirenal adipose tissue weight was significantly lower in the high-catechin-concentration group than in the low-catechin-concentration group.
Serum cholesterol concentrations are shown in Fig. 2. The serum total cholesterol concentration was not significantly different between the low- and high-catechin-concentration groups in either the cholesterol-free or the cholesterol-loaded diet. As for the lipoprotein cholesterol concentrations, neither the HDL-cholesterol nor the (VLDL+LDL)-cholesterol concentration was significantly different between the low- and high-catechin-concentration groups in either the cholesterol-free or the cholesterol-loaded diet. Thus, the atherogenic index and HDL-cholesterol ratio in the low-catechin-concentration group were not changed as compared to those in the high-catechin-concentration group in either the cholesterol-free or the cholesterol-loaded diet.
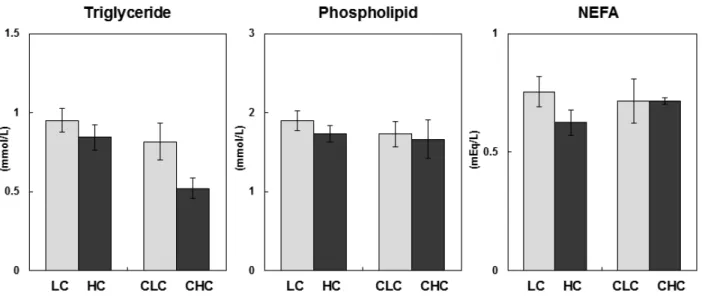
Fig. 3 shows the serum triglyceride, phospholipid, and NEFA concentrations. The serum triglyceride concentration was not significantly different between the low- and high-catechin-concentration groups in the cholesterol-free diet. In the cholesterol-loaded diet, the serum triglyceride concentration in the high-catechin-concentration group tended to be lower than that in the low-catechin-concentration group. The serum phospholipid and NEFA concentrations were not significantly different between the low- and high-catechin-concentration groups in either the cholesterol-free or the cholesterol-loaded diet.
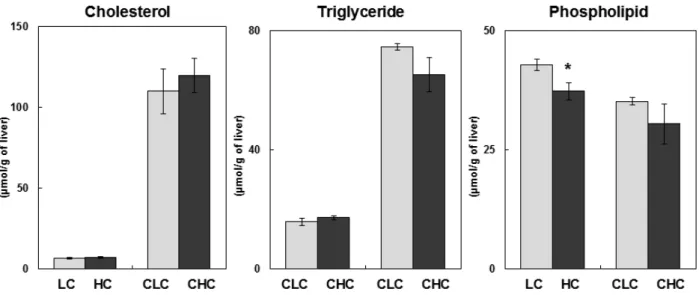
The liver lipid contents are shown in Fig. 4. There were no significant differences in the liver cholesterol and triglyceride contents between the low- and high-catechin-concentration groups in either the cholesterol-free or the cholesterol-loaded diet. The liver phospholipid content in the high-catechin-concentration group was significantly lower than that in the low-catechin-concentration group in the Fig. 3. Effects of the ingestion of different concentration of catechin-containing green tea with cholesterol-free and cholesterol-loaded diets on serum triglyceride, phospholipid, and nonesterified fatty acid (NEFA) concentrations in rats. Values represent the means for five rats. Vertical bars indicate standard errors. LC, low concentration of catechin-containing green tea with cholesterol-free diet group; HC, high concentration of catechin-containing green tea with cholesterol-free diet group; CLC, low concentration of catechin-containing green tea with cholesterol-loaded diet group; CHC, high concentration of catechin-containing green tea with cholesterol-loaded diet group.
cholesterol-free diet, whereas there was no significant difference in the liver phospholipid content between the low- and high-catechin-concentration groups in the cholesterol-loaded diet.
The serum and liver TBARS values are shown in Fig. 5. The serum TBARS value was not significantly different between the low- and high-catechin-concentration groups in either the cholesterol-free or the cholesterol-loaded diet. The liver TBARS value in the
high-catechin-concentration group tended to be lower than that in the low-catechin-concentration group in the cholesterol-free diet. In the cholesterol-loaded diet, there was no significant difference in the liver TBARS value between the low- and high-catechin-concentration groups.
DISCUSSION
Fig. 4. Effects of the ingestion of different concentration of catechin-containing green tea with cholesterol-free and cholesterol-loaded diets on liver lipid contents in rats. Values represent the means for five rats. Vertical bars indicate standard errors. * Significantly different at p < 0.05 by unpaired Student's t-test. LC, low concentration of catechin-containing green tea with cholesterol-free diet group; HC, high concentration of catechin-containing green tea with cholesterol-free diet group; CLC, low concentration of catechin-containing green tea with cholesterol-loaded diet group; CHC, high concentration of catechin-containing green tea with cholesterol-loaded diet group.
Fig. 5. Effects of the ingestion of different concentration of catechin-containing green tea with cholesterol-free and cholesterol-loaded diets on serum and liver thiobarbituric acid-reactive substance (TBARS) values in rats. Values represent the means for five rats. Vertical bars indicate standard errors. LC, low concentration of catechin-containing green tea with cholesterol-free diet group; HC, high concentration of catechin-containing green tea with cholesterol-free diet group; CLC, low concentration of catechin-containing green tea with cholesterol-loaded diet group; CHC, high concentration of catechin-containing green tea with cholesterol-loaded diet group.
estimated catechin intakes; body weight gain over the 28-day experimental period; and the relative weight of the liver at the end of the experimental period. The green tea intake was significantly lower in the high-catechin-concentration group than in the low-catechin-concentration group in the cholesterol-free diet, whereas in the cholesterol-loaded diet, there was no significant difference between the low- and high-catechin-concentration groups. On the other hand, the estimated catechin intake in the high-catechin-concentration group was significantly higher than that in the low-catechin-concentration group in both the cholesterol-free and cholesterol-loaded diets due to the different catechin concentrations of these two experimental green tea beverages. The food intake and body weight gain were not significantly different between the low- and high-catechin-concentration groups in either the cholesterol-free or the cholesterol-loaded diet. The relative liver weight was also not significantly different between the low- and high-catechin-concentration groups in either the cholesterol-free or the cholesterol-loaded diet.
The relative weights of epididymal and perirenal adipose tissues at the end of the experimental period are shown in Fig. 1. Neither the epididymal nor the perirenal adipose tissue weight was significantly different between the low- and high-catechin-concentration groups in the cholesterol-free diet, whereas in the cholesterol-loaded diet, the epididymal adipose tissue weight in the high-catechin-concentration group tended to be lower than that in the low-catechin-concentration group, and the perirenal adipose tissue weight was significantly lower in the high-catechin-concentration group than in the low-catechin-concentration group.
Serum cholesterol concentrations are shown in Fig. 2. The serum total cholesterol concentration was not significantly different between the low- and high-catechin-concentration groups in either the cholesterol-free or the cholesterol-loaded diet. As for the lipoprotein cholesterol concentrations, neither the HDL-cholesterol nor the (VLDL+LDL)-cholesterol concentration was significantly different between the low- and high-catechin-concentration groups in either the cholesterol-free or the cholesterol-loaded diet. Thus, the atherogenic index and HDL-cholesterol ratio in the low-catechin-concentration group were not changed as compared to those in the high-catechin-concentration group in either the cholesterol-free or the cholesterol-loaded diet.
Fig. 3 shows the serum triglyceride, phospholipid, and NEFA concentrations. The serum triglyceride concentration was not significantly different between the low- and high-catechin-concentration groups in the cholesterol-free diet. In the cholesterol-loaded diet, the serum triglyceride concentration in the high-catechin-concentration group tended to be lower than that in the low-catechin-concentration group. The serum phospholipid and NEFA concentrations were not significantly different between the low- and high-catechin-concentration groups in either the cholesterol-free or the cholesterol-loaded diet.
The liver lipid contents are shown in Fig. 4. There were no significant differences in the liver cholesterol and triglyceride contents between the low- and high-catechin-concentration groups in either the cholesterol-free or the cholesterol-loaded diet. The liver phospholipid content in the high-catechin-concentration group was significantly lower than that in the low-catechin-concentration group in the Fig. 3. Effects of the ingestion of different concentration of catechin-containing green tea with cholesterol-free and cholesterol-loaded diets on serum triglyceride, phospholipid, and nonesterified fatty acid (NEFA) concentrations in rats. Values represent the means for five rats. Vertical bars indicate standard errors. LC, low concentration of catechin-containing green tea with cholesterol-free diet group; HC, high concentration of catechin-containing green tea with cholesterol-free diet group; CLC, low concentration of catechin-containing green tea with cholesterol-loaded diet group; CHC, high concentration of catechin-containing green tea with cholesterol-loaded diet group.
The ingestion of green tea containing a high concentration of catechin significantly decreased the perirenal adipose tissue weight as compared to the ingestion of green tea containing a low concentration of catechin. Furthermore, the epididymal adipose tissue weight in the high-catechin-concentration green tea group tended to be lower than that in the low-catechin-concentration green tea group in the cholesterol-loaded diet; the catechin might be considered to decrease the triglyceride accumulation. A previous study reported that tea catechin ingestion decreased the epididymal adipose tissue weight in a dose-dependent manner, and at the same time, the liver β-oxidation activity, related to fatty acid degradation, was stimulated in mice fed a high-fat diet.9) Another study found that, in rats, tea catechin ingestion decreased the visceral (epididymal, mesenteric, and perirenal plus retroperitoneal) adipose tissue weights as compared to the control group, and at the same time, the activities of fatty acid synthase and malic enzymes, related to fatty acid syntheses, were decreased.10) The decrease in the adipose tissue weight associated with the ingestion of high-catechin-concentration green tea seen in the present study might be due, at least in part, to the stimulation of β-oxidation activity and the suppression of fatty acid synthesis-related enzyme activities.
The serum total, HDL-, and (VLDL+LDL)-cholesterol concentrations were not changed between the low- and high-catechin-concentration groups in both the cholesterol-free and cholesterol-loaded diets. It is known that catechin decreases the total cholesterol concentration, especially the LDL-cholesterol concentration, in blood.11-12) In these previous studies, rats ingested tea catechin at rates of 0.7 g/d/kg of body weight for 4 wk11) and 10 g/kg of diet for 3 wk,12) respectively. In the present study, in Experiment 1, rats ingested 618 or 481 ml/28d of green tea in the low- and high-catechin-concentration groups, respectively, volumes which contained about 198 or 741 mg/28d of catechin, respectively. In Experiment 2, rats ingested 586 or 528 ml/28d of green tea, respectively, which contained about 188 or 814 mg/28d of catechin, respectively (Table 1). In Experiment 1, the quantity of catechin ingestion was estimated to be about 0.042 and 0.157 g/d/kg of body weight on the 27-28th day of the experimental breeding in the low- and high-catechin-concentration groups, respectively, with consumption of about 0.38 and 1.47 g/kg of diet over 28 d, respectively. In Experiment 2, the quantity of catechin ingestion was estimated to be about 0.039 and 0.170 g/d/kg of body weight on the 27-28th day of the experimental breeding in the low- and high-catechin-concentration groups, respectively, with consumption of about 0.36 and 1.60 g/kg of diet over 28 d, respectively. The amount of catechin in green tea ingested in the present study was less than that in the above-mentioned studies; this may be why the serum total, and (VLDL+LDL)-cholesterol concentrations did not change.
The serum triglyceride concentration was not changed between groups that ingested low- and high-catechin-concentration green tea in either the cholesterol-free or the cholesterol-loaded diet. A previous
study has shown that catechin ingestion suppressed the increase in the triglyceride concentration in the blood after food ingestion by inhibiting the absorption of triglyceride from food.13) In this study, rats ingested a diet containing tea catechin with lipid emulsion, and the plasma triglyceride concentration was significantly suppressed 1 and 2 h after the catechin ingestion. This suppression effect was not seen 4 h or more after the catechin ingestion. In contrast, the plasma triglyceride concentration was not changed by the ingestion of a diet containing tea catechin without lipid emulsion. In the present study, the rats were able to ingest catechin-containing green tea until just before sacrifice and blood collection, although they were deprived of the food diet for 4 h before being sacrificed. The absorption of triglyceride from the diet was mostly completed, therefore, at the time of sacrifice, the serum triglyceride concentration might not have differed between the ingestion of low- and high-catechin-concentration green tea.
Both the TBARS values in the serum and liver were not changed between the low- and high-catechin-concentration groups in either the cholesterol-free or the cholesterol-loaded diet. A previous study has shown that a catechin-containing diet reduced the plasma TBARS value in rats.14) In this study, rats ingested an experimental diet supplemented with dietary flavonoids (quercetin + catechin, 2:1 wt/wt) at a rate of 8 g/kg of diet for 4 wk. The experimental diet was rich in polyunsaturated fatty acid containing eicosapentaenoic acid (EPA) and docosahexaenoic acid (DHA). In the present study, the fat used in the diet was soybean oil. The oleic acid and linoleic acid contents in the soybean oil were almost the same as in the above-mentioned experimental diet, but EPA and DHA were not contained in the soybean oil. The degree of fatty acid peroxidation in the present study was lower than that in the above-mentioned studies; therefore, the TBARS values in the serum and liver might not have changed between the low- and high-catechin-concentration groups.
In conclusion, the ingestion of green tea containing a high concentration of catechin decreased the perirenal adipose tissue weight, resulting in beneficial effects on the lipid metabolism. On the other hand, almost all of the lipid metabolism parameters measured in the present study were not significantly changed. Previous studies have demonstrated that tea catechin ingestion had beneficial effects on lipid metabolism such as the suppression of triglyceride accumulation,15) decrease in the concentration of cholesterol16) and triglyceride17) in the blood, and antioxidant activity18) in humans as well as in animals.9-14) Frequent catechin-containing green tea ingestion and taking an effective dose of tea catechin can have beneficial effects on lipid metabolism.
REFERENCES
1) Kakuda, T., Takihara, T., Sakane, I., and Mortelmans, K., Antimicrobial activity of tea extracts against periodontopathic bacteria, Nippon Nogeikagaku Kaishi, 68, 241-243 (1994).
2) Reeves, P. G., Nielsen, F. H., and Fahey, G. C. Jr., AIN-93 purified diets for laboratory rodents: Final report of the American Institute of Nutrition ad hoc writing committee on the reformulation of the AIN-76A rodent diet, J. Nutr., 123, 1939-1951 (1993).
3) Folch, J., Lees, M., and Sloane-Stanley, G. H., A simple method for the isolation and purification of total lipides from animal tissues, J.
Biol. Chem., 226, 497-509 (1957).
4) Zak, B., Simple rapid microtechnic for serum total cholesterol, Am. J.
Clin. Path., 27, 583-588 (1957).
5) van Handel, E., Suggested modifications of the micro determination of triglycerides, Clin. Chem., 7, 249-251 (1961).
6) Chen, P. S., Toribara, T. Y., and Warner, H., Microdetermination of phosphorus, Anal. Chem., 28, 1756-1758 (1956).
7) Yagi, K., A simple fluorometric assay for lipoperoxide in blood plasma, Biochem Med., 15, 212-216 (1976).
8) Mihara, M., and Uchiyama, M., Determination of malonaldehyde precursor in tissues by thiobarbituric acid test, Anal. Biochem., 86, 271-278 (1978).
9) Murase, T., Nagasawa, A., Suzuki, J., Hase, T., and Tokimitsu, I., Beneficial effects of tea catechins on diet-induced obesity:
stimulation of lipid catabolism in the liver, Int. J. Obes., 26, 1459-1464 (2002).
10) Ikeda, I., Hamamoto, R., Uzu, K., Imaizumi, K., Nagao, K., Yanagita, T., Suzuki, Y., Kobayash,i M., and Kakuda, T., Dietary gallate esters of tea catechins reduce deposition of visceral fat, hepatic triacylglycerol, and activities of hepatic enzymes related to fatty acid synthesis in rats, Biosci. Biotechnol. Biochem., 69, 1049-1053 (2005).
11) Raederstorff, D. G., Schlachter, M.F., Elste, V., and Weber, P., Effect of EGCG on lipid absorption and plasma lipid levels in rats, J. Nutr.
Biochem., 14, 326-332 (2003).
12) Kobayashi, M., Unno, T., Suzuki, Y., Nozawa, A., Sagesaka, Y., Kakuda, T., and Ikeda, I., Heat-epimerized tea catechins have the same cholesterol-lowering activity as green tea catechins in cholesterol-fed rats, Biosci. Biotechnol. Biochem., 69, 2455-2458 (2005).
13) Suzuki, Y., Unno, T., Kobayashi, M., Nozawa, A., Sagesaka, Y., and Kakuda, T., Dose-dependent suppression of tea catechins with a galloyl moiety on postprandial hypertriglyceridemia in rats, Biosci.
Biotechnol. Biochem., 69, 1288-1291 (2005).
14) Frémont, L., Gozzélino, M. T., Franchi, M. P., and Linard, A., Dietary flavonoids reduce lipid peroxidation in rats fed polyunsaturated or monounsaturated fat diets, J. Nutr., 128, 1495-1502 (1998).
15) Kajimoto, O., Kajimoto, Y., Yabune, M., Nakamura, T., Kotani, K., Suzuki, Y., Nozawa, A., Nagata, K., Unno, T., Sagesaka, Y. M., Kakuda, T., and Yoshikawa, T., Tea catechins with a galloyl moiety reduce body weight and fat, J. Health Science, 51, 161-171 (2005).
16) Kajimoto, O., Kajimoto, Y., Yabune, M., Nozawa, A., Nagata, K., and Kakuda, T., Tea catechins reduce serum cholesterol levels in mild and borderline hypercholesterolemia patients, J. Clin. Biochem.
Nutr., 33, 101-111 (2003).
17) Unno, T., Tago, M., Suzuki, Y., Nozawa, A., Sagesaka, Y. M., Kakuda, T., Egawa, K., and Kondo, K., Effect of tea catechins on postprandial plasma lipid responses in human subjects, Br. J. Nutr., 93, 543-547 (2005).
18) Suliburska, J., Bogdanski, P., Szulinska, M., Stepien, M., Pupek-Musialik, D., and Jablecka, A., Effects of green tea supplementation on elements, total antioxidants, lipids, and glucose values in the serum of obese patients, Biol. Trace Elem. Res., 149, 315-322 (2012).
和文要旨 異なる濃度のカテキンを含む緑茶摂取の血清および肝臓脂質レベルに対する影響をラットにおいて検討した。ラッ トには異なる濃度のカテキンを含む市販緑茶を,コレステロール無添加食およびコレステロール負荷食とともに与えた。コレステ ロール無添加食摂取時において,副睾丸脂肪組織重量ならびに腎周辺脂肪組織重量はいずれもカテキン濃度の異なる緑茶摂取間で 有意な差はみられなかった。一方,コレステロール負荷食摂取時において,高濃度カテキン含有緑茶の摂取により副睾丸脂肪組織 重量が減少の傾向を示し,腎周辺脂肪組織重が有意に減少した。血清コレステロール濃度は,コレステロール無添加食摂取時,コ レステロール負荷食摂取時のいずれにおいても,高濃度カテキンならびに低濃度カテキン含有緑茶の摂取による有意な違いはみら れなかった。血清トリグリセリド濃度が,コレステロール無添加食摂取時,カテキン濃度の異なる緑茶摂取間で有意な違いはみら れなかった。コレステロール負荷食摂取時において高濃度カテキン含有緑茶の摂取により低下の傾向を示した。血清チオバルビツ ール酸反応物質(TBARS)値は,コレステロール無添加食摂取時,コレステロール負荷食摂取時のいずれにおいても,高濃度カテ キンならびに低濃度カテキン含有緑茶の摂取による有意な違いはみられなかった。肝臓TBARS値が,コレステロール負荷食摂取時 において,カテキン濃度の異なる緑茶摂取間で有意な差はみられず,コレステロール無添加食摂取時において,高濃度カテキン含 有緑茶の摂取により減少の傾向を示した。これまでに,カテキンの摂取が動物同様ヒトにおいて脂質代謝に対して有用な効果をも たらすことが示されており,カテキン含有緑茶を頻繁に摂取することや効果的な用量で摂取することが脂質代謝に対して効果をも たらすと考えられる。
The ingestion of green tea containing a high concentration of catechin significantly decreased the perirenal adipose tissue weight as compared to the ingestion of green tea containing a low concentration of catechin. Furthermore, the epididymal adipose tissue weight in the high-catechin-concentration green tea group tended to be lower than that in the low-catechin-concentration green tea group in the cholesterol-loaded diet; the catechin might be considered to decrease the triglyceride accumulation. A previous study reported that tea catechin ingestion decreased the epididymal adipose tissue weight in a dose-dependent manner, and at the same time, the liver β-oxidation activity, related to fatty acid degradation, was stimulated in mice fed a high-fat diet.9) Another study found that, in rats, tea catechin ingestion decreased the visceral (epididymal, mesenteric, and perirenal plus retroperitoneal) adipose tissue weights as compared to the control group, and at the same time, the activities of fatty acid synthase and malic enzymes, related to fatty acid syntheses, were decreased.10) The decrease in the adipose tissue weight associated with the ingestion of high-catechin-concentration green tea seen in the present study might be due, at least in part, to the stimulation of β-oxidation activity and the suppression of fatty acid synthesis-related enzyme activities.
The serum total, HDL-, and (VLDL+LDL)-cholesterol concentrations were not changed between the low- and high-catechin-concentration groups in both the cholesterol-free and cholesterol-loaded diets. It is known that catechin decreases the total cholesterol concentration, especially the LDL-cholesterol concentration, in blood.11-12) In these previous studies, rats ingested tea catechin at rates of 0.7 g/d/kg of body weight for 4 wk11) and 10 g/kg of diet for 3 wk,12) respectively. In the present study, in Experiment 1, rats ingested 618 or 481 ml/28d of green tea in the low- and high-catechin-concentration groups, respectively, volumes which contained about 198 or 741 mg/28d of catechin, respectively. In Experiment 2, rats ingested 586 or 528 ml/28d of green tea, respectively, which contained about 188 or 814 mg/28d of catechin, respectively (Table 1). In Experiment 1, the quantity of catechin ingestion was estimated to be about 0.042 and 0.157 g/d/kg of body weight on the 27-28th day of the experimental breeding in the low- and high-catechin-concentration groups, respectively, with consumption of about 0.38 and 1.47 g/kg of diet over 28 d, respectively. In Experiment 2, the quantity of catechin ingestion was estimated to be about 0.039 and 0.170 g/d/kg of body weight on the 27-28th day of the experimental breeding in the low- and high-catechin-concentration groups, respectively, with consumption of about 0.36 and 1.60 g/kg of diet over 28 d, respectively. The amount of catechin in green tea ingested in the present study was less than that in the above-mentioned studies; this may be why the serum total, and (VLDL+LDL)-cholesterol concentrations did not change.
The serum triglyceride concentration was not changed between groups that ingested low- and high-catechin-concentration green tea in either the cholesterol-free or the cholesterol-loaded diet. A previous
study has shown that catechin ingestion suppressed the increase in the triglyceride concentration in the blood after food ingestion by inhibiting the absorption of triglyceride from food.13) In this study, rats ingested a diet containing tea catechin with lipid emulsion, and the plasma triglyceride concentration was significantly suppressed 1 and 2 h after the catechin ingestion. This suppression effect was not seen 4 h or more after the catechin ingestion. In contrast, the plasma triglyceride concentration was not changed by the ingestion of a diet containing tea catechin without lipid emulsion. In the present study, the rats were able to ingest catechin-containing green tea until just before sacrifice and blood collection, although they were deprived of the food diet for 4 h before being sacrificed. The absorption of triglyceride from the diet was mostly completed, therefore, at the time of sacrifice, the serum triglyceride concentration might not have differed between the ingestion of low- and high-catechin-concentration green tea.
Both the TBARS values in the serum and liver were not changed between the low- and high-catechin-concentration groups in either the cholesterol-free or the cholesterol-loaded diet. A previous study has shown that a catechin-containing diet reduced the plasma TBARS value in rats.14) In this study, rats ingested an experimental diet supplemented with dietary flavonoids (quercetin + catechin, 2:1 wt/wt) at a rate of 8 g/kg of diet for 4 wk. The experimental diet was rich in polyunsaturated fatty acid containing eicosapentaenoic acid (EPA) and docosahexaenoic acid (DHA). In the present study, the fat used in the diet was soybean oil. The oleic acid and linoleic acid contents in the soybean oil were almost the same as in the above-mentioned experimental diet, but EPA and DHA were not contained in the soybean oil. The degree of fatty acid peroxidation in the present study was lower than that in the above-mentioned studies; therefore, the TBARS values in the serum and liver might not have changed between the low- and high-catechin-concentration groups.
In conclusion, the ingestion of green tea containing a high concentration of catechin decreased the perirenal adipose tissue weight, resulting in beneficial effects on the lipid metabolism. On the other hand, almost all of the lipid metabolism parameters measured in the present study were not significantly changed. Previous studies have demonstrated that tea catechin ingestion had beneficial effects on lipid metabolism such as the suppression of triglyceride accumulation,15) decrease in the concentration of cholesterol16) and triglyceride17) in the blood, and antioxidant activity18) in humans as well as in animals.9-14) Frequent catechin-containing green tea ingestion and taking an effective dose of tea catechin can have beneficial effects on lipid metabolism.
REFERENCES
1) Kakuda, T., Takihara, T., Sakane, I., and Mortelmans, K., Antimicrobial activity of tea extracts against periodontopathic bacteria, Nippon Nogeikagaku Kaishi, 68, 241-243 (1994).