I Introduction
The aim of the DIRAC experiment[1] at CERN PS was to test the QCD, namely the standard theory in the strong interaction sector, in the non-perturbative region by measuring a hadronic atom A
ππ. The objective of the current study is actually an extension of the DIRAC experiment aiming at testing the QCD, where the quarks having strangeness flavor are involved. In reality, we shoot the nuclear target with a proton beam and identify the A
Kπatom produced, and then measure the life time of this exotic atom. As the production probability of this atom is very small, we need a very intense proton beam. In addition, we need a very powerful detector which can detect this rare strange object in the environment where a lot of background particles are present. Here, the 4-th dimensional topological trigger device that we have been developing plays an important role.
Detection of a strange meson and its life-time measurement − Test of QCD in the non-perturbative region
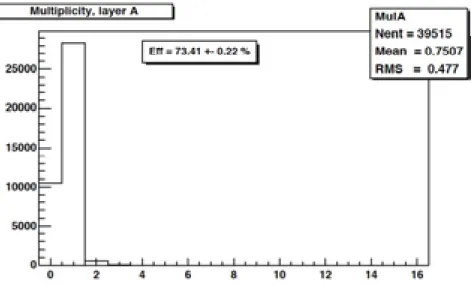
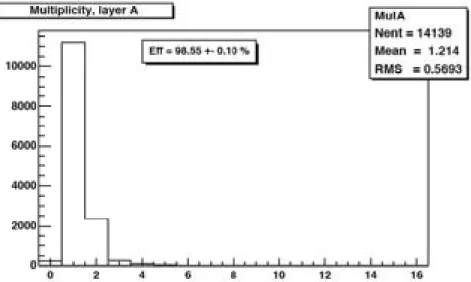
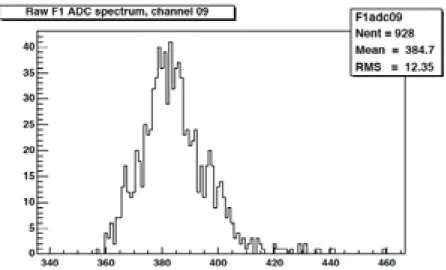
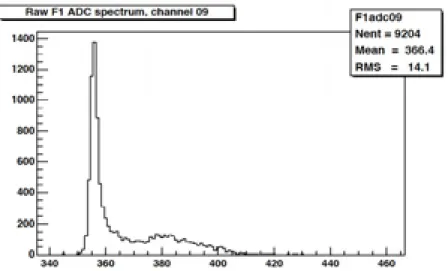
Test and tuning of the newSFD detectors at T11 beam line
(Progress report of the DIRAC-Japan group of Fiscal Year 2006)
Fujio TAKEUTCHI
1Masami CHIBA
2Alexander GORIN
3Kenji OKADA
1Andrey RYAZANTSEV
3Abstract
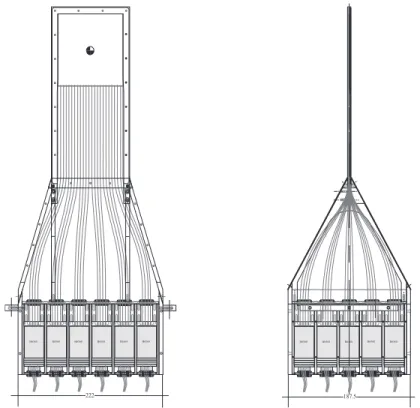
Extension of DIRAC experiment at CERN PS is approved for 3 years. The Japan group developed a new scintillating-fiber hodoscope for the new experiment, with a help of IHEP group, together with the silicon strip detectors among other things. In fiscal year 2007, a test and the tuning of the newly constructed hodoscopes, together with their new readout electronics, F1-TDC-ADC have been performed at T11 beam line of CERN PS.
!!!!!!!!!!!!!!!!!!
1
Faculty of Science, Kyoto Sangyo University, Kyoto, Japan
2
Physics Department, Tokyo metropolitan university, Tokyo, Japan
3