F E A T U R E
LINKING SEDIMENT TRANSPORT AND STRATIGRAPHY ON THE CONTINENTAL SHELF
By Patricia L. Wiberg, David A. Cacchione, Richard W. Sternberg and L. Donelson Wright
T H E GOAL OF THE SHELF sediment d y n a m i c s component of STRATAFORM is to link sediment transport processes active on the continental shelf to the formation and preservation of event beds in shelf sediment deposits. An approach combining shelf sediment-transport models with high-resolu- tion measurements of water-column and bed prop- erties over periods from several months to several years allows us to make quantitative estimates of bed modification caused by sediment resuspension during episodic transport events. These modifica- tions include erosion and deposition of bed mater- ial, formation of graded storm beds, and changes in small-scale bed surface morphology. The char- acteristics of the resulting "event bed" (thickness, grading, physical structures) are a function of flow and bed properties, depending on both temporal and spatial variations in sediment transport.
Sediment transport on the continental shelf de- pends on surface-wave conditions, bottom-bound- a r y - l a y e r currents, fluid stratification, and bed characteristics, including grain size, density, porosity, and surface roughness. In general, sedi- ment transport rates and depths of bed reworking are greatest when large, long-period waves occur simultaneously with strong, persistent currents.
Thus understanding the magnitude and frequency of transport requires knowledge of the wave and current conditions on the shelf over sufficiently long periods of time to develop statistical charac- terizations of the wave and current fields and to document the resulting resuspension and bed mod- ification. This information also provides critical
P.L. Wiberg, Dept. of Enviromnental Sciences, University of Virginia, Charlottesville, VA 22903. USA: D.A. Cacchione, U.S. Geological Survey, 345 Middlefield Rd., Menlo Park, CA 94025, USA; R.W. Sternberg, School of Oceanography, Uni- versity of Washington, Seattle, WA 98195, USA: L.D. Wright, Virginia Institute of Marine Science, College of William and Mary. Gloucester Point, VA 23062, USA.
input to, and tests of, shelf sediment-transport models that can be used to examine transport pat- terns over longer time scales and broader spatial scales. Toward this end, a field and modeling pro- gram has been initiated to examine transport pro- cesses on the shelf at the STRATAFORM site on the northern California, Eel shelf.
Observational Approach
Bottom-boundary-layer measurements of the re- sponse of sediment on the bed and in suspension to oceanographic forcing provide direct informa- tion on sediment movement under the influence of waves and currents at strategic locations within the transport pathway. A prominent feature of the Eel shelf is a mid- and outer-shelf silt deposit pro- duced in part by deposition associated with floods on the Eel River. The silt deposit grades into sand at the inner-shelf boundary of the deposit (between 50 and 60 m water depth), resulting in a region of sediment mixing where bottom sediment textures, sedimentary structures, and morphology alter and develop in response to changing wave and current velocities, up- and downwelling conditions, pycn- ocline strength, and variations in sediment supply by the river.
To characterize transport processes and bed re- sponse at this critical facies boundary, long-term measurements at one site and shorter-term inten- sive measurements at several sites have been un- dertaken using bottom-mounted instrument sys- tems. L o n g - t e r m m e a s u r e m e n t s at 60-m water depth along the S sampling transect (site $60, 4 0 - 5 3 . 3 N , 124-15.3W) (Nittrouer and Kravitz, 1996, this issue) began in September 1995, and will continue for a m i n i m u m o f 3 y. Intensive measurements of the bottom boundary layer and seabed were made during the winter storm season of 1995-1996 (December-March). These measure- ments were made along a cross-shelf transect com- prising a 50-m-deep inner-shelf site on a silty-sand bed, a 60-m-deep site in the sand/silt transition
• . . to link sediment transport processes active on the conti- nental shelf to the formation and preservation of event b e d s . . .
OCEANOGRAPHY'VoI. 9, No. 3"1996 153
/ - ~ plan of rapid-re- s p o n s e s e a b e d s a m - piing . . . m a k e s it possible to relate m e a s u r e d t r a n s p o r t to o b s e r v e d bed modification.
zone, and a 70-m site within the silt deposit. Each b o t t o m s y s t e m records wave v e l o c i t i e s , current and s u s p e n d e d - s e d i m e n t - c o n c e n t r a t i o n p r o f i l e s , temperature, salinity, and bottom elevation. Simul- taneous measurements along this transect allow us to e x a m i n e the d e p e n d e n c e of transport on sub- strate type, variations in seabed response, correla- tion of net deposition and erosion among sites, and cross-shelf divergences in near-bed flow and trans- port. A plan o f r a p i d - r e s p o n s e seabed s a m p l i n g following a large transport event, in addition to the ongoing monitoring of seabed characteristics over the shelf, m a k e s it p o s s i b l e to relate m e a s u r e d transport to observed bed modification.
Seabed properties along the cross-shelf transect range from sandy, rippled beds on the inner-shelf to silty, bioturbated beds on the mid-shelf. These changes in sediment texture and surface morphol- ogy across the transect, as well as changes at each site during transport events, affect bed roughness, and hence near-bed flow and shear stress, thresh- old of sediment motion, and preserved s e d i m e n - tary structures. To u n d e r s t a n d these c h a n g e s in bottom roughness, the intensive field experiment includes seabed surface and subsurface imaging, quantitative characterization of bottom roughness scales, and detailed analysis of core samples.
Observational Results
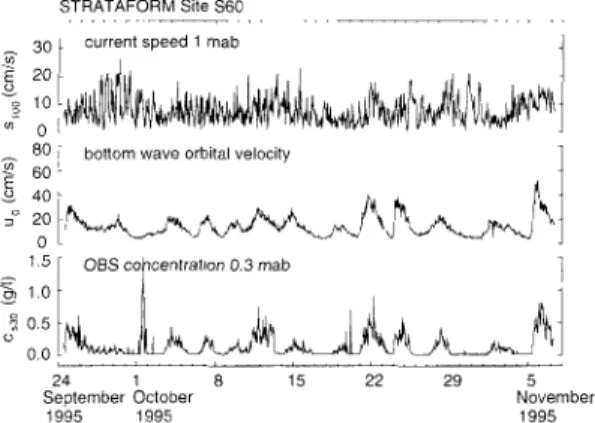
Some results from the first deployment period at the monitoring site ($60) 21 September 1995 to 10 N o v e m b e r 1995, are shown in Figure 1. The top panel presents current speed 1.0 meter above the seabed (mab), which varies from 0 to 30 cm s '. The middle panel shows the bottom wave or- bital v e l o c i t i e s c a l c u l a t e d for 60-m water depth from surface-wave spectra measured by National
STRATAFORM Site S60
~ 30f ... t speed 1 mab J
m O
20 °" bo. ... bi'* vo,oo,,, t\lt
~ 6° L
~- 1.5 f OBS
colcen~ral~on
0,3 mab ie 0.0 [t
24 1 8 15 22 29 5
September October November
1995 1995 1995
Fig. 1: Measttred tinze series o[ current ,v~eed 1.0 m above the seabed (mob) (top panel), bottom wave-orbital velocity (middle panel), and sus- pended-sediment concentr~ttion 0,3 mab measured by the extended-duration tripod at site $60 (60-m water depth). The good correlation between high bottom-wave velocities and high suspended-sedi- ment concentrations suggests resuspension by high bottom stresses.
Data Buoy Center (NDBC) Buoy 46022 on the Eel margin: these values correlate very well with pres- sure variance c a l c u l a t e d for each burst from the tripod data. The bottom panel has the hourly sus- p e n d e d - s e d i m e n t c o n c e n t r a t i o n 0.3 m a b , which ranges from zero to >1 g 1 ' over the selected data record.
The time series o f suspended-sediment concen- tration illustrates the energetic nature o f the Eel continental shelf and the significant sediment re- sponse. Over the first 45-day record, 13 identifi- able sediment suspension or transport events oc- c u r r e d , each l a s t i n g an a v e r a g e o f - 2 d a y s . A d d i t i o n a l l y , the data show a strong c o r r e l a t i o n b e t w e e n b o t t o m wave velocities and s u s p e n d e d - sediment concentrations. The only exception is the brief high-concentration event on 1 October. Dur- ing this time measurements by an optical backscat- ter sensor (OBS) 1 mab indicate no s e d i m e n t in suspension, suggesting that something may have temporarily blocked the lower (0.3 mab) OBS sen- sor resulting in spurious high values.
The observed correlation between surface-wave action and bottom-sediment resuspension events is c o n s i s t e n t with o b s e r v a t i o n s f r o m a n u m b e r o f other shelf settings (e.g., Drake and C a c c h i o n e , 1985; C a c c h i o n e and Drake, 1990: L y n e et al., 1990; Sherwood et al., 1994) where large surface w a v e s are required to p r o d u c e values o f b o t t o m stress large enough to initiate transport. In these locations, the c o i n c i d e n t b o t t o m - b o u n d a r y - l a y e r currents govern the distribution of the sediment in the water column and the speed and direction of transport. During the period of this initial 45-day record, d i s c h a r g e s from the Eel River were uni- f o r m l y low, with an a v e r a g e value o f 5.8 m ~ s ' and a maximum value of 7.8 m 3 s '.
As part of the intensive cross-shelf deployment o f b o t t o m t r i p o d s , the U.S. G e o l o g i c a l S u r v e y ( U S G S ) G E O P R O B E t r i p o d ( C a c c h i o n e and Drake, 1990) was d e p l o y e d at 52-m water depth along the S s a m p l i n g line (site $50, 4 0 - 5 3 . 0 N , 124-13.9W) on 7 D e c e m b e r 1995 and recovered on 8 J a n u a r y 1996. The t r i p o d was then r e d e - p l o y e d at the same site as part of the c r o s s - s h e l f t r a n s e c t o f b o t t o m m e a s u r e m e n t s m a d e d u r i n g J a n u a r y - M a r c h 1996. An energetic storm passed t h r o u g h the r e g i o n d u r i n g 1 0 - 1 3 D e c e m b e r 1995. N D B C B u o y 4 6 0 2 2 r e c o r d e d s u s t a i n e d , southerly to southeasterly winds in excess of 40 knots and w a v e s >10 m d u r i n g this storm. The t r i p o d d a t a s h o w n in F i g u r e 2 d e m o n s t r a t e the large w a v e and c u r r e n t v e l o c i t i e s oll the i n n e r s h e l f a s s o c i a t e d w i t h this storln. T h e top two panels in Figure 2 show hourly averaged current v e c t o r s and s i g n i f i c a n t b o t t o m w a v e s p e e d s at the uppermost sensor ( - 1 . 2 m above the bottom) over an 8-day period including the storm. Currents during the storm were consistently from the south- southeast and reached maximum speeds of - 6 5 cm s ~ on 12 D e c e m b e r . N e a r - b o t t o m w a v e s p e e d s
154 OCEANOC;R,XPHY'VoI. 9, NO. 3 " 1 9 9 6
STRATAFORM Site S50 60 r current velocitylt.2 mab
80 ~ bottom wave orbital velocity
4o
"~
2o ~ . / ' ~ ~ < ~ " ~ T w ~ ' ~ " - ° ' - - ~ , > . . _ ~ t0 L
30 beam att . . . . t,on 1.Smab j
0 2 5 -
20 t bed elevation / ~ . _ . ~ f ~ ~ . ~ _ . . ~
-
0 ~t
"g 4 Eel River discharge~.~.
O 0
10 11 12 13 14 15 16 17 18
December1995
Fig. 2: Measured time series of current veloci O' 1.2 m above the seabed (mab) (top panel; along- shelf flow corresponds to a vertical vector), bot- tom wave-orbital velociU (2nd panel), beam at- tenuation measured 1.8 mab (3rd panel), and bed elevation (4th panel) measured by the GEO- PROBE at site $50 (50-m water depth) during a storm in mid-December 1995. Water discharge )Crom the Eel River is shown in the bottom panel.
Maximum suspended-sediment concentration lags behind peak bottom wave velocity during this storm, suggesting that sediment advecting past the tripod is contributing to the measured turbidity.
Sediment introduced to the shelf during the Eel River,lToods shown in the bottom panel could be the source of the advected sediment.
were ~80 cm s ' during the peak of the storm on 12 December, with instantaneous recorded speeds in excess of 110 cm s-'. Maximum wave speeds lag the peak average currents by - 4 h.
Beam attenuation determined from one of three light-emitting diode transmissometers mounted on the tripod achieved m a x i m u m saturation values (-30 attenuation units) several times during the 8- day period (Fig. 2). The highest values of beam attenuation, and therefore turbidity, during the storm occurred early on 13 December ~12 h after the peak wave speeds. This lag in highest concen- trations o f suspended sediment relative to peak wave conditions suggests that the materials caus- ing the highest values of turbidity were advected into the tripod location rather than resuspended by high wave-induced stresses. In fact, on 16 Decem- ber a prolonged period of high turbidity occurs during waning near-bottom wave velocities. This relationship suggests that although some local re- suspension of bottom sediment would be caused by large wave stresses (note the rise in beam at-
tenuation at about 1600 on 12 Decenaber). advec- tion of suspended materials from other locations to the tripod site dominates the measured turbidity during tiffs period.
Further indirect evidence for an advected sedi- ment component to the beam attenuation record comes fi'om the discharge record for the Eel River.
The hourly record of discharge from the USGS gauging station on the Eel River at Scotia, CA, during the December storm is shown in the bot- tom panel of Figure 2. Discharge peaked twice during this 8-day period, reaching a maximum of 3.8 × I0 ~ m ~ s ~. Discharge was also high on the Mad River to the north of the deployment sites.
USGS sediment discharge measurements for the Eel River at comparable winter river discharge levels indicate suspended-sediment concentrations in the river would be on the order o f 1-10 g 1 ' during these floods (Wheatcroft et al., 1997).
Large pulses of riverine sediment introduced to the shelf during the December storm may account for the large sediment concentrations recorded by the G E O P R O B E in the absence of large waves, e.g., 15-16 December 1995.
A notable feature of the December storm at the G E O P R O B E site ($50) is the large and rather rapid apparent rise in bed elevation as determined from the measurements of the sonic altimeter (Fig.
2). Although this change in apparent bed elevation coincides with a period of high river discharge, de- position of river-derived material is not likely to account for a change in bed elevation of this mag- nitude (15-20 cm). Detailed measurements follow- ing a much larger flood e\,ent on the Eel River in January 1995 reveal a flood deposit on the shelf with a maximum thickness of 8.5 cm (Wheatcroft et al.. 1996, this issue). The bed shear stresses dur- ing the nearly coincident peak wave and current conditions at the 50-m site are large enough to transport fine sand as bedload. Thus, one interpre- tation of the apparent rise in bed elevation is that a sand wave migrated into the measurement zone of the tripod. Alternatively, the altimeter could be sensitive to high near-bed sediment concentrations.
Measurements of small-scale surface roughness elements and of the characteristics of the upper- most 1 0 - 2 0 cm of the bed, including sediment texture and physical and biogenic structures, be- fore and after a transport event such as the one shown in Figure 2, are being collected to docu- ment processes such as bed reworking and bed- form migration (Wheatcroft et al., 1996, this issue). These observations provide the link be- tween the water-column processes measured by the bottom tripods and the formation and charac- teristics of event beds that may ultimately be in- corporated into the sedimentary record.
Modeling Approach
A direct relationship between sediment-trans- port processes active on m o d e r n continental
• . . materials caus- ing the highest val- ues of turbidity were advected into the tri- pod location rather than resuspended • . .
OCE,\YOGaAVH¥.VoL 9, No. 3.1996 155
• . . it is n e c e s s a r y t o c h a r a c t e r i z e s e d i - m e n t t r a n s p o r t a n d b e d
reworking
o v e ra s l o n g a t i m e s c a l e a s p o s s i b l e . . .
shelves and the resultant fine-scale stratigraphy can be made using process-based bottom-bound- ary-layer flow and sediment-transport models that account for changes in bed sediment-size distribu- tions and small-scale bed morphology over the course of transport events. A one-dimensional shelf transport model incorporating these bed-re- lated processes has been shown to compare well with water-column measurements of flow and re- suspension at other sites on the northern and southern California shelf (e.g., Wiberg et al., 1994). However, the STRATAFORM bed-sam- pling studies provide the first direct measurements of bed characteristics before and after measured resuspension events to test aspects of the model important to strata formation, including event-bed thickness, grading, and sedimentary structures at sandy and silty sites.
One of the advantages of coupling a modeling study with a field study of shelf sediment transport and event-bed formation is that the model can be used to examine patterns of transport and bed modification over considerably larger temporal and spatial scales than generally are resolved in a field study, provided the necessary model inputs can be specified. As input, the model requires near-bottom wave speeds, current velocity at some level in the bottom boundary layer, and bed sedi- ment characteristics. Largely because of the lim- ited duration of most shelf studies, the resuspen- sion events captured in existing field data are typically representative of transport events with 1-2 y recurrence times. To make the link to stratigraphy, it is necessary to characterize sedi- ment transport and bed reworking over as long a time scale as possible to include the widest possi- ble range of transport events.
The extended duration observations on the shelf will provide >3 y of measured waves, currents, and resuspension. To estimate transport over longer time scales, the shelf transport model is being used in conjunction with hourly measure- ments of surface-wave spectra on the Eel margin recorded by NDBC wave buoys since 1982. These data provide the information necessary to obtain a nearly 15-y record of bottom wave characteristics (orbital velocity and period) across the whole Eel shelf. Wave-driven transport events can be identi- fied in these time series using threshold wave-ve- locity criteria developed from bottom tripod data like those in Figure 1. This approach yields a set of transport events large enough to begin to make statistical characterizations of important factors, including peak orbital velocity versus return pe- riod and the frequency and duration of wave-dri- ven resuspension events, at different depths across the shelf and slope. Figure 3 shows the cross-shelf distribution of near-bottom wave speeds computed from NDBC Buoy 46022 during the December 1995 storm. Values of near-bed orbital velocity in the range of 10-20 cm s -' are generally sufficient
D ~ u , -
I - - 1-10 crnls I
,v
Fig. 3: Bottom wave-orbital velocity during the December 1995 storm for depths on the Eel shelf ranging from the inner shelf (30 m) to the upper slope (400 m). Wave velocities were computed using surface-wave spectral data from N D B C Buoy 46022. Bottom wave velocities in the range of lO-20 cm s -~ (blue band) generally are sufficient to resuspend the finer bed fractions on the shelf
to resuspend the finer fractions of the bed surface sediments. The time series in Figure 3 illustrates the variability in the maximum depth of resuspen- sion over the course of this storm•
Future Work
The prominence of the January 1995 flood de- posit in the surficial sediments of the Eel shelf and the strong indication in the GEOPROBE record (Fig. 2) for advection of river-derived sediment during a period of simultaneously high river dis- charge, waves, and currents in December 1995 un- derscores the importance of flood events to trans- port and bed characteristics on the Eel shelf• A field and modeling study to characterize the dy- namics of the fiver sediment plume and the deliv- ery of sediment to the bottom boundary layer and bed is now beginning. The field component of this study will include a second winter deployment of bottom tripods at sites closer to the river mouth and arrayed along the axis of the present silt de- posit on the shelf• In addition, the analysis of cross-shelf transport during the period of simulta- neous near-bed measurements at $50, $60, and
$70 during the winter of 1996 is underway.
The sediment deposited on the shelf as a result of the January 1995 Eel River flood is very fine- grained (Wheatcroft et al., 1996, this issue).
Near-bottom suspended-sediment concentrations reach several 10ths of a gram per liter during the typical resuspension events illustrated in Figure 1.
In-situ suspended sediment samples collected 0.22 mab by the G E O P R O B E during the D e c e m b e r 1995 deployment, when beam-attenuation mea- surements at site $50 were high or off scale, range from - 1 - 3 g 1' (D.E. Drake, personal communication). At these high concentrations,
156 OCEANOGRAPHY'Vo1. 9, NO. 3"1996
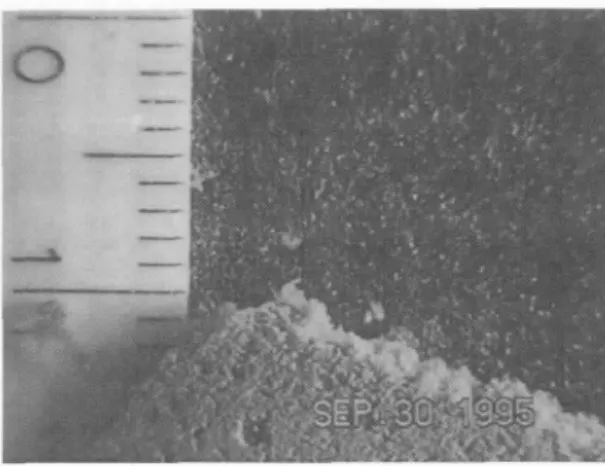
Fig. 4." Floc-camera image o f flocculated particles in s u s p e n s i o n a n d already deposited at site $60.
The scale on the left o f the image is in increments o f l mm.
f i n e - g r a i n e d s e d i m e n t s h o u l d b e f l o c c u l a t i n g to f o r m l a r g e r a g g r e g a t e p a r t i c l e s in the w a t e r c o l - u m n , thereby s i g n i f i c a n t l y i n c r e a s i n g the settling rate and d e c r e a s i n g the t r a n s p o r t d i s t a n c e o f the s e d i m e n t . T h i s p o s s i b i l i t y is s u p p o r t e d by v i d e o - c a m e r a i m a g e s ( S t e r n b e r g et al., 1996) o f f l o c - like particles at the 6 0 - m e x t e n d e d - d u r a t i o n tripod site (Fig. 4). F l o c - c a m e r a i m a g e s and in-situ par- t i c l e - s i z e data f r o m the e x t e n d e d - d u r a t i o n tripod on the E e l R i v e r s h e l f will p r o v i d e data on parti- c l e c h a r a c t e r i s t i c s o v e r a r a n g e o f r e s u s p e n s i o n and f l o o d e v e n t s w i t h w h i c h to assess the i m p o r - tance o f this process. In addition, the f l o c c u l a t i o n m o d e l o f Hill and N o w e l l (1995) will be c o u p l e d to the s h e l f s e d i m e n t - t r a n s p o r t m o d e l to e v a l u a t e the e f f e c t o f f l o c c u l a t i o n o n the structure o f sus- p e n d e d - s e d i m e n t p r o f i l e s and the a g r e e m e n t b e - t w e e n c a l c u l a t e d and m e a s u r e d s u s p e n d e d - s e d i - m e n t concentrations.
Acknowledgements
F u n d i n g for this r e s e a r c h was p r o v i d e d by the G e o l o g y and G e o p h y s i c s P r o g r a m o f the Office o f N a v a l Research. T h e authors thank the m a n y peo- p l e w h o h e l p e d in t h e f i e l d , i n c l u d i n g G e o r g e T a t e , J o a n n e T h e d e , R i c k V i a l l , A n d r e a O g s t o n , B o b G a m m i s c h , F r a n k F a r m e r , and the c r e w s o f
t h e W e c o m a a n d P a c i f i c H u n t e r . D a v i d D r a k e , C h a r l e s N i t t r o u e r , a n d J o s e p h K r a v i t z p r o v i d e d helpful editorial c o m m e n t s on an earlier version o f this p a p e r . D a v i d D r a k e k i n d l y p r o v i d e d G E O - P R O B E b a g - s a m p l e c o n c e n t r a t i o n s f o r t h e D e - c e m b e r storm. C o u r t n e y H a r r i s assisted w i t h the w a v e analysis. W a v e b u o y data for the E e l margin w e r e o b t a i n e d f r o m t h e N D B C w o r l d - w i d e w e b site at seaboard.ndbc.noaa.gov.
References
Cacchione, D.A. and D.E. Drake, 1990: Shelf sediment trans- port: an overview with applications to the northern Cal- ifornia continental shelf. In: The Sea, vol. 9. B. Le Mehaute and D. Hanes, eds., John Wiley and Sons, New York, 729-773.
Drake, D.E. and D.A. Cacchione, 1985: Seasonal variation in sediment transport in the Russian River shelf, Califor- nia. Cont. Shelf Res. 4, 495-514.
Hill, P.S. and A.R.M. Nowell, 1995: Comparison of two mod- els of aggregation in continental-shelf bottom boundary layers..L Geophys. Res. 100, 22, 749-763.
Lyne, V.D., B. Butman and W.D. Grant, 1990: Sediment movement along the U.S. east coast continental shelf.
II. Modelling suspended sediment concentration and transport during storms. Cont. ShelfRes., 10, 429--460•
Nittrouer, C.A. and J.H. Kravitz, 1996: STRATAFORM: a program to study the creation and interpretation of sedi- mentary strata on continental margins. Oceanography, 9, 146-152.
Sherwood, C.R., B. Butman, D.A. Cacchione, D.E. Drake, T.F.
Gross, R.W. Sternberg, P.L. Wiberg and A.J. Williams, III, 1994: Sediment-transport events on the northern California continental shelf during the 1990-1991 STRESS experiment. Cont. Shelf Res., 14, 1063-1099.
Sternberg, R.W., A. Ogston and R. Johnson: A video system for in-situ measurement of size and settling velocity of suspended particles, 1996. In: In Situ Measurements of Suspended Matter Particle Size and Settling Velocity.
D. Eisma, ed. Netherlands J. Sea Res., Vol. 36, In press.
Wheatcroft, R.A., J.C. Borgeld, R.S. Born, D.E. Drake, E.L.
Leithold, C.A. Nittrouer and C.K. Sommerfield, 1996:
The anatomy of an oceanic flood deposit. Oceanogra- phy, 9, i58-162.
_ _ . , C.K. Sommerfield, D.E. Drake, J.C• Borgeld and C.A.
Nittrouer, 1997: Rapid and widespread dispersal of flood sediment on the northern California continental margin. Geology, Vol. 25, In press.
Wiberg, P.L., D.E. Drake and D.A. Cacchione, 1994: Sediment resuspension and bed armoring during high bottom stress events of the Northern California inner continen- tal shelf: measurements and predictions. Cont. Shelf Res., 14, 1191-1219. FI
• . . fine-grained s e d i m e n t should be flocculating to form larger a g g r e g a t e par- ticles . . .
OCEANOORAPHV'Vo1. 9, No. 3"1996 157