数値的に生成された竜巻状の渦の性質
丸山 敬
要 旨
竜巻の渦内の気流性状や渦と物体との相互作用を明らかにすることを目的に,数値計算 手法を用いて竜巻状の渦の作りだす数値シミュレーターを作成し,計算条件を変化させて, 種々の形態をもった竜巻状の渦を作り出した。本報では,作り出された渦の生成条件や渦 内の気流性状について報告する。キーワード
: 竜巻状の渦,数値シミュレーター,気流性状,生成条件1. はじめに
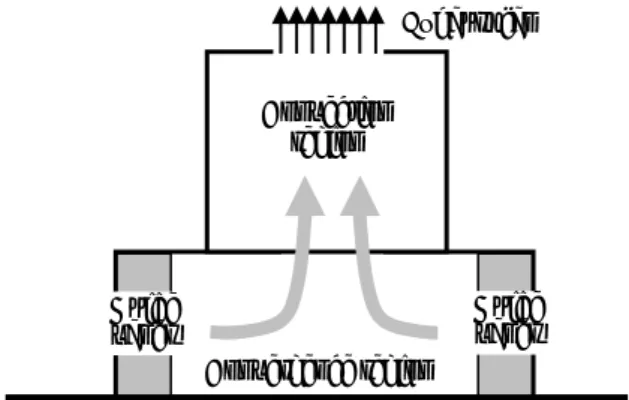
竜巻の渦内の気流性状や渦と物体との相互作用を 明らかにすることを目的に,丸山(2008)は数値計 算手法を用いて竜巻状の渦の作りだす数値シミュレ ーターを作成した。このシミュレーターはChurchら (1979)や文字ら(1982, 1983)が用いた竜巻発生装 置に準じ,Fig.1に示すような対流域と収束域をもち, 解析領域の形状や境界条件などの計算条件を変化さ せて,種々の形態をもつ竜巻状の渦を作り出すこと ができる。本報では,作り出された種々の渦の生成 条件や渦内の気流性状について報告する。2. 数値シミュレーターの概要
数値計算には差分法を用いて支配方程式を離散化 し,Fig.2に示すような直交座標系を用いている。乱 流モデルにはラージエディシミュレーション(LES) を用い,計算コードにはRIAM-COMPACT(内田ら 2004)を一部改造したものを用いた。解析領域は竜 巻発生装置を模擬したもので,上部に吸い出し口を もつ円筒形の対流域,下部に正方形水平断面をもつ 直方体の収束域をもつ。計算条件,すなわち,上部 吸い出し口の大きさRtや風速W0,円筒形状の対流 域の高さHcや半径Rcvt,収束域との繋ぎ目の開口部 の半径Rud,収束域の高さHd,および幅2 。また,D 収束 域の 側面 境界 条件 ,す なわ ち, 固体 壁面 境界 (non-slip boundary)条件 ,自由 流入 出 境界(free boundary)条件,および風速を与える境界(Dirichlet boundary)条件を組み合わせることによって種々の 性質をもった竜巻状の渦を作り出すことができる。 なお,Churchら(1979)や文字ら(1982, 1983),そ の他多くの実験室における竜巻発生装置では,渦形 成のための速度シアーをガイドベーンにより収束域 へ供給しているが,本シミュレーションでは収束域 の側面境界条件により速度シアーを供給しており, ガイドベーンは用いていない。計算手法の詳細は丸 山(2008, 2009)を参照されたい。3. 作り出された渦
解析領域の形状や収束域の側面境界条件を変化さ せることにより種々の形態をもった竜巻状の渦を発 生させること が可能である 。Fig.3に対流域の半径 cvt R による渦の変化の例を挙げる。 cvt R が最も小さく0.15mのとき,渦は3.1節に述べ るような1セル型の渦となるが,Rcvtを大きくして いくと図に示すように接線風速は小さくなり,接線Fig. 1 Laboratory tornado simulator Convection region Exhaust fan Guide vanes Convergence region Guide vanes 京都大学防災研究所年報 第 53 号 B 平成 22 年 6 月
Dirichlet boundary condition Free boundary condition Non-slip boundary condition
Fig. 2 Configuration of numerical tornado simulator
Snapshot of a generated tornado-like vortex Convection
region
Coordinate system of calculation region and mesh discretization
D
2
c H d H t R cvt R Rud Exhaust outlet W0 U X W Z Y VD
2
Convergence region 0 0.6 0 0.6 0 0.6 0 X (m) 0.6 cvt R = 0.15m Rcvt = 0.30m Rcvt = 0.45m Rcvt= 0.60m b. Variation of mean vertical wind speed W/W0 distribution in a vertical center plane.05 0 0 0 0 .05 .05 0.1 0.1 .05 .05 0 0 0 0 0 .05 .05 0.1 0.1 .05 0 0 0 0.1 0.1 0.1 .05 .05 .05 .05 0 0 0 .05 0.1 0.1 .05 0.1 0.1
Fig. 3 Variation of wind fields with the width of convection region
c. Variation of azimuthally averaged mean values of tangential speed Vt, radial speed Vr, vertical speed W and differential pressure PΔ from the surrounding mean pressure as a function of radial distance R at Z=0.015m 0 0.1 0.2 0.3 0 0.2 0.4 0.6 0 0.2 0.4 0.6 0 0.2 0.4 -0.24 -0.16 -0.08 0 0 0.2 0.4 0.6 2P/ρUo2 R (m)) (m R t V /W0 r V /W0 W/W0 2 tmax / 2ΔP ρV ΔP cvt R = 0.15m Rcvt = 0.30m Rcvt = 0.45m Rcvt= 0.60m cvt R = 0.15m Rcvt = 0.30m Rcvt = 0.45m Rcvt= 0.60m a. Snapshots of instantaneous contours of low pressure regions and wind vectors
風速の最大値をとる半径はわずかに大きくなる。渦 中心部においてもRcvtが大きくなるにつれて時間平 均風速の下降流域もFig.3b中明るい灰色の領域で示 すように大きくなって,3.2節に示す2セル型の渦に 変わっていく。 以下では,生成された渦のうち,代表的な形態を もった渦を概観する。
3.1 1セル型の渦
渦の中心部に風速の時間平均値で鉛直方向W 成 分が負の値をもたず,下降流となる領域をもたない, いわゆる1セル型と呼ばれる渦が,Fig.4に示すよう な計算領域の形状と,収束域の側面境界条件により 生成される。計算領域の形状,および収束域の側面 境界条件はキャプションの通りで,計算領域内の最 大接線風速Vtmaxおよび最大接線風速半径Rtmaxによ り 2 0 tmax 2 tmV / RW R π t π と定義されたスワール比Sw ,およ びレイノルズ数Re=VtmaxRtmax/ν の値を示す。ここ で,ν は空気の動粘性係数で1.5×10⁻⁵とした。 この形態の渦では,図中渦中心部分の低圧部分を 示した青色の等値面が,地面から上部の吸い出し口 までほぼ一定の径をもった円筒形となり,途中の曲 がりも小さく,渦の中心もほぼ一定の位置にとどま って時間的な変動も少ない。地面付近の風速ベクト ルもほぼ定常で,乱れも小さい。3.2 2セル型の渦
渦の中心部に風速の時間平均値で鉛直方向W 成 分が負の値をもち,下降流となる領域をもつ,いわ ゆる2セル型と呼ばれる渦が,Fig.5に示すような計 算領域の形状と,収束域の側面境界条件により生成 される。 この形態の渦では,渦中心部分の低圧部分の等値 面が地面から対流域に少し入ったところまでほぼ一 定の径をもった円筒形となっているが,それより上 方では乱れて時間的に変動している。また,地面付 Fig. 4 Configuration and boundary conditions of calculation region with plots of instantaneous contours of low pressure regions and wind vectors near the ground ; single core type without mean down flow region in the core Rt=0.05m, Rcnv=0.15m, Rud=0.15m,Hc=0.6m, Hd=0.2m, D=0.6m, Wo=1.0m/s, Vtmax=0.31m/s, Sw=0.4, Re=620Dirichlet boundary condition free boundary condition
non-slip boundary condition
Fig. 5 Configuration and boundary conditions of calculation region with plots of instantaneous contours of low pressure regions and wind vectors near the ground ; single core type with mean down flow region in the core Rt=0.05m, Rcnv=0.6m, Rud=0.15m, Hc=0.6m, Hd=0.2m, D=0.6m, Wo=1.0m/s, Vtmax=0.25m/s, Sw=0.5, Re=760
Dirichlet boundary condition free boundary condition
近でも低圧部分の中心は時間的に移動し,周囲の風 速ベクトルも変動が大きくなっている。
3.3 多重渦型の渦
渦の中心部に圧力の低圧部が複数存在する多重渦 型の渦が,Fig.6に示すような計算領域の形状と,収 束域の側面境界条件により生成される。 この形態の渦では,計算領域の中心部分に圧力の 低圧部分が複数発生し,時間とともに渦の回転方向 に回転している。局所的な低圧部分は地面付近でそ れぞれ核を形成しているが,その数は時間とともに 2から5程度に増減している。この低圧部分の核周 りに副次渦の形成が観察されるが,水平方向の最小 計算格子間が副次渦の直径の約1/10程度であるため, 副次渦内の渦が明瞭に判別できるほどの風速ベクト ルは得られていない。また,地面付近の風速ベクト ルは前述の1セル,2セルの渦に比べて風向風速と もに大きく変動している。3.4 渦中心付近の低圧部の等圧面が螺旋状に
ねじれた渦
渦中心付近の低圧部の等圧面が,螺旋状にねじれ た渦がFig.7に示すような計算領域の形状と,収束域 の側面境界条件により生成される。 この形態の渦では,計算領域の中心部の低圧部分 が螺旋状に渦の回転方向に回転している。時間平均 的にみると,流は地面付近で渦中心に向って吹き込 み,螺旋状の低圧部分に沿って上方外側に向って広 がりながら吹き出している。その内部,渦中心付近 には上空で下降流の領域が存在する。地面付近の風 速ベクトルは渦中心付近で風向風速ともに大きく変 動している。Fig. 7 Configuration and boundary conditions of calculation region with plots of instantaneous contours of low pressure regions and wind vectors near the ground ; swirling core type
Rt=0.05m, Rcnv=0.60m, Rud=0.15m, Hc=0.8m, Hd=0.1m, D=0.6m, Wo=2.0m/s, Vtmax=0.36m/s, Sw=1.1, Re=1660 Dirichlet boundary condition
non-slip boundary condition
Fig. 6 Configuration and boundary conditions of calculation region with plots of instantaneous contours of low pressure regions and wind vectors near the ground ; multiple core type
Rt=0.05m, Rcnv=0.60m, Rud=0.15m, Hc=0.8m, Hd=0.1m, D=0.6m, Wo=1.0m/s, Vtmax=0.28m/s, Sw=1.5, Re=1800 Dirichlet boundary condition
free boundary condition non-slip boundary condition
4. 2セル型の渦内の気流性状
前述の種々の形態の渦のうち,自然界では3.2節で 取り上げた2セル型の渦が多く観察されると考えら れるので,本章では2セル型の渦内の気流性状につ いて詳しくみる。 地面付近の渦内外の気流性状を,Fig.8に示すよう に接線方向風速V ,半径方向の風速t V ,鉛直方向r 風速W で評価し,時間平均値および最大値,最小値 の鉛直面内の分布を調べる。各値は円周方向に平均 した値,および,円周方向の最大値,最小値を求め 領域内の最大接線風速Vtmaxにより,各軸は最大接線 風速半径Rtmaxにより無次元化してFig.9に示す。 図より,接線方向風速V ,鉛直方向風速 W ともに,t 地面から少し離れたところで最大値をとるが,半径 方向風速V はそれよりも地面近くで最も強くなり,r その向きは渦の中心に向う風向(負の値)となって いる。また,接線方向風速が最大値をとる付近では 中心から外向きに向い,対応してFig.9bに示すように 径方向からの風向角αが90度よりも小さくなる。そ の他の部分,すなわち,地面付近および渦中心部の 大部分では,風向角が90度より大きくなり風向は渦 中心に向う。また,半径方向風速V の最大値が生じr る高度は接線方向風速,鉛直方向速が最大値をとる 高度よりも上方になる。各高さで,接線方向風速が 最大値をとる半径R は地面付近で高さとともに大tm きくなる(Fig.9cに破線で示す)が,Z/Rtmax=0.8付 近で最大値をとったあと少し小さくなり,Z/ Rtmax =1.2以上ではほぼ一定の値を取る。鉛直方向風速が 最大値をとる半径はR よりも少し小さいが,tm R とtm ほぼ同様の分布を示す。Fig.9f-kに示す接線方向,半 径方向,鉛直方向各風速成分の最大値,最小値の分 布をみると,いずれの成分でも最大値(正の値)は 各方向風速の平均値が最大値をとる半径付近で生じ ているが,接線方向および鉛直方向風速の最小値(負 の値)は渦中心部で,半径方向風速の最小値(負の 値)は地面付近で,それぞれ生じている。また,渦 の中心付近では接線方向風速は最小値が負の値をと るので,瞬間的に渦の回転方向と反対になることが あるが,外側では接線方向風速は瞬間的にも負の値 になることはない。 過去に実験室で行われた竜巻状の渦の研究による と,渦の形態はレイノルズ数による変化よりも,ス ワール比(Swirl ratio)による変化の方が大きいので, スワール比で整理されることが多い。その際,ガイ ドベーンで与えられる風向角,および上部の吸出し 口と流入面のアスペクト比によりスワール比が定義 されることが多いが,本研究では収束域に流入する 風速はガイドベーンで調整されておらず,基準とな る風向角を定義できないうえに,流入面の配置も一 定ではないので上述のスワール比が定義できない。 上部で吸出した流れを回流させ,収束域の周囲に吹 き下ろして渦を発生させる形式の実験装置でも事情 は同じで,収束域に流入する風向角を評価すること が難しく,その際には高さZ において接線方向風速 が最大値をとる半径Rtm Z( ),R における接線方向風tm 速の最大値Vtm Z( ),および上方から吸出される運動 量Q =πRt2W0でスワール比S をπRtm2Vtm/Qと定義す ることがあるが(Kuai et al., 2008),本報でも同様の 定義を用いる。したがって,ここではスワール比S は 高さZ の関数として表され,Fig.10にS(Z)の分布を半 径R における風速各成分tm Vtm(Z)(接線方向成分), ) (Z rm V (半径方向成分),Wm(Z)(鉛直方向成分)と ともに示す。 図より半径R におけるスワール比tm S は地面付近 で高さとともに大きくなり,Z/ Rtmax=0.8付近で最大 値をとったあと少し小さくなり,Z/ Rtmax=1.2以上で はほぼ一定の値を取る。半径R の鉛直方向の分布形tm 状 もS の分布を同様な変化を示す。最大接線風速 tmax V はZ/ Rtmax=0.3付近で発現し,R が最大値を示tm すZ/ Rtmax=0.8付近では接線風速の最大値V は極小tm 値0.75 を 示 し , そ れ よ り 上 方 で は ほ ぼ 一 定 値 約 tmax tm/V V =0.8となる。半径R における半径方向風tm 速V は地面付近では負の値(中心に向う風向)をもrm つが,高さとともに大きくなって,一度正の値(外 側に向う風向)をとった後,上方ではほぼ零となる。 半径R における鉛直方向風速tm W は正の値でほぼm 一定値(Wm/Vtmax=0.1~0.2)をとる。 次に最大接線風速の発現する高さZ = 0.3Rtmaxに おけ る水 平方 向の 圧力 およ び風 速の 分布 をみ る。 Fig.11に示すように,圧力 PΔ は最大接線風速Vtmaxに よる速度圧 2 /2 tmax V ρ で割った風圧係数で最小-2.5程 度,最大接線風速半径Rtmaxの位置で-1.5程度の値と なる。接線方向風速V はt Rtmaxより内側で渦中心か Fig. 8 Coordinate system and the definition of variables) ( tm Z
R
Z
X
Y
R
) , ( t R ZV
) ( rm ZV
) ( tm ZV
) ( m Z WU
(Rtm,Z) azimuthally averaging0
r V tV
Wらの距離R にほぼ比例し,外側ではR にほぼ比例−1 するランキン渦の分布に近くなっている。半径方向 風 速V は 中 心 付 近 で 正 ( 外 側 へ 向 か う 風 向 ) ,r 0.7Rtmaxより外側では負の値(中心に向う風向)とな っており,2Rtmax付近で最小値をとる。鉛直方向風 速W は0 R.7 tmax付近で最大値をとったあと外側に向 うにつれて小さくなりほぼ零となる。
5. 渦内の平均風速と圧力分布
最後に,竜巻通過時の耐風設計用に重要となる渦 内の気流性状について,平均風速と平均圧力分布を 渦の形態別に調べる。Fig.12に示すように,最大接線 風速が発現する高さにおける水平方向の平均風速と 平均圧力分布をみると,多重渦型の渦では渦中心部 分で平均圧力が少し上昇する。渦中心付近の低圧部 Fig. 9 Distributions of azimuthally averaged mean velocity and pressure field in a vertical plane.Mean (time averaged) value of single core two cell type in Figure 4 3
Z/Rtmax
2
1
0
f. azimuthally maximum g. azimuthally maximum h. azimuthally maximum tangential speed, Vt/Vtmax radial speed, Vr/Vtmax vertical speed, W/Vtmax
0.2 0.4 0.6 0.8 1.0 0.6 0.2 0.4 0.6 0.6 1.0 1.0 1.4 0 1 2 3 0 1 2 3 0 1 2 3 R/Rtmax -0.2 -0.3 -0.5 -0.5 -0.3 -0.7 0.4 0.2 0.0 -0.2 -0.4 -0.6 3 Z/Rtmax 2 1 0
i. azimuthally minimum j. azimuthally minimum k. azimuthally minimum tangential speed, Vt/Vtmax radial speed, Vr/Vtmax vertical speed, W/Vtmax
3 z/Rtmax
2
1
0
a. azimuthally averaged b. azimuthally averaged mean horizontal mean pressure, 2P/ρVtmax2 wind angle α from radial direction
-0.4 -1.0 -1.6 90 90 90 95 80 α X Y R Z) (R, U 0 rotational direction 95
c. azimuthally averaged mean d. azimuthally averaged mean e. azimuthally averaged mean tangential speed, Vt/Vtmax radial speed, Vr/Vtmax vertical speed, W/Vtmax
0.8 0.8 0.6 0.6 0.4 0.0 0.0 -0.1 -0.05 -0.05 0.2 0.2 0.0 0.1 0.1 0.2 3 Z/Rtmax 2 1 0 -0.05 0.0 -0.35 0.0
の等圧面が,螺旋状にねじれた渦では,中心付近の 鉛直方向および半径方向の風速成分が大きく,風速 絶対値の分布と接線方向風速成分の分布が異なる。 等の違いがあるが,渦の形態によらず,最大接線風 速発現位置における圧力降下は,最大接線風速で無 次元化された風圧係数で周囲の気圧から1.5程度低 くなること,渦中心から最大接線風速半径の3倍離れ た位置では,接線風速が最大接線風速の約半分にな ること,がわかる。 6. おわりに 上部に吸い出し口をもつ円筒形の対流域,下部に 正方形水平断面をもつ直方体の収束域をもつ竜巻発 生装置を模擬した数値トルネードシミュレーターを 作り,計算条件を変更することによって,種々の渦 0 1 2 3 -3 -2 -1 0 0 2 4 6 2P/ρ r /Rtmax max R /Rtmax P Δ
Fig. 12 Variation of azimuthally averaged mean values of tangential speed Vt, radial speed Vr, vertical speed
W, horizontal speed UV, absolute speed UVW and differential pressure PΔ from the surrounding mean pressure as a function of radial distance R at the height where the maximum tangential speed occurs
2⊿P/ρV2 tmax Vt/Vtmax Vr/Vtmax W/Vtmax UV/Vtmax UVW/Vtmax
a. single core type without mean down flow regionin the core
b. single core type with mean down flow region in the core
c. multiple core type
d. swirling core type 0 1 2 3 -3 -2 -1 0 0 2 4 6 2P/ρ r /Rtmax max R/Rtmax P Δ 0 1 2 3 -3 -2 -1 0 0 2 4 6 2P/ρV r /Rtmax max R/Rtmax P Δ 0 1 2 3 -3 -2 -1 0 0 2 4 6 2P/ρV r /Rtmax max R /Rtmax P Δ
Fig. 10 Profiles of azimuthally averaged mean values of maximum tangential speed Vtm, the maximum
tangential speed radius R at which tm V occurs, the tm radial speed Vrm, the vertical speed Wm and Swirl ratio S at Rtm 4.0 Z/Rtmax 2.4 1.6 0.8 0 Vtm/Vtmax Vrm/ Vtmax Wm/ Vtmax Rtm/Rtmax S -0.5 0 0.5 1 1.5 2
Fig. 11 Variation of azimuthally averaged mean values of tangential speed Vt, radial speed Vr, vertical speed W and differential pressure PΔ from the
surrounding mean pressure as a function of radial distance R at Z = 0.3Rtmax.
0.1 1 R/Rtmax 10
b. log-linear plot of tangential wind speed Vt R Vt R-1 1 Vt/Vtmax 0.1 0 1 2 3 4 5 R/Rtmax
a. radial profiles of velocity and pressure Vt/Vtmax Vr/Vtmax W/Vtmax Vt Vr W P Δ 2 tmax / 2ΔP ρV 0 -0.5 -1.0 -1.5 -2.0 -2.5 1 0.75 0.5 0.25 0 -0.25
を生成することができることを示した。生成された 渦の中から,代表的な形態をもつものを取り上げ, 渦内の気流性状を明らかにした。また,形態の異な る渦の共通の特徴として,1.最大接線風速発現位 置における圧力降下は最大接線風速で無次元化され た風圧係数で周囲の気圧から1.5程度低くなること, 2.渦中心から最大接線風速半径の3倍離れた位置で は,接線風速が最大接線風速の約半分になること, がわかった。一方,風速の鉛直方向成分および半径 方向成分,最大接線風速半径内の圧力分布は渦の形 態により複雑に変化した。
謝 辞
本研究は科研費(20560519)の助成を受けたもの である。参考文献
内田孝紀・杉谷賢一郎・大屋裕二(2004):一様流 中に置かれた急峻な単純地形まわりの気流性状の 評価,日本風工学会論文集,No.100,pp.35-43. 丸山 敬(2008):ラージ・エディ・シミュレーシ ョンによる竜巻状の渦を作る試み,京都大学防災研 究所年報,第51号B,pp.481-488. 丸山 敬(2009):数値トルネードシミュレーター の特性,第23回数値流体力学シンポジウム論文集C D,12,G1-4. 文字信貴(1982):竜巻渦の室内実験,京都大学防 災研究所年報,第25号A,pp. 27-45. 文字信貴・光田寧(1983):竜巻実験装置を用いた 1セル及び2セル渦の研究,京都大学防災研究所年 報,第26号B-1,pp. 393-401.Church, C.R., Snow, J.T., Baker, G.L. and Agee, E.M. (1979):Characteristics of tornado-like vortices as a function of swirl ratio , J. Atmos., Sci., Vol.36 , pp.1755-1776.
Kuai, L., Haan, F. L., Gallus, W. A. Jr. and Sarkar, P. P. (2008) : CFD Simulations of the flow field of a laboratory-simulated tornado for parameter sensitivity studies and comparison with field Measurements, Wind and Structures, 11(2), 75-96.
Characteristics of Numerically Generated Tornado-like Vortex
Takashi MARUYAMA
Synopsis
A numerical tornado simulator was developed and a tornado-like vortex was generated numerically by
Large Eddy Simulation. The tornado simulator consists of a convection region and a convergence region. A
series of unsteady flow fields of vortex were generated and examined the flow characteristics with varying
the inflow conditions, the boundary conditions, and the configuration of calculating domain. Some of the
typical vortices ; single core type without mean down flow region in the core, single core type with mean
down flow region in the core, multiple core type and swirling core type were presented. The flow
characteristics of the single core type with mean down flow region in the core were examined. The common
future of these vortices was summarized as, 1. The differential pressure
ΔPfrom the surrounding mean
pressure decreases to the value of
2max
/
2ΔP ρVt