Effect of Accents on Japanese Learners’ EFL Listening Comprehension and Preferences
Natsumi Matsumoto
1. Introduction
1.1 Globalization and an Increased Need for English in Japan
According to Kubota (2012), “Globalization implies increased local diversity influenced by human contact across cultural boundaries as well as speedy exchange of commodities and information” (p.13). Globalization has progressed in various fields such as economics, society and culture. According to the Japanese Ministry of Foreign Affairs (2017), there are about 1.3 million Japanese overseas residents (about 1.08% of the Japanese population), and this number is increasing each passing year. Especially, about 32% of Japanese overseas residents live in the United States. Also, the Ministry of Justice of Japan states that there are about 2.5 million foreign residents in Japan (2017). Therefore, English has become more important for Japanese people year by year, even if they do not leave Japan. In addition, English has become widespread in the world and has become the most used foreign language, often referred to as the Lingua Franca. It is spoken as the first or second official language in about 80 countries and regions. Therefore, it is clear that English is a very popular language, and there will be opportunities to read, speak, listen and write even for people who live in Japan.
1.2 English Education in Japan
Currently in Japan, Japanese students start to learn English from the third grade of el- ementary school: when they are aged about eight years old. English education in elementary school focuses on listening and speaking through songs and games. However, junior high schools and high schools, where students are aged between twelve and eighteen, focus mainly on reading and grammar in preparation for entrance examinations. Because of this, there is a tendency toward reading comprehension questions with a lot of marks allotted to these in
東京女子大学言語文化研究 (Studies in Language and Culture) 28 (2019) pp.107-140
English tests. Buck (1988) stated that the mainstream of Japanese English teaching methods is grammar translation, reading translation and rote learning. In Japan, translation skills and receptive reading and listening skills tend to be regarded as the goal of English learning more than developing the productive skills of speaking and writing.
1.3 Japanese Learners’ Strengths and Weaknesses in English
As mentioned above, the strong point of English education in Japan is the focus on reading and grammar, so Japanese students are good at understanding English written input. How- ever, the weak point is that the system neglects writing and spoken sounds such as pronuncia- tion and conversation, so students are poor at English output (Buck, 1988). Up to now, Japa- nese English education has aimed at improving comprehension skills rather than productive skills. As a result, it is said that many Japanese people do not have practical communication skills in English, because if they cannot produce spoken or written output, they cannot com- municate their opinions and ideas.
1.4 Changes to English Education Curriculum
The Ministry of Education presented its Action Plan for Training Japanese who can Use English Well in 2003. It aimed to improve the English communication skills of Japanese stu- dents. For example, after graduating from junior high and high school, they are expected to have the proficiency level of daily conversation, and after graduating university, they are expected to be capable of business conversation. Therefore, Japanese schools have classes with native English speakers at least once a week and encourage Japanese students to study over- seas more than before. Moreover, the Ministry of Education announced the New Curriculum Guidelines in 2017. According to these guidelines, English classes will become compulsory from the third grade of elementary school, and fifth and sixth grade elementary school stu- dents will take twice the number of English classes than before from 2020. Therefore, from 2020, Japanese students will be taking English classes from an earlier age and studying for a greater amount of time.
2. Previous Research
2.1 English Education in JapanAs mentioned in section 1.4, the number of class hours dedicated to studying English in Japanese schools is increasing year by year. Moreover, junior high and high school teachers
will soon have to conduct English classes in English even if they are Japanese. Therefore, even though Japanese students take reading in English classes, they will have to listen to the teacher’s English. As a result, they will get increased chances to listen to English in all English classes, so English listening skills will be more necessary.
2.1.1 English Skills Focus in Japanese Education
According to the curriculum guidelines provided by the Japanese Ministry of Education (2017), among the 12 subjects in elementary school, English classes correspond to between 3.3% to 6.9% of the total school hours. Benesse Educational Research and Development Insti- tute (2012) investigated what kind of English skills students thought they had acquired after graduating from elementary school. The researchers found that more than half of the students (50.8%) answered that they could get used to the sound and rhythm of English. However, Be- nesse Educational Research and Development Institute (2014) found that grammar, writing and listening skills were factors that made it difficult to use and understand English for more than 60.2% of junior high and 70.9% of high school students. Also, the researchers found that junior high and high school teachers focus mainly on activities such as reading aloud, pronunciation practice, grammar explanation, and listening to textbook passages. Therefore, it can be said some school teachers do focus on listening comprehension and sounds and pronunciation of English.
2.1.2 Importance of English Language Tests in Japanese Education
According to Benesse Educational Research and Development Institute (2012), Japanese Junior high school students’ motivation to learn English is mainly to achieve good test scores (82.4%) and to pass high school and university entrance tests (66.6%), so Japanese students seem mainly extrinsically motivated in terms of learning English. However, many of them (71.0%) are happy to be able to understand a foreign language, and 68.0% believe that English is indispensable for a future international society, so they also have some intrinsic motivation towards learning English. In other words, while there is some enjoyment in learning English, they mainly learn English to pass tests and secure a more successful future.
In Japan, there are many types of English tests such as course tests, standardized tests, and entrance examinations. The TOEIC and EIKEN tests are the most common standard- ized English tests in Japan. In these tests, the reading, grammar and listening sections have almost the same score value. On the other hand, Yonezu and Ogura (2018) found that 95.2%
of high school teachers count listening tests as less important than grammar and reading with only 5% to 20% of the total score coming from the listening section. Moreover, 40.6% of high school English teachers do not conduct listening tests on a regular basis. However, the listen- ing section of University Admission Common Test (now called the Center Test) will change greatly in 2020. In 2006, the listening section was introduced to the Center Test (Uchida &
Otsu, 2013), but only 50 points out of a total of 250 points were assigned to listening scores initially, so it was only 20% of the total score. However, in 2018, the National Center for Uni- versity Entrance Examinations announced that they are thinking about balancing the read- ing section and listening section scores and will appoint not only American native speakers but also British speakers and non-native English speakers in the listening section. Therefore, Japanese students and English teachers will have to focus on listening as much as reading for the entrance examination.
2.2 Factors Affect Listening Comprehension
From the literature reviewed so far, it is clear that from now on, Japanese students will take more English classes, and need better listening comprehension skills in classes and on tests.
Therefore, identifying what factors influence listening comprehension is important. Bloom- field, Wayland, Rhoades, Blodgett, Linck and Ross (2010) categorized the factors and char- acteristics affecting listening comprehension into three broad categories, which are Listener (e.g., proficiency and experience, vocabulary size, phonological and grammatical informa- tion, background knowledge, anxiety), Passage (e.g., length, redundancy, syntactic complex- ity, speaker’s accent, distortion and noise, hesitation and pause, speech rate), and Testing con- ditions (e.g., time limits, number of and control over hearings, note taking). Of course, there are also other factors that can be categorized in other categories. For example, Rubin (1994) categorized relevant factors into text, speaker, purpose of listening, proficiency of listener, and perception and interaction between listener and speaker.
In addition, Goh (2000) analyzed factors more specifically and categorized into three categories that occurred during the cognitive processing phases of perception, parsing and utilization. Also, five of 10 factors relate to perceptual processing, which include forgetting the contents immediately, unknown vocabulary, understanding the vocabulary but cannot understand the contents, neglect the next sentence while thinking about meaning, and can- not form meaning from the schema by words heard. If anything, the problem is due to the proficiency level of the individual.
As seen above, there are many factors that affect listening comprehension skills, but in this paper, I chose the factors of speed, pauses, text length, vocabulary, background knowledge, grammar, and accents, which are commonly covered in other studies (Chen, 2013; Gilakjani
& Ahmadi, 2011).
2.2.1 Speech Speed
Speech speed in L2 listening means the speed of reading a text or speaking on a subject in natural conversation. The speed is measured in units of Words Per Minute (WPM). There are various theories about the Speech Speed. In the first place, Zhao (1997) states that there are individual differences in ability, storage capacity, listening habits, and processing strategy, so definitions of normal, fast, and slow are different for each person. Moreover, Bloomfield, Wayland, Blodgett, and Linck (2011) said that it is not clear whether listening comprehension is dependent on speech speed or pauses. Therefore, it may be said that there is no definite evi- dence about speech speed yet. However, according to previous research (Anderson & Koehler, 1988; Blau, 1990; Hayati, 2010; Zhao, 1997), speed of speech has an influence on EFL learn- ers’ L2 listening comprehension. In general, slower speed gives more time to think, so most people think that it would be easier to understand slower speech, but that is not always the case. For example, Anderson and Koehler (1988) and Blau (1990) found that there was no sig- nificant difference in comprehension scores between regular speed and slow speed. Anderson and Koehler (1988) investigated the effect of speaking rate on native speakers’ and non-native speakers’ comprehension. In their study, the participants were native speakers of American English and native speakers of Chinese. Based on the Test of Spoken English (TSE), an oral test score that measures the ability of non-native English speakers to communicate effectively, the researchers categorized the recorded texts into three speaking speed levels; fast, regular, and slow. The result was that the comprehension scores were significantly higher for the na- tive passages than non-native passages at any speed, but there were no significant differences with the comprehension between the regular speed and the slow speed. When comparing regular and fast speed, there were significantly higher scores at the regular speed than the fast speed for all speakers. Therefore, it showed that regular and slow speed is easier to understand than fast speed.
Next, Blau (1990) investigated the effect of speed and syntax and speed and pauses on comprehension. In this study, syntax means the degree of complexity of the sentences. In results, there was no significant effect for speed and syntax. On the other hand, longer pauses
provided significantly higher comprehension scores than the regular and the slow speed.
Moreover, the comprehension levels and self-assessment of quantity understood was slightly lower for the slow speed than the regular speed. Therefore, the researcher found that slower speed is not as beneficial for comprehension and self-assessment of comprehension levels. In another study, Zhao (1997) compared the importance of speed and repetition. In this study, the researcher divided participants into a condition group that could change the speed and repeatedly listen to what they heard, and a condition group that could not do it. In terms of results, the participants who could change the speed and heard repeatedly performed bet- ter than the participants who could not. Also, everyone who could change the speed slowed down the speed. Although the only hearing repeatedly group had higher scores than the only- changing-speed group, there was no statistically significant difference. Therefore, it can be said that speed and repetition are equally important for listening comprehension.
However, unlike Anderson and Koehler (1988), Blau (1990) and Hayati (2010) found that the difference in scores between regular speed and slow speed was significant. Hayati (2010) compared the difference in comprehension based on speed (natural and slow) by a Pre-Post Test design, in which the participants were divided into a natural speed group and a slow speed group. During the two-week interval, both groups were permitted to check the video and scripts in group activities. Two weeks after the pre-test, the same test was administered as a post-test. In terms of results, both groups had significantly higher scores on the natural speech materials before and after the tests. Also, the natural speed was significantly more ef- fective than slow speed on the improvement of listening comprehension. However, as Zhao (1997) stated, the definition of each speed was different from other studies.
Therefore, speech speed is often but not always correlated with listening comprehension, but all researchers commented that since the definition of speed (fast, regular or slow) varies depending on the researchers, which speed is the best for comprehension is different for each person. Moreover, Blau (1990) found that pauses are more important than slow speed. Thus, although there can be significant difference depending on speed, pauses also have an impor- tant role to play.
2.2.2 Speech Pauses
As stated above, according to previous research (Jacobs, et al., 1988; Blau 1990, 1991), speech pause has an influence on EFL leaners’ L2 listening comprehension. Speech pause means the time interval during which there is a temporary cessation of speaking (Blau, 1991).
It has generally been shown that pauses make listening texts easier to understand, and it is thought this is because it provides learners with more time to process and understand vo- cabulary and content.
First, Jacobs et al. (1988) showed that pausing positively affects comprehension because there is an interaction effect between pausing and listening ability. In their experiment, the material was recorded voices with four different combinations of speed and pausing condi- tions. They found that longer pauses lead to significantly better comprehension. However, they showed that there is no significant effect of changing speech speed on comprehension.
Also, according to comments from participants, if the pausing is too much or too long, they become bored. Finally, they concluded that pausing is important, but for it to be most benefi- cial, it is important for the teacher to adjust pausing appropriately.
Moreover, as mentioned earlier, Blau (1990) stated that longer pauses provided signifi- cantly higher comprehension than the regular and slow speed. In addition, Blau (1991) also showed that there were differences in comprehension at a variety of speech pause rates, and comprehension depends on the length and frequency of the pauses. In this experiment, the material was three types of recorded voice with different speech conditions; (1) normal speed;
(2) with 3-second pauses inserted, on average, in every 23 words; and (3) with similar pauses filled with hesitation markers (e.g., well, I mean, Uh). In terms of results, comprehension of the version with filled pauses was higher than the normal version. Moreover, results for the blank pauses were worse than the version with filled pauses. Therefore, they found that hesitation markers make spoken texts easier to understand. Finally, they stated that fillers will automatically appear if the teachers are conscious of speaking as usual, not reading in a monotonous voice. Also, speaking activities such as conversation would be more effective for EFL leaners.
As seen above, speech pauses can be seen to have a significant effect on listening compre- hension. However, the difference of effect depends on varieties of speech pauses. Thus, natural pauses filled with hesitation markers seem to be better than pauses created by teachers.
2.2.3 Text Length and Density
Although it is not a certainty because there are few studies about Text Length, most re- searchers state that only length does not affect comprehension. Also, Bloomfield, Wayland, Blodgett, and Linck (2011) stated that the length in various studies tends to be confused with the speech rate (as measured in duration of speech) or density and redundancy (as measured
by number of words). Therefore, in this paper, I considered both text length and density as a factor and examined some research on these issues.
First, Wayland, Saner, Ralph, O’Connell, Linck, Kramasz, Gynther, and Bloomfield (2013) compared the effects of the length and the redundancy on native speakers and non-native speakers. They used two types of listening tests: a recall test and a multiple-choice test. Of course, based on that issue, the results showed that the comprehension scores were higher for shorter passages than longer passages for both groups on the recall test. However, there was no significant difference on the multiple-choice test. Also, the scores were the worst only for native speakers when the passage was long and the information density was high. Therefore, the researchers concluded that in the case of native speakers, the length and the information density are correlated in the recall test, but not for non-native speakers.
However, Bloomfield, Wayland, Blodgett, and Linck (2011) stated that although a few studies found an effect on length for listening comprehension, these results were affected by other factors such as redundancy and information density. Moreover, the researchers thought that redundancy rather than the length is more influential for listening comprehension. For example, Bloomfield, Wayland, Rhoades, Blodgett, Linck, and Ross (2010) showed that long sentences make passages difficult to understand, but there was no statistically significant effect of overall text length. However, high information density had a negative effect, and redundancy improved the comprehension. That is why there may be significant differences between studies examining only the length of passages.
Although it is not certain that text length affects listening comprehension, Bloomfield, Wayland, Rhoades, Blodgett, Linck, and Ross (2010) claim that the length is not completely unimportant, because the length has a relationship with information density and redundancy.
For example, even a short passage cannot be understood if there are many ideas, but a long passage can if they are without heavy substance. Therefore, Text Length alone is not com- pletely correlated with listening comprehension. However, Density can affect comprehension, so if text length and listening comprehension are correlated, it can be considered that factors such as density are affected.
2.2.4 Vocabulary and Schema
According to previous research, Vocabulary (lexical knowledge) and Schema (background knowledge) have strong effects on listening comprehension. Vocabulary represents the mean- ing of passages and conversations. In addition, if L2 leaners have some background knowl-
edge on the topic (schema), it will be easier to comprehend the information contained in the passage, and this may also connect to increased motivation, especially if they are interested in the topic. Abdaldaem, Jingwangsa, Promduang, Jirotsin, and Dong (2017) stated that the vocabulary that speakers use is more important than the grammatical structures in terms of listening comprehension; lack of vocabulary knowledge causes more problems than lack of grammatical knowledge. Also, Saied and Ali (n.d.) stated that not only vocabulary prepara- tion but also background knowledge is important. Therefore, vocabulary studies on listening comprehension are often compared with schema, and finally the researchers conclude that vocabulary and schema affect comprehension deeply, so these may be similar factors. Below some studies that compared vocabulary only, schema only, and both have been reviewed.
First, Teng (2014, 2016) and Dabbagh (2016) compared the correlation between depth and breadth of vocabulary knowledge on reading and listening comprehension. They showed that a 5000 word-family vocabulary level had a higher positive correlation with comprehen- sion than a 3000 word-family level. However, although depth and breadth are correlated, only vocabulary depth had a significant influence on comprehension. Also, based on experimental results concerning learners’ vocabulary size, Teng (2014) claimed that vocabulary size is more important in listening than in reading. However, Chang (2007) found that there is not a clear correlation between vocabulary knowledge gains and listening comprehension. While vocab- ulary study time directly correlated with improvements on vocabulary tests, it did not do so with listening comprehension tests. Therefore, listening comprehension is clearly influenced by more than just vocabulary, supporting the research discussed above on the effect of pauses, speech rate, and text density.
Second, Bonk (2000) stated that the root of schema is vocabulary knowledge. Therefore, the researcher investigated the interaction between lexical knowledge and listening compre- hension. The participants’ vocabulary level varied from high to low and the results showed that familiarity with vocabulary and comprehension are correlated. On listening passages where topic familiarity was 75% or less, comprehension was very difficult, whereas passages were significantly easier to understand when familiarity was 90% or more. The researcher found that familiarity of lexical knowledge and comprehension is correlated regardless of the participants’ vocabulary level; therefore, familiarity of vocabulary helps listening comprehen- sion. In this case, the researcher was only dealing with vocabulary level, but it is connected to schema because words that have been heard before are familiar. Also, Samad (2011) investi- gated the relationship between topic familiarity and listening comprehension. Topic familiar-
ity was measured by a questionnaire as a pilot-test and divided into topics with familiarity or unfamiliarity based on the questionnaire. In terms of results, familiarity affected the scores on the recall test regardless of participants’ proficiency level. In other words, topic familiar- ity leads to better comprehension. Moreover, Nashmiah (2012) also explored attitude and motivation. The researcher investigated the effectiveness of using schema theory on listening comprehension and focused on brainstorming, graphic organizers, and KWL, which are fa- mous as effective language educational methods. Brainstorming means to draw out ideas by associating relevant words. Graphic organizers are like brainstorming, but the difference is that it is simpler by schematizing it. KWL is making a frame consisting of three rows, K (what I Know), W (what I Want to know), and L (what I Learned); K and W are used when prepar- ing, and L is used when reviewing. The experiment was pre and post listening comprehension tests for the experimental and control groups. Also, the participants in the experiment group answered the questionnaire and the teachers who taught both group participants took an interview. The main result was that schema-based strategies are effective for listening compre- hension. Also, the experimental group showed positive attitude towards the schema building strategies. Therefore, schema not only helps listening comprehension but also leads to positive attitude and higher motivation. In conclusion, the researchers state that EFL leaners need to build background knowledge (schema) as well as vocabulary knowledge to improve L2 listen- ing comprehension.
Finally, Zohrabi, Sabouri, and Behgozin (2015) stated that doing pre-listening activities to build background knowledge and vocabulary related to authentic movies lead to better com- prehension than when not including pre-listening activities. Moreover, Saied and Ali (n.d.) and Farrokhi and Modarres (2012) experimented with vocabulary and schema, respectively.
According to Saied and Ali (n.d.), vocabulary and schema preparation related to the listening contents is more effective than grammar preparation, but there was no difference between vocabulary and schema. However, Farrokhi and Modarres (2012) stated that vocabulary has more effect for low proficiency level learners, but content knowledge is more important than vocabulary for high proficiency level learners. Therefore, the degree of importance of factors is different for each learner.
As seen above, although the effect varies somewhat depending on the learner’s level and learning method, vocabulary and schema are equally important for listening comprehension.
2.2.5 Grammar
Grammar in L2 listening means the branch of linguistics that deals with syntax and mor- phology. According to previous research (Saied & Ali, Abdaldaem, n.d.; Jingwangsa, Prom- duang, Jirotsin & Dong, 2017 Saied & Ali, n.d.), grammar is believed to have little influence on EFL leaners’ listening comprehension. However, it is assumed that if the sentence becomes longer, the grammatical structure becomes more complicated too, and it makes spoken texts difficult to understand.
First, Saied and Ali (n.d.) investigated the effect of preparation for listening as pre-listening activities on the listening comprehension of Iranian EFL learners. The pre-listening activities are related to grammar, vocabulary, and background knowledge. The participants were divid- ed into three groups: a grammar preparation group, which was taught difficult grammatical structures contained on the listening test; a vocabulary preparation treatment group, which reecived a vocabulary list containing words from the listening test; and a background knowl- edge group, which was taught background knowledge about the topics of the listening test followed by discussion about the topic. The material was based on the TOEFL listening test, which was read by American native speakers of English, and the comprehension test was a multiple-choice type. According to the study, there were differences between the mean scores of each group. Vocabulary preparation was the most effective preparation for the listening comprehension test. Also, there were significant differences in the mean scores of the gram- mar and the vocabulary groups, and the grammar and the background knowledge groups;
However, there were no differences between the vocabulary and the background knowledge groups. Therefore, the researchers stated that the preparation of vocabulary and background knowledge related to the scripts positively affected listening comprehension more than gram- mar preparation, so this is more important than the preparation of grammar. The researchers concluded that the preparation of both background knowledge and vocabulary is the best combination for listening comprehension, not grammar instruction.
Second, Abrahem, Jingwangsa, Promduang, Jirotsin, and Dong (2017) investigated the effect of vocabulary and grammar knowledge on reading and listening comprehension. The participants were Thai students and the materials were the placement tests of CEFR (Com- mon European Framework of Reference for Languages). According to the study, vocabulary and grammar both have a correlation with reading and listening comprehension. However, the positive correlation between grammar and listening was slightly lower than that of vo- cabulary and listening. Moreover, grammar tended to have higher correlation with reading
comprehension than listening comprehension. Nonetheless, vocabulary and grammar are significantly correlated, so the possibility that the vocabulary is affecting grammar can be considered.
As seen above, Grammar is somewhat correlated with listening comprehension, but the researchers stated it is less important than vocabulary. In the case of listening, it is not diffi- cult to understand the meaning, even if the word order and tense are not accurate. Therefore, while listening and speaking, it is widely considered that vocabulary is more important than grammar.
2.2.6 Accents
There are various studies on accent. According to the Oxford English Dictionary, accent refers to “The way in which anything is said or sung; a style of pronunciation, a manner of ut- terance, a tone or quality of voice; a character of sound; a musical or quasi-musical intonation of the voice; a modulation or modification of the voice expressing feeling” (para. 4), and “A way of pronouncing a language that is distinctive to a country, area, social class, or individual”
(para. 8), but in this accent refers to a dialect. In previous studies, there were experiments focusing on accents with participants and speakers who were English native speakers or non- native speakers. Surprisingly, there are many differences between the results of the studies.
Also, in this paper, native speakers are defined as those who speak English as their mother tongue.
First, Anderson‐Hsieh and Koehler (1988) found that listening comprehension scores get lower as the accent of non-native speakers gets stronger. The participants were American native English speakers, and the test speakers were American English speakers and Chinese English speakers. The strength of the accent was based on the TSE (Test of Spoken English) score. Also, they measured comprehension while comparing the effect of both speed and accent. In terms of results, every time the speed changed, there is a significant difference in the evaluation of accent, so the participants recognized that the accent becomes stronger as the speed becomes faster. In this case, it was due to the interaction of speed and accent. On the other hand, Floccia, Butler, Goslin, and Ellis (2009) experimented with participants in England with Plymouth and Irish as Received Pronunciation, and French speakers. Received Pronunciation means the most commonly accepted or standard form of pronunciation (Ox- ford English Dictionary, para.1). They measured comprehensibility by the reaction times, but there was no difference amongst speakers.
Second, Chaipuapae (n.d.) Tauroza and Luk (1997) concluded that there was no signifi- cant difference in the comprehension scores due to accent. Chaipuapae (n.d.) compared Ar- abic and Chinese English speakers, and the participants were Arabic and Chinese also. In both studies, there was no difference in comprehension scores between passages delivered by speakers of their native country and non-native speakers. Tauroza and Luk (1997) compared Received Pronunciation speakers as native speakers and Cantonese speakers as non-native speakers, and the participants were L1 Cantonese speakers. This research focused on accent in terms of syllable difference rather than an accent as a dialect. In terms of results of a multiple- choice test and the summary test, although it was not statistically significant, the scores on native speakers’ speech was higher than those of non-native speakers. On the other hand, Harding (2012) concluded that the result varies depending on the country of the participants.
The researcher compared Australian, Chinese (Mandarin), and Japanese English speakers, and the participants were Asians including Chinese and Japanese. In terms of results, in the case of Japanese participants, the scores on Japanese English speakers were slightly higher, but it was nearly equal to the scores of other participants. However, in the case of Chinese participants, the scores were significantly higher than the other participants who listened to Chinese English speakers.
Finally, Tauroza and Luk (1997), O’ki and Kaneko (2014) and Nagano (2017) conclud- ed that there was no significant difference in comprehension scores due to accent. O’ki and Kaneko (2014) and Nagano (2017) investigated the comprehension scores resulting in dif- ferences in pronunciation between American English and British English. All participants were Japanese university students. In terms of results, although British English speakers were slightly easier to understand, there were no statistically significant differences in scores be- tween American and British accents. Also, as mentioned in the previous paragraph, Harding (2012) found that in the case of Japanese participants, accents do not affect comprehension scores so much.
On the other hand, although it is not a comparison of American English and British Eng- lish, Tara, Yanagisawa, and Oshima (2010) found a significant difference for Japanese partici- pants in comparison between British English (Received Pronunciation) and Hindi accented English. According to the results, in case of high proficiency participants, there was not much difference in the latter half of the experiment, which might be because they were familiar with Hindi, but in the first half, the Received Pronunciation had higher scores than Hindi. How- ever, taking the whole comprehension test, the scores for Received Pronunciation were higher
than those for Hindi English regardless of the level.
In addition, although not with Japanese participants, Ockey and French (2014) found a difference in the comprehension scores due to different native English accents. They focused on the strength of each speaker’s accent rather than the speaker’s country. The measure of the strength of accents was determined based on saliency, comprehensibility, and additional processing time. In that experiment, they defined American English accent strength as 1.1 based on “The Strength of Accent Scale,” which was developed for the study and, compared with British English and Australian English, which were viewed to have stronger accents. In terms of results, there was a significant difference in comprehension scores between the Brit- ish and Australian English speakers with accent strength scale of over 2.1 and those under 2.0. Furthermore, they found that in the case of over 2.1 accent strength speakers, the scores decreased as the accent became stronger.
As seen above, the effect of Accent has mixed results, but many papers do not accentuate the influence of accent. As mentioned in the chapter on Speech Speed, the difficulty of accent differs from person to person like speed, so it seems to be very difficult to match the condi- tions.
2.2.6.1 Leaner’s Attitude Towards Accents
In some of the previous studies discussed above, the researchers were investigating not only the comprehension scores but also the preferences, identifications and familiarity of ac- cents. In some cases, there is a correlation with comprehension scores, and in other cases it is not so. Moreover, there are few studies focused on learners’ attitudes and preferences regard- ing accents, but the ones found are reviewed below.
2.2.6.2 Learners’ Preferences towards Accents
Chaipuapae (n.d.) compared learners’ preferences towards Arabic and Chinese English speakers, and the participants were also Arabic and Chinese. In terms of results, although there was no difference in comprehension scores between speakers of their own country and other country speakers, the participants preferred the speakers of their mother tongue. In addition, according to Tauroza and Luk (1997), Nigerian participants preferred English used by the speakers of their mother tongue rather than native speakers of English. Also, studies comparing American English and British English (Nagano, 2017; O’ki and Kaneko, 2014) found that although there were no statistically significant differences in comprehension, the
participants preferred American English rather than British English. Therefore, it can be said that the comprehension and preference of accents do not correlate, but it could affect students’
attitude and motivation.
2.2.6.3 Learners’ Identification of Accents
Ballard and Winke (2017) investigated learners’ ability to recognize the accents of Al- banian, British, Chinese, Midwestern and Southern English speakers. The participants were native English-speaking Americans, Asians such as Chinese, and Arabs who were non-native English speakers. Of course, native English participants could recognize the difference be- tween native and non-native English speakers better than non-native English participants.
However, in the case of recognizing where the native speaker was from, there was no differ- ence in the percentage of correct answers between the native and non-native participants.
The researchers concluded that native speakers found it easier to distinguish between native and non-native accents than non-native speakers, but were no more able to identify where speakers are from. Furthermore, Nagano (2017) found that Japanese participants could not distinguish between American English and British English, and there was no difference in the comprehension scores due to each speaker’s accents. On the other hand, Anderson-Hsieh and Koehler (1988) found that native English participants were able to distinguish the strength of Chinese speaker’s accents. Moreover, the strength of the accent and the decrease in the com- prehension scores were proportional. Therefore, in especially British English, identification of accents and comprehension may be correlated. While these results are interesting, no research was found that investigates the correlation between comprehension and the ability to identify the origin and nature of English accents such as nationality or whether the speaker is a native or non-native speaker of English.
2.2.6.4 Leaners’ Familiarity with Accents
Anderson-Hsieh and Koehler (1988) found strength of accent and background (familiar- ity), which was measured by a questionnaire, were not correlated with comprehension scores.
However, attitude and comprehension were slightly correlated. They said that positive attitude towards accent would help comprehension of non-native speech that is difficult to under- stand. On the other hand, Ockey and French (2014) found a correlation between familiarity and comprehension. They compared American English (the accent strength scale as 1.1 based on The Strength of Accent Scale which was developed for the study) with British and Austra-
lian English (the accent strength scale from 1.7 to 2.7) and, found a difference in comprehen- sion scores between the British and the Australian speakers with accents over 2.1 and the others with 2.0 or less. Not only so, the participants who had higher familiarity with British and Australian English had higher comprehension scores, and it was more prominent in the Australian speakers than the British speakers. However, Ballard and Winke (2017) showed when comparing Albanian, British, Chinese, Midwestern and Southern English speakers, the familiarity for each accent which was reported by non-native Chinese participants was cor- related with their ratings of speaker’s comprehensibility only for British and Chinese English speakers. Therefore, familiarity, especially L1 speaker’s English accent can affect comprehen- sion sometimes, but more research is needed.
2.3 Gaps in the Literature
Most previous research has suggested that there was no or little relationship between ac- cent and comprehension in listening. However, a few papers suggested that accent has an influence on comprehension, so it is confusing. I think that the difference in results was due to experimental methods and conditions. For example, the order of listening to American English and other English was not random, so there was a possibility that participants became familiar with listening to an accent and it became easy to understand. In addition, the speech speed and the text length as described in the previous chapter were different depending on the speakers. Also, Bloomfield, Wayland, Rhoades, and Blodgett (2010) suggested that in real oral passages, several factors such as unfamiliar accents, speed, culturally specific informa- tion, distortion, and noise may interact with other factors and it could increase the difficulty of comprehension. Thus, it is important to consider multiple factors simultaneously when investigating the influence of an element such as accent.
Following this theory, although the researchers have not mentioned them, there were fac- tors that could have interacted in the conditions of most previous experiments: for example, the nature of passages. In most experiments, one speaker recorded material that was read out loud from a pre-written text. However, some experiments adopted speakers who were judged to have accents by native speakers, others used teachers at university from various countries.
In the case of teachers at university, Nagano (2017) suggested that teachers usually talk to non-native students, so they may have adjusted their speech to make it easier for non-native speakers to understand. As globalization advances, the possibility of listening to not only native speakers of English but also non-native speakers using English as a second language is increasing. Also, not everyone may speak with an English accent that can be easy to un-
derstand. If working with foreigners, telephone conversation may be with fast talkers, and with people with different accents, and in conferences it is necessary to listen to a plurality of people. Therefore, this study will focus on the effect of accent in practical and natural English conversations and it is hoped the results will be of interest to educators responsible for design- ing English courses and curricula. This research focuses on whether there are any differences in comprehension levels of female Japanese university students when listening to native and non-native English speakers. Also, some information about students’ attitudes and feelings will be collected.
2.4 Research Questions
Q1. Do differences between native and non-native English accent affect listener’s compre- hension levels?
Q2. Can Japanese university EFL students identify speakers’ accent from listening passages, and is this related to listening comprehension?
Q3. How do Japanese university EFL students feel about the pronunciation (accent) of each speaker?
Q4. What characteristics do Japanese university EFL students think affect listening com- prehension?
3. Method
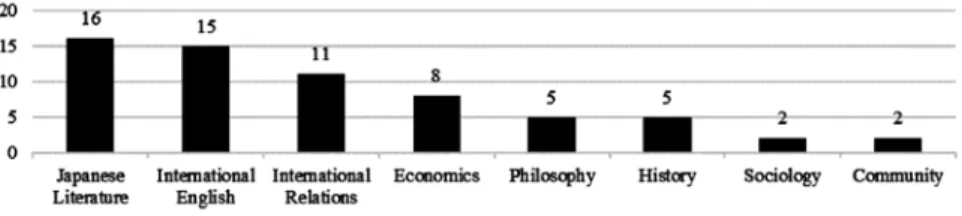
3.1 ParticipantsThe participants in this study were 64 freshmen who were Tokyo Woman’s Christian Uni- versity (TWCU) students; aged between eighteen and twenty years old. In TWCU, there are 13 departments. In this study, students in eight departments were participants (as shown in Figure 1). The participants were selected from two Communication Skills classes and a First Year English Seminar class which are compulsory courses of the first year in TWCU.
Figure 1: Information about the participants’ departments.
3.2 Procedures for Material Selection
First, in this study, a researcher-designed listening test was used to measure students’ lis- tening comprehension, accent identification ability, clarity towards each accent, along with a questionnaire to know about students’ preferences and background for each language and accent.
To select passages, the internet was used to search for natural spoken material that con- tained English spoken by various people including native and non-native speakers. In par- ticular, as mentioned in the previous section, it was desirable to choose passages that were not simply a script read aloud but were uttenances spoken by two or more speakers as natural conversation. Three such materials were found, but when the dialogues were examined by a native-speaking English professor, the first and second materials had not noticeably strong accents (most non-native speakers had natural American accent), so these materials were re- jected. Therefore, one listening textbook with a CD was used in this experiment. The material (“Ultimate English listening: Standard Vocabulary List 1-6 WORLDWIDE” by ALC Press, Inc. 2010) has strong accented speakers. However, as the material did not contain comprehen- sion questions, original comprehension questions were created in order to test the compre- hension levels of each speaker.
3.3 Materials
This study used listening materials from conversations, comprehension questions, and a questionnaire. The listening material contained American, British, Canadian, Australian, South American, Cockney, French, German, Indian, Brazilian, Russian, and Chinese English speakers. As a result of analysis of the listening texts in terms of vocabulary level, speak- ing speed, and accent type, I chose three passages which contained the following nationali-
ties; [1] Australian and Russian, [2] American and Chinese, and [3] Canadian and Indian (as shown in Table 1). By analyzing four factors that could influence listening comprehension mentioned in section 2, Speech Speed, Pauses, Vocabulary Level and Schema, I was able to limit or determine the effect of variables other than accent.
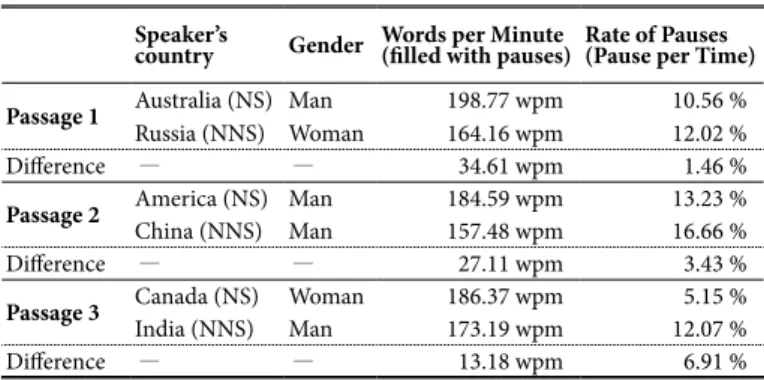
First, I measured the speech speed and time of each speaker except for the noise which is not related to the conversation, such as the sound of the phone and calculated the speed of each speaker using Words Per Minute. However, the measurement time includes the pauses that occur between the dialogue. Second, I measured the pause between each successive pair of sentences. Finally, concerning the vocabulary level and schema, the material is composed only of Standard Vocabulary List 12000 level 1 to 6 (beginner and intermediate level) words, so it can be said each speaker’s vocabulary level is somewhat controlled. Moreover, the pas- sages are similar in terms of schematic knowledge students are likely to have because they are all fairly unfamiliar situations. The situations of the conversations are “small talk about the acquaintance’s daughter,” “a discussion between a hotel guest and a concierge,” and a “tele- phone conversation requesting to change the appointment with a business client.” Therefore, I focused only on Speech Speed and Pauses as other factors that could interact with accents.
Table 1: Information about the Listening Material.
Speaker’s
country Gender Words per Minute(filled with pauses) Rate of Pauses (Pause per Time)
Passage 1 Australia (NS) Man 198.77 wpm 10.56 %
Russia (NNS) Woman 164.16 wpm 12.02 %
Difference - - 34.61 wpm 1.46 %
Passage 2 America (NS) Man 184.59 wpm 13.23 %
China (NNS) Man 157.48 wpm 16.66 %
Difference - - 27.11 wpm 3.43 %
Passage 3 Canada (NS) Woman 186.37 wpm 5.15 %
India (NNS) Man 173.19 wpm 12.07 %
Difference - - 13.18 wpm 6.91 %
As seen in Table 1, where NS stands for the native speaker, and NNS stands for the non-native speaker, there are some differences in the speakers’ native country and gender, and in speed and pauses. Speech speeds ranged from 157.58 to 198.77 WPM, so they can be said to be natural conversation speed.
Next, the listening materials were edited using a free software called Sound Engine (by
Windows Forest) so there was sounds signaling the start of the passages, and a long enough pause after each conversation for the participants to answer the comprehension test ques- tions. Finally, listening tests were created which were composed of eight comprehension ques- tions for each conversation, four for each speaker; two open questions, one cloze question, and one true or false question. Thus, the participants answered 24 comprehension questions in total; 12 about the native speakers and 12 about the non-native English speakers. Because the level of difficulty of the question types was different, a weighted scoring system was used.
The open questions and cloze questions were worth a maximum of three points, and the true or false question had a value of one point. In addition, to remove the chance of order effect, I changed the order of the three listening passages in each of the three classes. Also, I con- ducted a pilot-test with three Japanese university students to investigate and control difficulty of comprehension questions.
3.4 Data Analysis Procedure
First, all listening comprehension test question answers were scored. For the open and cloze questions, if there was misspelling or an incomplete answer, I awarded partial scores.
Also, they were input into Microsoft Excel to calculate the mean, minimum, and maximum scores and correct answer rate of each speaker. Finally, the mean scores for the native and non-native speakers were compared statistically using paired sample t-tests on each of the three-passages.
4. Results
4.1 Listening Comprehension Questions
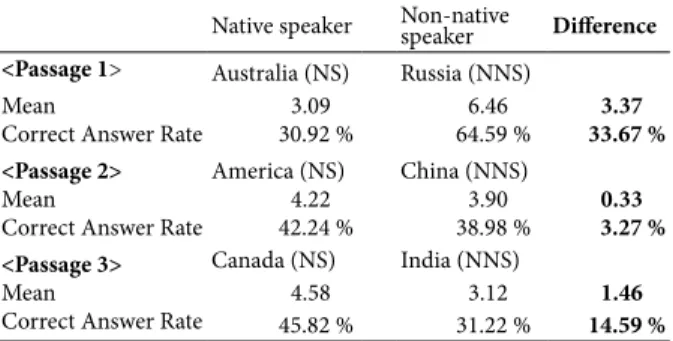
Table 2 shows the mean score and correct answer rate for each speaker’s comprehension question test. In terms of comprehension test scores, as shown in Table 2, Passage 1 had a mean of 3.09 out of 10 for the Australian speaker and 6.46 for the Russian speaker. Passage 2 had 4.22 for the American speaker and 3.90 for the Chinese speaker, and Passage 3 had 4.58 for the Canadian speaker and 3.12 for the Indian speaker.
Table 2: Result of comprehension tests.
Native speaker Non-native
speaker Difference
<Passage 1> Australia (NS) Russia (NNS)
Mean 3.09 6.46 3.37
Correct Answer Rate 30.92 % 64.59 % 33.67 %
<Passage 2> America (NS) China (NNS)
Mean 4.22 3.90 0.33
Correct Answer Rate 42.24 % 38.98 % 3.27 %
<Passage 3> Canada (NS) India (NNS)
Mean 4.58 3.12 1.46
Correct Answer Rate 45.82 % 31.22 % 14.59 % Note. Maximum score is 10 points per speaker.
Also, the paired sample t-test determined that the mean difference in students’ compre- hension scores for the Australian speaker (M = 3.09, SD = 2.07) and the Russian speaker (M
= 6.46, SD = 2.42) in Passage 1 was statistically significant; t(48) = 8.10, p < 0.0001. However, the mean score differences between the American speaker (M = 4.22, SD = 2.20) and the Chinese speaker (M = 3.90, SD = 1.80) in Passage 2 was not statistically significant; t(96) = 0.80, p = 0.4234, but the mean score differences between the Canadian speaker (M = 4.58, SD
= 2.19) and the Indian speaker (M = 3.12, SD = 2.23) in Passage 3 was statistically significant;
t(96) = 3.27, p = 0.0015. Therefore, it can be said that in Passage 1, the non-native speaker (Russian) was easier to understand than the native speaker (Australian), but in Passage 3, the native speaker (Canadian) was easier to understand than the non-native speaker (Indian). In Passage 2, there was no difference in listening comprehension levels between the American and Chinese speakers. Overall, these results indicate that non-native speakers’ accents are not a significant factor affecting listening comprehension.
4.2 Identifying Each Speaker’s Accent
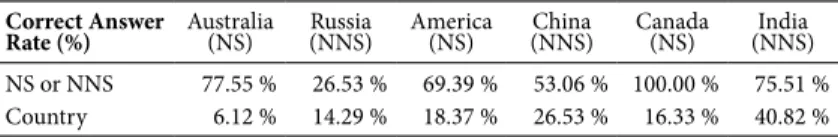
Table 3 shows the correct answer rate of identification of each speaker’s accent. In case of no answer, it was not included in each parameter. As shown in Table 3, overall, more than half of the participants (from 53.1% to 100%) could correctly identify whether the speaker was a native English speaker or non-native speaker, except for the Russian speaker. While all the participants could correctly identify the Canadian speaker as a native English speaker, depending on the accent, between 22.4% and 46.9% of participants could not correctly place the other speakers as native or non-native. Surprisingly, only 26.5% of the participants cor-
rectly identified the Russian speaker as a non-native speaker even though her accent was quite strong. Moreover, most of the participants could not identify where the speakers were from.
However, the participants seemed to be more able to correctly identify the nationality of the Indian speaker (40.8% correct) and the Chinse speaker (26.5%).
Table 3: Results of Questions regarding accent.
Correct Answer
Rate (%) Australia (NS) Russia
(NNS) America (NS) China
(NNS) Canada (NS) India
(NNS) NS or NNS 77.55 % 26.53 % 69.39 % 53.06 % 100.00 % 75.51 % Country 6.12 % 14.29 % 18.37 % 26.53 % 16.33 % 40.82 %
4.3 Preferences for the Accents
In the results of the questionnaire (as shown in Figure 2), about half of the participants (46.9%) did not have a preference towards native or non-native English accents. Also, most participants who answered “No particular preference” said that they did not know or recog- nize the differences between accents.
Both; 1.56%
Native; 42.19%
Non-native; 7.81%
No particularly; 46.88%
No answer; 1.56%
n = 64
Both Native Non-native No particularly No answer Figure 2: Preferences towards Native Non-native English speaker’s accent.
However, as shown in Table 4, when the participants listened to the native and non-native speakers’ English in this study, and then evaluated the clarity of each speaker’s accent on the Likert scale from 1 to 5, the paired sample t-test determined that the mean difference between each native speaker and non-native speaker clarity of accent scores for all speaker was statisti- cally significant. For the Australian speaker (M = 2.57, SD = 0.89) and the Russian speaker (M
= 3.45, SD = 0.94) in Passage 1; t(48) = 5.53, p < 0.0001, between the American speaker (M = 2.67, SD = 1.05) and the Chinese speaker (M = 3.02, SD = 0.92) in Passage 2; t(48) = 2.40, p = 0.0203 and between the Canadian speaker (M = 3.49, SD = 0.91) and the Indian speaker (M = 2.27, SD = 1.09) in Passage 3; t(46) = 5.93, p < 0.0001. Therefore, it can be said that non-native speakers’ English was clearer for the participants than native speakers’ English except for the combination between the Canadian and the Indian.
Table 4: Students mean clarity perception rating of the speakers’ accent Australia (NS) America (NS) Canada (NS)
2.57 2.67 3.49
Russia (NNS) China (NNS) India (NNS)
3.45 3.02 2.27
Note. 1 is “very unclear”, 5 is “very clear”.
4.4 Characteristics that Participants Think Affect Listening Comprehension
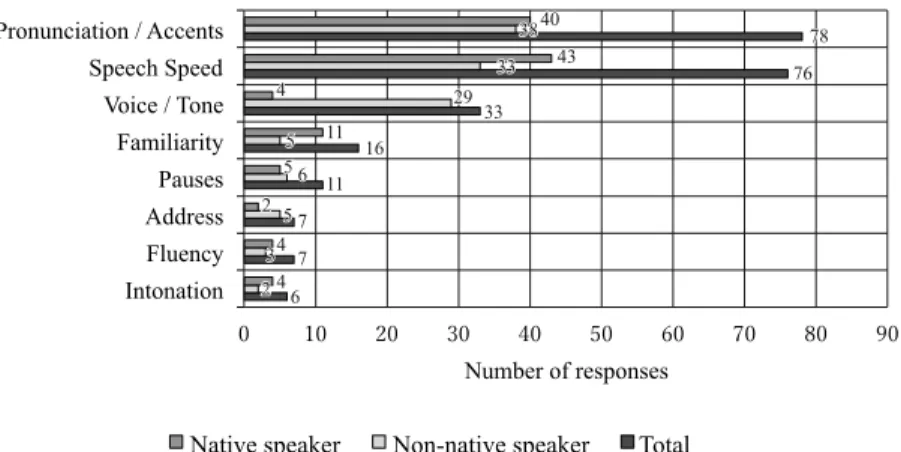
Figure 3 shows the participants’ feelings about what factors affect listening compression in English. As shown in Figure 3, the participants were more concerned about speaker’s pro- nunciation (accents) and speed when they listen to English. There was almost no difference in terms of which accent, native or non-native, students thought was clear or unclear. There was also little difference in opinions about voice clarity, tone, pauses and other issues, but more students said that the native speakers talked faster.
Intonation Fluency Address Pauses Familiarity Voice / Tone Speech Speed Pronunciation / Accents
Number of responses
Characteristics
Native speaker Non-native speaker Total
2 2 3 3 5 5 6 6
6 6 7 7 7 7 5 5
29 29
33 33 33 33 16
16
38 38
4 4 4 4 2 2 5 5
11 11 11 11 4 4
43 43 40
40 7878
76 76
Figure 3: What the participants felt as characteristic of each speaker.
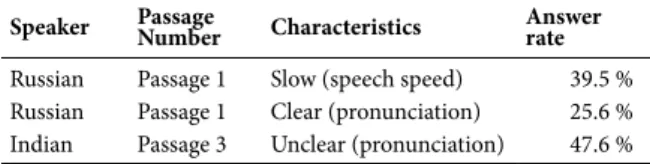
Then, I picked up the characteristics which were answered by more than a quarter of the stu- dents in the control group (as shown in Tables 5 and 6). Tables 5 and 6 show the prominent characteristics and answer rates about the native speakers and the non-native speakers. In terms of results, it can be said that for each conversation, the students’ views of the native and non-native speakers’ characteristics were opposite, except for the Russian speaker’s pronun- ciation.
Table 5: Prominent characteristics of the native speakers’ English.
Speaker Passage
Number Characteristics Answer rate Australian Passage 1 Fast (speech speed) 60.5 % Canadian Passage 3 Clear (pronunciation) 41.7 %
Table 6: Prominent characteristics of the non-native speakers’ English.
Speaker Passage
Number Characteristics Answer rate Russian Passage 1 Slow (speech speed) 39.5 % Russian Passage 1 Clear (pronunciation) 25.6 % Indian Passage 3 Unclear (pronunciation) 47.6 %
5. Discussion
5.1 Native and Non-native English Accents Effect on Comprehension Levels
In results, it depends on speakers’ accents and speech speed. In this study, speech speed, especially fast speed near 200 WPM, influenced the comprehension scores of native (Aus- tralian) and non-native (Russian) speakers’ English, and the accent, especially strong accent like Indian English accent, influenced the comprehension of non-native (Indian) speakers’
English. However, neither speed nor accent influenced the difference between native (Ameri- can) and non-native (Chinese) speaker’s English. Therefore, two theories can be put forward.
First, if speech speed is less than about 185 WPM, strong non-native speakers’ accents affect listening comprehension scores, but if speech speed is more than about 185 WPM, the speech speed affects more than non-native speakers’ accents. Second, if the difference in speakers’
speed is small, the score of native speakers will be higher than non-native speakers. However, it is limited to cases where both speakers’ speech speed is less than 185 WPM. O’ki (2012)
stated that 180 WPM is the borderline that Japanese EFL learners think difficult to listen and understand English. Also, Tauroza and Allison (1990) stated that the average of conversation speed for native speakers is between 190 and 230 WPM, even at the lowest, speech speed is 160 WPM. Thus, conversation by native English speakers at the natural speed is difficult for the Japanese EFL leaners to listen to and understand.
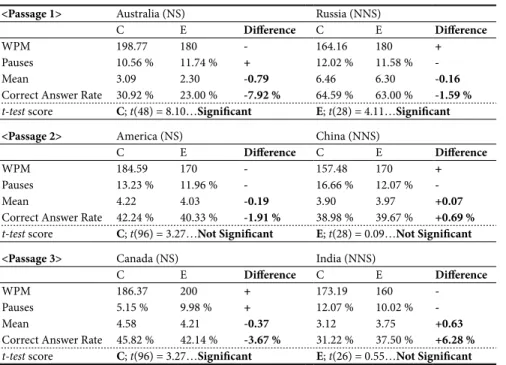
Based on this result and the theories, it was considered whether the comprehension scores will change if the native English speaker speaks at a speed less than 185 WPM. Therefore, an additional experiment was conducted on an experimental group which changed each speak- er’s speed and pauses. Passages were edited to change speed and pauses for the same listening materials using a free software called Sound Engine (by Windows Forest). The pause rate of all passage was nearly the same. Although Passages 1 and 2 were arranged at the same speed, Passage 3 was made the same situation as Passage 1 where there were significantly different scores. The results of the additional experiment with 15 participants are shown in Table 7.
Table 7: Result of comprehension tests between Control group and Experimental group.
<Passage 1> Australia (NS) Russia (NNS)
C E Difference C E Difference
WPM 198.77 180 - 164.16 180 +
Pauses 10.56 % 11.74 % + 12.02 % 11.58 % -
Mean 3.09 2.30 -0.79 6.46 6.30 -0.16
Correct Answer Rate 30.92 % 23.00 % -7.92 % 64.59 % 63.00 % -1.59 %
t-test score C; t(48) = 8.10…Significant E; t(28) = 4.11…Significant
<Passage 2> America (NS) China (NNS)
C E Difference C E Difference
WPM 184.59 170 - 157.48 170 +
Pauses 13.23 % 11.96 % - 16.66 % 12.07 % -
Mean 4.22 4.03 -0.19 3.90 3.97 +0.07
Correct Answer Rate 42.24 % 40.33 % -1.91 % 38.98 % 39.67 % +0.69 %
t-test score C; t(96) = 3.27…Not Significant E; t(28) = 0.09…Not Significant
<Passage 3> Canada (NS) India (NNS)
C E Difference C E Difference
WPM 186.37 200 + 173.19 160 -
Pauses 5.15 % 9.98 % + 12.07 % 10.02 % -
Mean 4.58 4.21 -0.37 3.12 3.75 +0.63
Correct Answer Rate 45.82 % 42.14 % -3.67 % 31.22 % 37.50 % +6.28 %
t-test score C; t(96) = 3.27…Significant E; t(26) = 0.55…Not Significant
Note. C means Control group, E means Experimental group
Table 7 shows the Words Per Minute, pauses, the mean and the correct answer rate for each speaker’s comprehension question between the Control group and the Experimental group.
“C” is the abbreviation for the control group, and “E” is for the experimental group.
A paired sample t-test compared both groups of students’ comprehension scores but showed there was no statistical difference. In terms of the mean and the mean difference in students’ comprehension scores, although the score difference between the two versions of Passage 3 was significantly large, the score did not change for Passage 1 and 2. Therefore, even when the researcher controlled the speed and pauses, the patterns of the score differences were all the same.
In terms of both results, in short, it can be thought that neither speed alone nor non-native speakers’ accents alone influenced comprehension scores, so the following theories can be put forward. The result scores were influenced by [1] familiarities with accents or [2] strength of accents. Regarding familiarities, Australian, Russian and Indian speakers are not so familiar for Japanese people, but American, Chinese and Canadian speakers are familiar. The Japan Exchange and Teaching Programme showed that of all the ALTs (Assistant Language Teach- ers) they employ in Japan, 2889 are Americans, 532 are Canadians but there are only 337 out of 5044 Australians in total. As Nagano (2017) and O’ki and Kaneko (2014) mentioned, most Japanese students were taught by American teachers, so they are only familiar with American English. Also, since all participants recognized the Canadian speaker as a native speaker, and 59.2% of the participants recognized the Canadian English as American English, which are very similar, Canadian English would be more equivalent to American English for Japanese EFL learners. Also, according to the questionnaire, 10.9% of the participants have opportuni- ties to listen to Chinese English. In addition, 28.1% of the participants learn Chinese as the second foreign language in TWCU, so it can be said that Chinese English is familiar to them.
Thus, as the participants were familiar with both speakers’ English in Passage 2, there was no statistically significant difference in comprehension scores. However, as the participants were not familiar with Russian and Australian English in Passage 1, why was there a statisti- cally significant difference? Because 34.7% of the participants identified the Russian English as American English, there may have been some characteristic about the Russian accent that students felt familiar with or that made it easier to understand, but why this was the case is unknown. Next, the most difficult accents to understand in this study were the Australian and Indian speakers. Regarding the strength of accents, Ockey and French (2014) found a significant interaction between strength of accents and familiarity with Australian accents.
They focused on the strength of American, British and Australian speakers’ accents, and they found the participants familiar with Australian English had higher comprehension scores even if Australian English accents were strong. Moreover, Indian English is called Hinglish in general, and is famous for having strong accent. In fact, while many previous researchers concluded that accent does not affect listening comprehension, Tara, Yanagisawa and Oshima (2010) concluded that accent was an influencing factor when comparing Hindi accented Eng- lish and British English. My results support this conclusion because they showed just how difficult Hinglish is. Finally, I concluded that regardless of native or non-native English, the familiarity for English accents or the strength of speaker’s accents influence the listening com- prehension more than simple accent.
5.2 Japanese University EFL Students´ Ability to Identify Speakers´ Accent and Relationship to Listening Comprehension
First, more than half of the participants (from 53.1% to 100%) correctly identified whether the speaker was a native English speaker or non-native speaker, except for the Russian speak- er. However, most participants (from 83.7% to 93.9%) could not correctly identify which country the speaker was from except for the Chinese and the Indian speakers. Second, cor- relation analysis showed that there was no correlation between the ability to identify accents and comprehension test scores (|r| = 0.211). One of the reasons for the results seems to be that Japanese university EFL students do not have enough opportunities to listen to non-native speaker’s English. In fact, according to the questionnaire, only 28.1% of the participants have had the opportunity to listen to non-native speaker’s English even though opportunities are increasing in society. However, most of the non-native English speakers that some partici- pants have met came from Asian countries such as China, South Korea, Myanmar, and Viet- nam. Overall, the results indicate that while many students can tell the difference between native and non-native accents, most students are not able to correctly identify the nationality of speakers, but this does not affect comprehension.
5.3 Japanese University EFL Students´ Preferences about the Accent of Each Speaker First, about half of the participants (46.9%) do not have a preference towards native or non-native English accents. The main reasons given were that participants did not think ac- cent matters as long as they can understand the content, and some said that they cannot tell the difference as they have not been exposed to non-native accents. Some students said that
the Chinese and the Indian speakers sounded similar to their English pronunciation but did not give a reason why. However, 42.1% of the students preferred native accents and common reasons given were that they are familiar with native speaker’s pronunciation, and that native speaker’s pronunciation is clear and fluent. Also, in terms of the Indian speaker, most of those that correctly identified the accent felt that the speaker’s pronunciation and intonation was peculiar, and many of the students who could not correctly identify said the same thing. On the other hand, those who preferred non-native speakers’ accents (7.8%) said that non-native speaker’s English is not too fast, so it is not hard to understand. However, according to the results of the evaluation of the clarity for each speaker’s accent (as shown in Table 4), there was a statistically significant difference between the native speakers and non-native speakers in each conversation. In summary, there were no clear preferences, but most students felt that non-native speakers’ English (which more than 60% of participants identified as native speak- ers) was clearer than the actual native speakers, except for the Canadian speaker.
5.4 Characteristics Japanese University EFL Students Think Affect Listening Comprehension
According to the questionnaire, the participants were most concerned about speaker’s pronunciation and speech speed when they listen to English, so I will discuss results with a focus on not only accent but also speed. As mentioned in 5.1, the Australian speaker’s speed was very fast and the Indian speaker’s accent was quite strong. Overall, the participants were able to recognize this; they knew the Australian spoke quickly and said the Indian speaker had a strong accent and rated both as not easy to understand. I think that when one speaker’s speed or accent is extremely fast or strong, the other speaker’s speed or accent seems slow or neutral for listeners.
Although my questionnaire only asked students’ impressions about native and non-native speakers’ accents, many participants wrote about speed and pauses, which produced interest- ing additional findings. It was found that worries about native speakers’ speech was mainly about speech speed and issues such as a word omission, but for non-native speakers, students were worried about unclear pronunciation like katakana English. Therefore, most partici- pants thought that native speaker’ speed and non-native speakers’ accent affect listening com- prehension.
6. Conclusion
There is a lot of research on the effect of accents on listening comprehensions, but there are few researchers who have focused on natural English and conversations as this study has.
This research revealed some interesting and new findings that can be added to the literature.
Firstly, in the case of natural conversation, more than 185 WPM speech speed and strong accents affect listening comprehension levels. The result showed that native speakers whose speed was more than 185 WPM (Australian), and non-native speakers whose accent was strong even when the speed was less than 185 WPM (Indian) were very difficult to under- stand. However, the result of controlled conversation showed that despite changing the native speaker’s speed to less than 185 WPM (Australian) and more than 185 WPM (Canadian), the pattern of the test scored did not change. Therefore, I conclude that not speech speed and non-native speaker’s accent but the familiarity of accents or the strength of the accent has the most influence.
In addition, more than half of the participants identified whether someone was a native or a non-native speaker except for the Russian speaker, but more than 80% of them could not identify where the speaker is from except for the Chinese and the Indian speakers. Also, the correct answer rate of identification and the correct answer rate of comprehension test scores were not correlated.
Third, about half of the participants did not have pronunciation preferences between na- tive and non-native speakers. The reason was that they do not have enough chance to listen to non-native speaker’s English or cannot recognize the difference of accents between a native speaker and a non-native speaker.
Finally, most participants thought that native speakers’ speed and non-native speaker’ ac- cent affect listening comprehension, and the natural conversation version tests showed the same result as they thought.
From the whole study, I found that most TWCU EFL students have never considered dif- ferences of accent or listened to non-native speaker’s English except for Japanese English. As I mentioned in sections 1.1 to 2.1, the opportunity to listen to non-native speakers’ English will increase in the future, so Japanese educational institutions should make more opportuni- ties for studeuts to listen to not only native speakers’ English but also non-native speakers’
English. Even if the accent is strong or unfamiliar, many students may think that it can be understood if the speed is slow, so it is important to start listening to various Englishes with a slow speed at first. Then they would be able to broaden their horizons by knowing Englishes